http://www.sciencepublishinggroup.com/j/ijfet doi: 10.11648/j.ijfet.20190302.11
ISSN: 2640-1576 (Print); ISSN: 2640-1584 (Online)
Quality Parameters of Composite Membranes for
Microencapsulation: Evaluation by Statistical Optimization
Kamaldeen Oladimeji Salaudeen
1, *, Ariahu Charles Chukwuma
2, Yusufu Muhammed Ikagu
21
Nigerian Stored Products Research Institute (NSPRI), Kano Station, Nigeria
2Department of Food Science and Technology, University of Agriculture, Makurdi, Nigeria
Email address:
*
Corresponding author
To cite this article:
Kamaldeen Oladimeji Salaudeen, Ariahu Charles Chukwuma, Yusufu Muhammed Ikagu. Quality Parameters of Composite Membranes for Microencapsulation: Evaluation by Statistical Optimization. International Journal of Food Engineering and Technology.
Vol. 3, No. 2, 2019, pp. 13-24. doi: 10.11648/j.ijfet.20190302.11
Received: August 13, 2019; Accepted: August 29, 2019; Published: November 5, 2019
Abstract:
Optimization of formulations in the manufacture of membrane is necessary to obtain the optimum concentration of base materials and plasticizer. The research was aimed to determine the optimum composition of the blends and that of the plasticizers in the manufacture of soy-protein isolate and cassava starch based membrane intended for food micro-particles. Soy-protein isolate and cassava starch blends were prepared and mixed at different proportions (100: 0%; 90: 10%; 80: 20%; 70: 30%; 60:40%; 50: 50% and 0:100%). Glycerol and sorbitol plasticizer were also prepared and mixed at different proportions (100: 0%; 80: 20% and 60: 40%). The experiment was conducted using response surface (User-Defined) method on design expert (version 11.1.0) software package. The response values of the membrane such as solubility, water vapor permeability, elongation at break, and puncture strength were best fitted into quadratic model while that of the tensile stresswas best fitted into linear model considering their values of predicted R2 and adjusted R2. The optimum formulation for the
manufacture of the composite membrane is B4 (70% soy-protein isolate and 30% cassava starch) and P2 (80% glycerol and
20% sorbitol) with the desirability value of 0.039. These optimum formulations provide responses for the membrane
parameters as membrane thickness of 0.24mm, vapor permeability of 16.06 g H2O mm m-2 day kPa, membrane solubility of
45.95%, tensile stress of 20.71 MPa, elongation at break of 13.65% and puncture strength of 2.37 kN.
Keywords:
Membrane, Modelling, Optimization, Soy-protein Isolate, Cassava Starch1. Introduction
Microencapsulation refers to a technology in which the bioactive components are completely enveloped, covered and protected by a physical barrier without any protrusion [1]. In recent years, food industry requires the addition of functional compounds such as bioactive molecules (e.g. antioxidants, minerals, vitamins, phytosterols, lutein, fatty acids, lycopene) and living cells (e.g. probiotics) into food products and these compounds are usually highly susceptible to environmental, processing and/or gastrointestinal conditions. Therefore, microencapsulation had been utilized for effective protection of these compounds [1, 2]. In microencapsulation technology, the sensitive substance to be encapsulated can be called the core while the material used to envelope or cover the
obtaining thin films and coatings to cover fresh or processed foods to extend their shelf life. Bio-polymers offer extra advantages such as edibility, biocompatibility, esthetic appearance, barrier to gasses properties, toxicity, non-polluting and its low cost [13]. This study is to optimize the blend and plasticizer compositions of the composite membrane. Optimization is the systematic formulation design required to minimize the number of trials, and analyze effect of the different compositions by the response surfaces for each quality parameter to obtain the appropriate formulations for optimum value of each quality parameter [14]. Optimization of the formulation using response surface methodology has been carried out on bio-polymers with a basis of whey protein, tapioca starch, corn starch, chitosan, tapioca starch and chitosan composite, xanthan gum, tapioca starch composite and plasticizer compositions [15-21] but no research had been reported on statistical optimization of the compositions for the soy-protein isolate and cassava starch based composite membrane. There is therefore the need to model and optimize the blends compositions (soy-protein isolate and cassava starch) and the plasticizer compositions (glycerol and sorbitol) in development of the composite membrane.
2. Materials and Methods
2.1. Source of Raw Materials
Fresh sweet cassava tubers were procured from “Yankaba”
market, Kano State, Nigeria. Soy protein isolate powders (natural flavor) was purchased from puritan’s pride at shop online: www.puritan.com and delivered by Konga (Kano state branch).
2.2. Extraction of Cassava Starch
A wet extraction method as described by [22] was used for cassava starch extraction. Three kilograms of fresh cassava tuber was manually peeled, washed with clean water and crushed to produce pulp. The pulp was suspended in cold
deionized water and sieved through a mesh (0.45mm); the fibrous materials was removed leaving the starch solution. The starch layer was suspended in deionized water and centrifuged six to seven times until the settled starch gives a firm, dense deposit on the bottom and is substantially free of fine fibre. The starch was recovered by filtration and dried at 55°C for 12 h and milled into powder. Figure 1 shows flow chart for cassava starch production.
Source: [23]
Figure 1. Flowchart for production of cassava starch.
2.3. Development of the Composite Membrane
2.3.1. Blend Formulation
Soy-protein isolate (SPI) and Cassava starch were blended
at different compositions (B1 = 100:0%; B2 = 90:10%; B3 =
80:20%; B4 = 70:30%; B5 = 60:40%, B6 = 50:50% and B7 =
0:100%). An electric blender was used in order to achieve homogenous blends.
Table 1. Soy protein and Cassava Starch Blend Formulation Ratio.
B1 (S:C) % B2 (S:C) % B3 (S:C) % B4 (S:C) % B5 (S:C) % B6 (S:C)% B7 (S:C) %
100:0 90:10 80:20 70:30 60:40 50:50 0:100
Note: S: C = Ratio of Soy-protein isolate and Cassava starch
2.3.2. Preparation of the Membrane
Casting method described by [24] was used for the development of the composite membranes. All soy-protein
isolate and cassava starch blend compositions (B1, B2, B3, B4,
B5, B6, and B7) and plasticizer’s compositions (P1 = glycerol,
P2 = glycerol: sorbitol (80:20) and P3 = glycerol: sorbitol
(60:40)) were utilized in the membrane development as shown in table 2. [23] concluded that addition of up to 20% glycerol level enhanced the sensory, mechanical and barrier properties of cassava starch–soy-protein concentrate edible films. Based on this, 20% of all the plasticizer compositions were used. Below are procedural steps followed during
development of the membranes.
1. Preparation of membrane forming suspension
i. 20% of each Plasticizer composition (v/w of the
blends) was added to 200ml of distilled water
ii.10g of each composite blends ratio was also added
making 5% (w/v) of overall distilled water content independently of plasticizer. The solution was homogenously mixed together using magnetic stirrer
iii.The pH of the membrane-forming suspension was
adjusted to 9.98 with 1 M sodium hydroxide and the pH of the solution was ascertained using pH meter.
i. The membrane-forming suspension was heated in a beaker on a hot plate at 90°C for 5 min with continuous stirring using a glass rod to obtain the membrane-forming solution.
ii.The membrane-forming solution was cooled to 40°C
3. Casting of the Membranes
i. The membrane forming solution was casted onto flat,
levelled, non-stick trays to set.
ii.Once set, the trays were held overnight in an oven at
35°C before peeling the membranes off the plates to enable complete setting of the membranes.
4. Conditioning of the membranes
i. Membrane samples were conditioned prior to
evaluation at 52% relative humidity and 25°C temperature in desiccators over diluted sulphuric acid solution for 72 h.
Flowchart for production of the membrane is shown in figure 2. figures 3 and 4 are pictorial view for drying and conditioning of the membrane respectively.
Source: [23]
Figure 2. Flowchart for the membrane production.
Figure 3. Drying of the bio-polymer.
Figure 4. Conditioning of the bio-polymer.
Determination of the Membrane Quality Parameters
2.4. Effect of Blend and Plasticizer Compositions on Quality Parameters of the Membranes
Effect of blend and plasticizer compositions on the membrane quality parameters such as film thickness, water vapour barrier, membrane solubility, mechanical properties (tensile strength, elongation at break and puncture strength), were determined.
2.4.1. Membrane Thickness Measurement
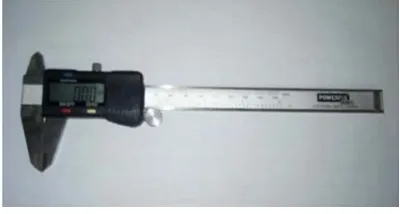
Thickness of the membrane as affected by blends compositions and plasticizers type was measured using electronic digital Vernier caliper. The thickness of each membrane was measured randomly in six different parts of the membrane and the average value was taken as the membrane thickness. Figure 5 show pictorial view of the digital Vernier caliper.
Figure 5. Digital Vernier caliper.
2.4.2. Water Vapor Barrier of the Membrane
weight is reached. Weight loss was plotted over time to obtain water vapor transmission rate (C) which is the slope of the linear regression of weight loss vs. time of the bio-polymer samples. WVP was calculated from the equation given by [25] as:
CX WVP
A P
=
× ∆ (g H2O mm m-2 day kPa) (1)
Where X is the bio-polymer thickness (m), A is area of the
exposed bio-polymer (m2), C is the slope of the weight loss
of the dish, to the nearest 0.0001 g, vs. time and ∆P is the partial vapor pressure difference (Pa) across the two sides of
the bio-polymer. Partial vapor pressure of the liquid (H2O
and diluted H2SO4) across the two sides of the bio-polymer
was determined using psychometric chart.
2.4.3. Membrane Solubility
The solubility of bio-polymer samples which is a parameter of biodegradability of bio-polymer was determined according to the method described by [26]. Bio-polymer samples were
dried at 105oC for 24 h and weighed (W1). Each sample was
then immersed into in 50 mL conical flask containing 20mL of 1 M hydrochloric acid solution. The conical flasks were capped using cocks and placed in a shaking water bath for 24 h at 25°C. The solution was then filtered, and the residues
remained on the filter paper was dried in an oven at 105oC for
24 h after which the samples was weighed to determine the dry
matter soluble in water (W2). Solubility was calculated using
the formula given by [26] as:
% Film solubility 1 2
1
100
w w
w
−
= × (2)
2.4.4. Mechanical Properties of the Membranes
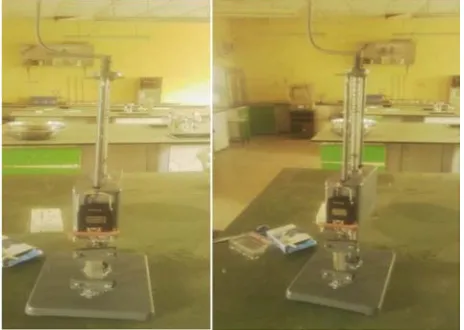
Mechanical properties such as tensile stress, elongation at break, and puncture strength were determined using manually operated mechanical testing machine for bio-polymer which was locally fabricated for this research purpose. Parts of this machine include digital force gauge, grips, screw and frame as shown in figure 6.
Figure 6. Manually operated mechanical testing machine for edible films.
Constructed by: Kamaldeen Oladimeji Salaudeen
i. Tensile strength (TS)
Membrane strips (30 x 60 mm) were mounted to grips of the digital mechanical testing machine. Manually rotating the screw of this machine enables pulling of the membrane strips vertically upward and the reading of the force applied was measured by the digital force gauge. The maximum force required to rupture each membrane sample was read from the digital display of the device. TS was calculated by dividing the maximum force to rupture (F) and the cross-section area of the membrane (A). The cross-section area (A) was obtained by multiplying the width and the average thickness of the membrane strips. TS was calculated using the formula given by [26, 27]:
F TS
A
= (N/m2) (3)
Where, F = maximum force to rapture the membrane (N)
A = cross-sectional area of the membrane (m2)
ii.Elongation at break (EAB)
Elongation at break was calculated by dividing change in length of the membrane strips when the rupture occurred by the original length of the membrane strips before loading. This was calculated using the formula given [27, 25]:
1
100
L EAB
L
∆
= × (4)
Where ∆L = L2 – L1
L1 = original length (mm)
L2 = final length after rupture of the bio-polymer (mm)
iii.Puncture test
Puncture test was conducted to determine force required to puncture the membrane. This was carried out using the manual mechanical testing machine. The puncture test was conduction using method described by [25]. Samples with diameters of 40 mm were fixed on the hollow plate of 20 mm internal dimeter using silicon gum. A cylindrical probe of 3 mm diameter attached to digital force gauge of the testing machine was moved perpendicularly to the membrane surface until the probe passed through the film. At rupture point, deformation force was measured.
2.4.5. Modelling and Optimization of the Membrane Quality Parameters
a. Modelling of the membrane quality parameters (responses)
Modelling and optimization of the membrane quality parameters were carried out using response surface method on design expert (version 11.1.0) software package. For the 7 blend compositions and 3 plasticizer compositions as factors (7 × 3 factorial design), a total 21 trial formulations were generated as independent variables. Membrane thickness,
membrane solubility (%), Water vapor permeability (g H2O
mm m-2 day kPa), Tensile stress (MPa), Elongation at break
(%), and Puncture strength (kN) were evaluated as dependent variables (responses). The composition variables (factors)
parameters) are reported in Table 2. The mean values of the investigated responses measured for all trial formulations in the 7 × 3 factorial design were fitted to get model equations.
Best‑fitting mathematical models were determined based on
the comparison of statistical parameters such as adjusted
multiple correlation coefficient (adjusted‑R
2
), and predicted
multiple correlation coefficient (predicted‑R
2
).
b. Optimization of membrane formulations
Optimization of the membrane compositions were carried out based on the criteria of the film thickness, vapor permeability, film solubility, tensile strength, elongation at break and puncture strength. The blend and plasticizer compositions were set in the
range of the lower and upper limit. Vapor permeability, film solubility and elongation at break criterion were given a weighting of 5 (highest) while other responses such as tensile stress, film thickness and puncture strength were given a weighting of 3 (moderate). This weighting was done based on the importance of each characteristic of the membrane as a need for food encapsulation, where the Vapor permeability, film solubility and elongation at break determine the ability of the membrane to protect the core against moisture during storage, enhance release rate of the core and enhance plasticity of the membrane respectively.
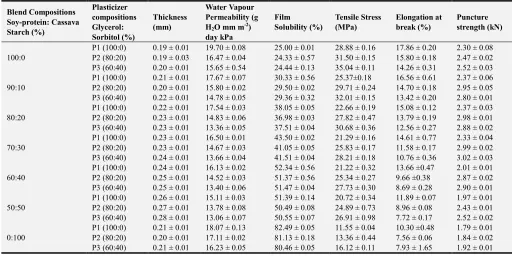
Table 2. Formulation variables and their corresponding experimental values.
Blend Compositions Soy-protein: Cassava Starch (%)
Plasticizer compositions Glycerol: Sorbitol (%)
Thickness (mm)
Water Vapour Permeability (g H2O mm m-2)
day kPa
Film Solubility (%)
Tensile Stress (MPa)
Elongation at break (%)
Puncture strength (kN)
100:0
P1 (100:0) 0.19 ± 0.01 19.70 ± 0.08 25.00 ± 0.01 28.88 ± 0.16 17.86 ± 0.20 2.30 ± 0.08
P2 (80:20) 0.19 ± 0.03 16.47 ± 0.04 24.33 ± 0.57 31.50 ± 0.15 15.80 ± 0.18 2.47 ± 0.02
P3 (60:40) 0.20 ± 0.01 15.65 ± 0.54 24.44 ± 0.13 35.04 ± 0.11 14.26 ± 0.31 2.52 ± 0.03
90:10
P1 (100:0) 0.21 ± 0.01 17.67 ± 0.07 30.33 ± 0.56 25.37±0.18 16.56 ± 0.61 2.37 ± 0.06
P2 (80:20) 0.20 ± 0.01 15.80 ± 0.02 29.50 ± 0.02 29.71 ± 0.24 14.70 ± 0.18 2.95 ± 0.05
P3 (60:40) 0.22 ± 0.01 14.78 ± 0.05 29.36 ± 0.32 32.01 ± 0.15 13.42 ± 0.20 2.80 ± 0.01
80:20
P1 (100:0) 0.22 ± 0.01 17.54 ± 0.03 38.05 ± 0.05 22.66 ± 0.19 15.08 ± 0.12 2.37 ± 0.03
P2 (80:20) 0.23 ± 0.01 14.83 ± 0.06 36.98 ± 0.03 27.82 ± 0.47 13.79 ± 0.19 2.98 ± 0.01
P3 (60:40) 0.23 ± 0.01 13.36 ± 0.05 37.51 ± 0.04 30.68 ± 0.36 12.56 ± 0.27 2.88 ± 0.02
70:30
P1 (100:0) 0.23 ± 0.01 16.50 ± 0.01 43.50 ± 0.02 21.29 ± 0.16 14.61 ± 0.77 2.33 ± 0.04
P2 (80:20) 0.23 ± 0.01 14.67 ± 0.03 41.05 ± 0.05 25.83 ± 0.17 11.58 ± 0.17 2.99 ± 0.02
P3 (60:40) 0.24 ± 0.01 13.66 ± 0.04 41.51 ± 0.04 28.21 ± 0.18 10.76 ± 0.36 3.02 ± 0.03
60:40
P1 (100:0) 0.24 ± 0.01 16.13 ± 0.02 52.34 ± 0.56 21.22 ± 0.32 13.66 ±0.47 2.01 ± 0.01
P2 (80:20) 0.25 ± 0.01 14.52 ± 0.03 51.37 ± 0.56 25.34 ± 0.27 9.66 ±0.38 2.87 ± 0.02
P3 (60:40) 0.25 ± 0.01 13.40 ± 0.06 51.47 ± 0.04 27.73 ± 0.30 8.69 ± 0.28 2.90 ± 0.01
50:50
P1 (100:0) 0.26 ± 0.01 15.11 ± 0.03 51.39 ± 0.14 20.72 ± 0.34 11.89 ± 0.07 1.97 ± 0.01
P2 (80:20) 0.27 ± 0.01 13.78 ± 0.08 50.49 ± 0.08 24.89 ± 0.73 8.96 ± 0.08 2.43 ± 0.01
P3 (60:40) 0.28 ± 0.01 13.06 ± 0.07 50.55 ± 0.07 26.91 ± 0.98 7.72 ± 0.17 2.52 ± 0.02
0:100
P1 (100:0) 0.21 ± 0.01 18.07 ± 0.13 82.49 ± 0.05 11.55 ± 0.04 10.30 ±0.48 1.79 ± 0.01
P2 (80:20) 0.20 ± 0.01 17.11 ± 0.02 81.13 ± 0.18 13.36 ± 0.44 7.56 ± 0.06 1.84 ± 0.02
P3 (60:40) 0.21 ± 0.01 16.23 ± 0.05 80.46 ± 0.05 16.12 ± 0.11 7.93 ± 1.65 1.92 ± 0.01
Mean and standard deviation of triplicate determination for the membrane quality parameters
3. Results and Discussion
3.1. Summary of the Model Statistics
Table 3 shows model summaries for measured quality parameter of the membranes
Table 3. Model summary for measured quality parameters of the membranes.
Response Model Adjusted R2 (%) Predicted R2 (%)
Film Thickness
Linear 0.1552 -0.0759
2F 0.1060 -0.3285
Quadratic 0.5627 0.3481
Film Solubility
Linear 0.8049 0.8527
2F 0.7474 0.8441
Quadratic 0.8226 0.8899
Water Vapor Permeability
Linear 0.2999 0.4782
2F 0.1183 0.4796
Quadratic 0.7209 0.8176
Tensile Stress
Linear 0.7630 0.8167
2F 0.7065 0.8073
Quadratic 0.7278 0.8370
Elongation at break
Linear 0.9444 0.9541
2F 0.9339 0.9515
Response Model Adjusted R2 (%) Predicted R2 (%)
Puncture strength
Linear 0.2821 0.4188
2F 0.1006 0.3853
Quadratic 0.7433 0.8724
From results table 3, considering the highest values of
adjusted R2 and predicted R2,it can be observed that the film
thickness, film solubility, vapor barrier, elongation at break and puncture strength were fitted best into quadratic models,
while tensile stress was best fitted into linear model.
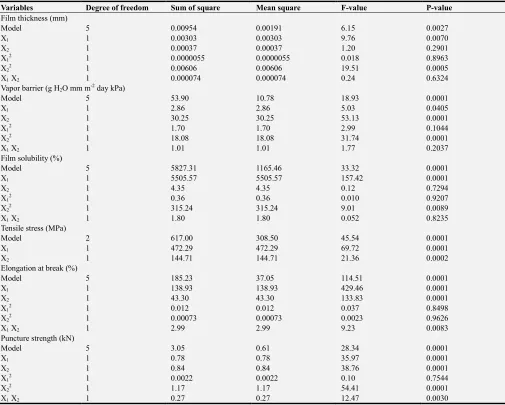
a. Modelling of the membrane quality parameters
Table 4 shows the statistical analysis from modelling of the membrane quality parameters.
Table 4. Statistical analysis from the modelling of the membrane quality parameters.
Variables Degree of freedom Sum of square Mean square F-value P-value
Film thickness (mm)
Model 5 0.00954 0.00191 6.15 0.0027
X1 1 0.00303 0.00303 9.76 0.0070
X2 1 0.00037 0.00037 1.20 0.2901
X12 1 0.0000055 0.0000055 0.018 0.8963
X22 1 0.00606 0.00606 19.51 0.0005
X1 X2 1 0.000074 0.000074 0.24 0.6324
Vapor barrier (g H2O mm m-2 day kPa)
Model 5 53.90 10.78 18.93 0.0001
X1 1 2.86 2.86 5.03 0.0405
X2 1 30.25 30.25 53.13 0.0001
X12 1 1.70 1.70 2.99 0.1044
X22 1 18.08 18.08 31.74 0.0001
X1 X2 1 1.01 1.01 1.77 0.2037
Film solubility (%)
Model 5 5827.31 1165.46 33.32 0.0001
X1 1 5505.57 5505.57 157.42 0.0001
X2 1 4.35 4.35 0.12 0.7294
X12 1 0.36 0.36 0.010 0.9207
X22 1 315.24 315.24 9.01 0.0089
X1 X2 1 1.80 1.80 0.052 0.8235
Tensile stress (MPa)
Model 2 617.00 308.50 45.54 0.0001
X1 1 472.29 472.29 69.72 0.0001
X2 1 144.71 144.71 21.36 0.0002
Elongation at break (%)
Model 5 185.23 37.05 114.51 0.0001
X1 1 138.93 138.93 429.46 0.0001
X2 1 43.30 43.30 133.83 0.0001
X12 1 0.012 0.012 0.037 0.8498
X22 1 0.00073 0.00073 0.0023 0.9626
X1 X2 1 2.99 2.99 9.23 0.0083
Puncture strength (kN)
Model 5 3.05 0.61 28.34 0.0001
X1 1 0.78 0.78 35.97 0.0001
X2 1 0.84 0.84 38.76 0.0001
X12 1 0.0022 0.0022 0.10 0.7544
X22 1 1.17 1.17 54.41 0.0001
X1 X2 1 0.27 0.27 12.47 0.0030
b. Membrane thickness
Films thickness is an important characteristic in determining the feasibility of edible films as packaging materials for food products since the thickness of the films affects other characteristics of the films, such as tensile strength, elongation, and water vapor permeability [29, 27]. It can be observed from results table 4 that the quadratic model shows p value 0.0027, implying that the chance of the model error is less than 5%. This indicates that the quadratic model is suitable for the film thickness. The actual quadratic equation of the film thickness response is as follow:
Y = 0.046 X1+0.00398X22+0.393 (5)
Description: Y = Film thickness (mm)
X1 = Blend compositions (%)
X2 = Plasticizer compositions (%)
From the statistical analysis in table 4, it can be observed that the factors which significantly (p < 0.05) affect the film
thickness response were the blend composition (X1), and the
square of the plasticizer composition (X22), while the
plasticizer compositions (X2), square of the blend
compositions (X12) and the interaction between the
treatments (X1 X2) did not significantly (p > 0.05) affect the
film thickness response. Positive values of coefficients X1 in
cassava starch in the soy-protein isolate blend led to increase in the film thickness. Increasing the thickness due to the effect of an increase base material composition had previously been reported by other researchers [30, 21]. The response surface plot of the blend and plasticizer effects against the film thickness is shown in figure 7.
Figure 7. Effect of blend and plasticizer compositions on film thickness.
It can be observed from the figure that the film thickness
increases in a quadratic curve from B1 (100% soy-protein
isolate based membrane) to B6 (composite of 50%
soy-protein isolate and 50% cassava starch based membrane) and
then sharply decreases to B7 (100% cassava starch). Cassava
starch based membrane (100% cassava starch) is observed to be higher in thickness than that of the soy-protein isolate based membrane (100% soy-protein isolate). Observation from this figures also showed that mixture of soy-protein isolate and cassava starch as a composite led to improved thickness of the membrane. This is to further confirm that base material compositions affect the film thickness [30]. For the effect of blend compositions on the membrane thickness, it can be observed from the figure that the percentage composition of glycerol and sorbitol did not affect the film thickness.
c. Vapor permeability of the membranes
Determination of vapor permeability of the membrane is very important in this research since the membrane is intended for microencapsulation of carrot powders. Higher vapor permeability of the membrane can enhance the rate of carotene oxidation and increase the rate of micro-organism growth [31] both of which are main factors that can affect shelf life of the carrot micro-particles. It can be observed from results table 4 that the quadratic model shows p value 0.0001 for the membrane vapor permeability, implying that the chance of the model error is less than 5%. This indicates that the quadratic model is suitable for the vapor permeability of the membrane. The actual quadratic equation of the solubility response is as follow:
Y = 14.24-0.55 X1-1.47 X2+0.46 X22 (6)
(X12 and X1X2 not significant)
Description: Y = vapor barrier (g H2O mm m-2 day kPa)
X1 = blend compositions (%)
X2 = plasticizer compositions (%)
From the statistical analysis in table 4, it can be observed that the factors which significantly (p < 0.05) affect the vapor
permeability response were the blend composition (X1), the
plasticizer compositions (X2), and the square of the
plasticizer composition (X22), while square of the blend
compositions (X12) and the interaction effect between the
treatments (X1X2) did not significantly (p > 0.05) affect the
vapour permeability response. Negative values of coefficients
X1 and X2 in the equation (6) showed that the addition of
cassava starch to soy-protein isolate (blends) and the addition of sorbitol to glycerol (plasticizer) significantly reduced the membrane vapor permeability. This implies that interactive effect of blend compositions (soy-protein isolate and cassava starch combinations) and plasticizer compositions (glycerol and sorbitol combinations) led to decrease in vapor permeability of the membrane. [23] reported that the combination of cassava starch and soy-protein concentrate blend resulted into lower vapor permeability. [32] also reported the decrease in vapor permeability when they evaluated the effect of glycerol and sorbitol on cassava starch biodegradable films. The response surface plot of the blend and plasticizer effects against the film solubility is shown in figure 8.
Figure 8. Effect of blend and plasticizer compositions on vapour permeability.
It can be observed from the figure that the vapor permeability of the membranes tends to decrease in a quadratic curve up to the middle as the percentage of cassava starch increases in the soy-protein isolate blend but increase above the middle as the percentage of soy-protein reduces in the cassava starch based membrane. The vapor permeability
steadily decreases from B1 (100% soy-protein isolate)
through B2 (90% soy-protein isolate and 10% cassava
starch), B3 (80% soy-protein isolate and 20% cassava starch),
up to B4 (70% soy-protein isolate and 30% cassava starch)
then increase sharply to B5 (60% soy-protein isolate and 40%
starch) up to B7 (100% cassava starch). This implies that
cassava starch plays a key role in lowering the vapor permeability of the membrane. For plasticizer compositions, the vapor permeability of membrane decreases sharply as the percentage of sorbitol added to glycerol increases. The
membrane vapor permeability decreases steadily from P1
(100% glycerol), to P2 (80% glycerol and 20% sorbitol) and
was the least at P3 (60% glycerol and 40% sorbitol).
d. Membrane solubility
Determination of the membranes solubility before the product utilization might be crucial as in encapsulation of foods or additives since this affects the release rate of the core [33, 34]. It can be observed from results table 4 that the quadratic model shows p value 0.0001, implying that the chance of the model error is less than 5%. This indicates that the quadratic model is suitable for the solubility of the membrane. The actual quadratic equation of the solubility response is as follow:
Y = 24.29 X1 + 0.62 X2
2
+ 40.50 (7)
(X2, X12 and X1X2 not significant)
Description: Y = film solubility (%)
X1 = blend compositions (%)
X2 = plasticizer compositions (%)
From the statistical analysis in table 4, it can be observed that the factors which significantly (p < 0.05) affect the membrane solubility response were the blend composition
(X1), and the square of the plasticizer composition (X22).
While the plasticizer compositions (X2), square of the blend
compositions (X12) and the interaction between the
treatments (X1 X2) did not significantly (p > 0.05) affect the
membrane response. Positive values of coefficients X1 in the
equation (6) showed that increasing the percentage of cassava starch in the soy-protein isolate blend led to increase in the membrane solubility. Increasing the film solubility due to the effect of an increase in percentage of cassava starch added to soy-protein concentrate had also been reported by [23]. The response surface plot of the blend and plasticizer effects against the film solubility is shown in figure 9.
Figure 9. Effect of blend and plasticizer compositions on film solubility.
It can be observed from the figure that the sample code
B7 (100% cassava starch based membrane) had the highest
solubility while that of the B1 (100% soy-protein isolate
based membrane) had the least solubility. It can also be observed that the more the amount of cassava starch in soy-protein isolate blends, the higher the membrane
solubility as it can be seen from the figure that B6 (50%
soy-protein isolate and 50% cassava starch based membrane) is higher in terms of solubility than that of the
B5 (60% soy-protein isolate and 40% cassava starch based
membrane) and the results follow the same trend. For the effect of plasticizer compositions on the membrane solubility, it can be observed from the figure that the percentage composition of glycerol and sorbitol did not affect the film solubility.
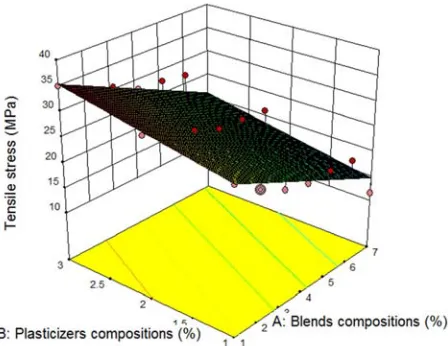
e. Tensile stress of the membrane
Tensile stress expresses the maximum stress developed in a film during a tensile test; it offers a measure of integrity as well as heavy duty use potential for films [35]. High tensile stress is generally required for edible films, but this depends on the intended application of the films [34]. It can be observed from results table 4 that the linear model shows p value 0.0001 for the membrane tensile stress, implying that the chance of the model error is less than 5%. This indicates that the linear model is suitable for the tensile stress of the membrane. The actual linear equation of the tensile stress response is as follow:
Y = 3.21 X2-7.11 X1 + 25.09 (8)
Description: Y = Tensile stress (MPa)
X1 = blend compositions (%)
X2 = plasticizer compositions (%)
From the statistical analysis in table 4, it can be
observed that both factors (X1 and X2) significantly (p <
0.05) affect the tensile stress response. Negative value of
coefficients X1 in the equation (8) showed that increase in
percentage of cassava starch added in soy-protein isolate blends decreased tensile stress of the membrane linearly. The decrease in tensile strength of soy-protein isolate based membranes because of cassava starch addition could be explained by the fact that the lower the protein content in film-forming solution, the lower the aggregation of protein that might have improved the film strength [36].
Positive value of coefficients X2 in the equation (8)
Figure 10. Effect of blend and plasticizer compositions on tensile stress.
It can be observed from the figure that the 100%
soy-protein isolate based membrane (B1) had the highest value of
tensile stress followed by B2 (composite of 90% soy-protein
isolate and 10% cassava starch) while that of 100% cassava
starch based membrane (B7) had the least value of tensile
stress. This implies that addition of cassava starch to soy-protein isolate based membrane limits the strength of the membrane but compare with the cassava starch based membrane, composite of soy-protein isolate and cassava starch significantly resulted to higher values of tensile stress. Similarly, from the figure it can be observed that only glycerol plasticizer (P1) resulted to the least value of tensile
stress of the membrane followed by P2 (combination of 80%
glycerol and 20% sorbitol) while P3 (combination of 60%
glycerol and 40% sorbitol) had the highest tensile stress.
f. Elongation at break of the membrane
Elongation at break (EAB) is the ability of the films to extend before breaking. It describes the nature of the film plasticity. Plasticity is generally required for a film to maintain its integrity when applied to food products [29, 28]. It can be observed from results table 4 that the quadratic model shows p value 0.0001 for the membrane EAB, implying that the chance of the model error is less than 5%. This indicates that the model is suitable for the EAB of the membrane. The actual equation of the EAB response is as follow:
Y = 11.71 - 3.86 X1 - 1.76 X2 - 0.044 X1X2 (9)
Description: Y = Elongation at break (%)
X1 = blend compositions (%)
X2 = plasticizer compositions (%)
From the statistical analysis in table 4, it can be observed that the factors which significantly (p < 0.05) affect the EAB
response were X1 (blend composition), X2 (plasticizer
composition) and interactive effect of X1X2 (blend compositions
and plasticizer composition) while square of blend composition
X12 and square of plasticizer composition X22 did not
significantly (p > 0.050 affect the EAB. Negative value of
coefficients X1 in the equation (9) shows that increase in
percentage of cassava starch added in soy-protein isolate based
membrane decreases plasticity (EAB) of the membrane linearly. [38] had previously reported that addition of starch to protein based film significantly reduce its flexibility. Negative value of coefficients X2 in the equation (9) indicates that increase in
percentage of sorbitol added in glycerol decreases plasticity (EAB) of the membrane. [37] reported a decrease in elongation at break of the film as a result of interaction between sorbitol
and glycerol. Negative value of coefficients X1X2 in the
equation (9) indicates antagonistic effect on the elongation at break of the membrane [21]. The response surface plot of the blend and plasticizer effects against the film solubility is shown in figure 11.
Figure 11. Effect of blend and plasticizer compositions on elongation at break.
It can be observed from the figure that the 100% soy-protein
isolate based membrane (B1) had the highest EAB followed by
B2 (composite of 90% soy-protein isolate and 10% cassava
starch) while that of 100% cassava starch based membrane (B7)
had the least EAB value. This implies that addition of cassava starch to soy-protein isolate based membrane limits the EAB property of the membrane but compare with the cassava starch based membrane, composites of soy-protein isolate and cassava starch significantly resulted to improved elongation at break of the film. Similarly, from figure 11 it can be observed
that 100% glycerol plasticizer (P1) resulted to the highest EAB
while P2 (combination of 80% glycerol and 20% sorbitol) and
P3 (combination of 60% glycerol and 40% sorbitol) were
similar in EAB and both were lower than that of 100% glycerol plasticized membrane.
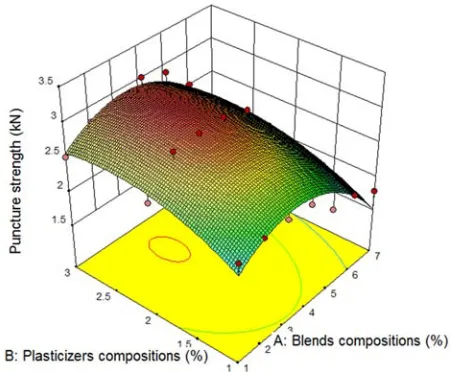
g. Puncture strength of the membrane
Y = 2.92 - 0.29 X1 + 0.24 X2 + 0.019 X1X2 - 0.24 X2 2
(10)
Description: Y = Puncture strength (kN)
X1=blend compositions (%)
X2=plasticizer compositions (%)
From the statistical analysis in table 4, it can be observed that the factors which significantly (p < 0.05) affect the EAB
response were X1 (blend composition), X2 (plasticizer
composition), interactive effect of X1X2 (blend compositions
and plasticizer composition) and square of plasticizer
composition X2
2
while square of blend composition X1
2
did not significantly (p > 0.050) affect the elongation at break. The response surface plot of the blend and plasticizer effects against the puncture strength is shown in figure 12.
Figure 12. Effect of blend and plasticizer compositions on puncture strength.
It can be observed from the figure that the membrane puncture strength tends to increase in a quadratic curve from
B1 (100% cassava starch) to the B4 (composite of 70%
soy-protein isolate and 30% cassava starch based membrane) and
then steadily decrease to B7 (100% cassava starch).
Observation from this figure showed that combining soy-protein isolate with cassava starch as a composite blend to develop a membrane led to improved puncture strength. This could be attributed to strong interaction between protein and starch that led to the formation of a dense matrix resulting in improved puncture strength [35]. Similarly, from the figure it can be observed that the puncture strength tends to increase
in a quadratic curve from P1 (100% glycerol) up to P3
(composite of 60% glycerol and 40% sorbitol based plasticizer). The higher the percentage of sorbitol in the composite of glycerol and sorbitol based plasticizer, the higher the membrane puncture strength meaning that sorbitol plays a key role in the improvement of the puncture strength.
3.2. Optimization of the Membrane
Simulation program Design Expert (version 11.1.0) generates an optimum solution formulation for the manufacture of the
composite membrane which is B4 (70% soy-protein isolate and
30% cassava starch) and P2 (80% glycerol and 20% sorbitol)
with the desirability value of 0.039. This optimum formulation provides responses for the membrane parameters such as membrane thickness of 0.24 mm, vapor permeability of 16.06 g
H2O mm m-2 day kPa, membrane solubility of 45.95%, tensile
stress of 20.71 MPa, elongation at break of 13.65% and puncture strength of 2.37 kN.
4. Conclusion
Soy-protein isolate and cassava starch based Bio-polymer (Polymeric membrane) had been successfully developed and its quality parameters had been modelled and optimized. The membrane thickness, membrane solubility, vapor barrier, elongation at break and puncture strength were fitted best into quadratic models, while tensile stress was best fitted into linear model. The Blend compositions (soy-protein isolate: cassava starch) of 70:30 and Plasticizers compositions (glycerol: sorbitol) of 80:20 were found to be the optimum compositions in the development of the composite membrane with a desirability value of 0.039. Quality parameters at these optimum compositions are membrane thickness of 0.24 mm,
vapor permeability of 16.06g H2O mm m-2 day kPa,
membrane solubility of 45.95%, tensile stress of 20.71 MPa, elongation at break of 13.65% and puncture strength of 2.37 kN.
Acknowledgements
Kamaldeen Oladimeji Salaudeen is grateful to Nigerian Stored Products Research Institute (NSPR) and CEFTER for the award of postgraduate fellowship.
References
[1] Desai K. G. H. & Park H. J., (2005) Recent Developments in Microencapsulation of Food Ingredients. Drying Technol., 23: 1361–94.
[2] Fang Z. & Bhandari B. (2009). Encapsulation of polyphenols: A Review. Trends Food Sci Technol 21: 510-23.
[3] Vos P., Faas M. M., Spasojevic M. & Sikkema J. (2010). Review: Encapsulation for Preservation of Functionality and Targeted Delivery of Bioactive Food Components. Int Dairy Journal, 20: 292-302.
[4] Seydim A. C., and Sarikus G., (2006). Antimicrobial Activity of Whey Protein Based Edible Films Incorporated with Oregano, Rosemary and Garlic Essential Oils. Food Research International, 39, 639–644. www.sciencedirect.com
[5] Alicia H., Fre´de´ric D., Laurent B., Thomas K., and Andrée V., (2008). Protection of Active Aroma Compound against Moisture and Oxygen by Encapsulation in Biopolymeric Emulsion-Based Edible Films. Biomacromolecules, 3 (9) 1058–1063. www.sciencedirect.com
[7] Helena C. F. C., Renata V. T., Carlos R. F. G., and Míriam D. H., (2013). Encapsulation Efficiency and Oxidative Stability of Flaxseed Oil Microencapsulated by Spray Drying Using Different Combinations of Wall Materials. Journal of Food
Engineering, 11 (5), 443–451.
www.elsevier.com/locate/jfoodeng
[8] Claudia P., Coronel-Aguilera M., and Fernanda San M., (2014). Encapsulation of Spray Dried Β-Carotene Emulsion by Fluidized Bed Coating Technology. Food Science and Technology, 1-7. www.elsevier.com/locate/lwt=99
[9] Regalado, C., Perez-Perez, C., Lara-Cortes, E. & Garcia-Almendarez, B. (2006). Whey Protein Based Edible Food Packaging Films and Coatings. Advances in Agricultural and Food Biotechnology, Pp. 237–261. Kerala, India: Research Signpost.
[10] Vásconez, M. B., Flores, S. K., Campos, C. A., Alvarado, J. and Gerschenson, L. N. 2009. Antimicrobial activity and physical properties of chitosan-tapioca starch based edible films and coatings. Food Research International 42: 762–769. [11] Cutter, C. N. 2006. Opportunities for Bio-based Packaging Technologies to Improve the Quality and Safety of Fresh and Further Processed Muscle Foods, Meat Science, 74: 131–142. [12] Elsabee, M. Z. and Abdou, E. S. 2013. Chitosan Based Edible
Films and Coatings: A Review Materials, Science and Engineering, 33: 1819–1841.
[13] Han, J. H. 2000. Antimicrobial food Packaging. Food Technology (54) 56–65.
[14] Malakar J, Nayak A. K., Pal D. and Jana P. (2013). Potato starch‑blended alginate beads for prolonged release of tolbutamide: Development by statistical optimization and in vitro characterization. Asian Journal of Pharmaceutics, www.asiapharmaceutics.info
[15] Ozdemir, M. and Floros, J. D. 2008. Optimization of edible whey protein films containing preservatives for water vapor permeability, water solubility and sensory characteristics. Journal of Food Engineering, 86 (2): 215-224.
[16] Chillo, S., Flores, S., Mastromatteo, M., Conte, A., Gerschenson, L. and Del Nobile, M. A. 2008. Influence of glycerol and chitosan on tapioca starch-based edible film properties. Journal of Food Engineering 88 (2): 159-168. [17] Arismendi, C., Chillo, S., Conte, A., Del Nobile, M. A., Flores,
S. and Gerschenson, L. N. 2013. Optimization of physical properties of xanthan gum/tapioca starch edible matrices containing potassium sorbate and evaluation of its antimicrobial effectiveness. LWT-Food Science and Technology 53 (1): 290-296.
[18] Maran, J. P., Sivakumar, V., Sridhar, R. and Immanuel, V. P. 2013a. Development of model for mechanical properties of tapioca starch based edible films. Industrial Crops and Products 42 (1): 159-168.
[19] Maran, J. P., Sivakumar, V., Thirugnanasambandham, K. and Sridhar, R. 2013b. Response surface modeling and analysis of barrier and optical properties of maize starch edible films. International Journal of Biological Macromolecules 60: 412-421.
[20] Azevedo, A. N., Buarque, P. R., Cruz, E. M. O., Blank, A. F., Alves, P. B., Nunes, M. L. and Santana, L. C. L. A. 2014. Response surface methodology for optimisation of edible
chitosan coating formulations incorporating essential oil against several foodborne pathogenic bacteria. Food Control 43: 1-9.
[21] Arham R., Salengke S., Metusalach M. and Mulyati, M. T. (2018). Optimization of agar and glycerol concentration in the manufacture of edible film. International Food Research Journal 25 (5): Pp 1845-1851. http://www.ifrj.upm.edu.my [22] Ihekoronye, A. I. and Ngoddy, P. O. (1985). Integrated Food
Science and Technology for the Tropics, Pp. 252–253. London: MacMillian Publishers.
[23] Chinma C. E, Ariahu C. C. and Abu, O. J. (2012). Development and Characterization of Cassava Starch and Soy Protein Concentrate Based Edible Films. International Journal of Food Science and Technology, 2012, 47, 383–389. [24] Phan-The, D., Debeaufort, F., Voilley, A. & Luu, D. (2009).
Biopolymer Interactions Affect the Functional Properties of Edible Films Based on Agar, Cassava Starch and Arabinoxylan Blends. Journal of Food Engineering, 90, 548– 558.
[25] Sharma, N., Khatkar, B. S., Kaushik, R., Sharma, P. and Sharma, R. (2017). Isolation and development of wheat based gluten edible film and its physicochemical properties. International Food Research Journal 24 (1): 94-101, http://www.ifrj.upm.edu.my
[26] Ahmad, M., Benjakul, S., Prodpran, T. and Agustini, T. W. 2012. Physico-mechanical and antimicrobial properties of gelatin film from the skin of unicorn leather jacket incorporated with essential oils. Food Hydrocolloids 28: 189-199.
[27] Arham R., Mulyati, M. T., Metusalach, M. and Salengke, S. (2016). Physical and mechanical properties of agar based edible film with glycerol plasticizer. International Food Research Journal 23 (4): 1669-1675. http://www.ifrj.upm.edu.my
[28] Borges, J. A., Romani, V. P., Cortez-Vega, W. R. and Martins, V. G. (2015). Influence of different starch sources and plasticizers on properties of biodegradable films. International Food Research Journal 22 (6): Pp 2346-2351.
[29] Galus, S. and Lenart, A. (2013). Development and characterization of composite edible films based on sodium alginate and pectin. Journal of Food Engineering 115: 459-465. [30] Bhuvaneshwari, S., Sruthi, D., Sivasubramanian, V., Kalyani,
N. and Sugunabai, J. 2011. Development and characterization of chitosan film. International Journal of Engineering Research and Applications 1 (2): Pp 292- 299.
[31] Akbari, Z., Ghomashchi, T. & Moghadam, S. (2007). Improvement in Food Packaging Industry with Biobased Nanocomposites. International Journal of Food Engineering, 3 (4): 3.
[32] Muhammed L. S., Salit M. S., Mohammad J, Mohamad R. I., and Japar S., (2015). Effect of Plasticizer Type and Concentration on Tensile, Thermal and Barrier Properties of Biodegradable Films Based on Sugar Palm (Arenga pinnata)
Starch. Polymers, 7, 1106-1124;
www.mdpi.com/journal/polymers.
[34] Bourtoom, T., Chinnan, M. S., Jantawat, P. & Sanguandekul, R. (2006). Effect of Selected Parameters on The Properties of Edible Film from Water-Soluble Fish Proteins in Surimi Wash-Water. Lebensmittel–Wissenschaft und-Technologie, 39, 406–419.
[35] Gounga, M. E., XU, S. Y. and Wang, Z. (2007). Whey protein isolate-based edible films as affected by protein concentration, glycerol ratio and pullulan addition in film formation. J. Food Eng. 83 (4), 521–530.
[36] Gounga, M. E., Xu, S. & Wang, Z. (2010). Film forming mechanism and mechanical and thermal properties of whey protein isolate-based edible films as affected by protein
concentration, glycerol ratio and pullulan content. Journal of Food Biochemistry, 33, 501–519.
[37] Jeannine B. L., N´ıvea M. V., Rodolfo M. C. Dos S, Ana M, Onica Q. B., and Sobrala J. A. (2015). Mechanical properties of cassava starch films as affected by different plasticizers and different relative humidity conditions. International Journal of Food Studies, (4), Pp 116–125.