Linking farmers, healthy foods, and underserved consumers:
Exploring the impact of nutrition incentive programs on
farmers and farmers’ markets
Lydia Oberholtzera,*, Penn State University
Carolyn Dimitrib
,
New York UniversityGus Schumacherc, Wholesome Wave
Submitted 30 October 2011 / Revised 9 January 2012 / Accepted 14 March 2012 / Published online27 July 2012
Citation: Oberholtzer, L., Dimitri, C., & Schumacher, G. (2012). Linking farmers, healthy foods, and underserved consumers: Exploring the impact of nutrition incentive programs on farmers and farmers’ markets Journal of Agriculture, Food Systems, and Community Development, 2(4), 63–77. http://dx.doi.org/10.5304/jafscd.2012.024.002
Copyright © 2012 by New Leaf Associates, Inc. Abstract
The number of farmers’ markets in the United States has increased rapidly over the last 20 years. They have begun to attract a great deal of attention for their potential to provide consumers in rural and urban “food deserts” with fresh fruits and vegetables. Incentive programs targeting federal nutrition benefit customers at farmers’ markets are
new and rapidly growing programs that seek to address the problems of access and affordability for these consumers, as well as enhance the viability of participating markets and farmers. This article relies on data from markets providing nutrition incentive programming in 2010 and a survey of participating farmers in order to study federal nutrition benefit and incentive usage at the markets and to provide preliminary results about the type of farmers and markets that might benefit most from incentive programming. The farmers’ market data show that Supplemental Nutrition Assistance Program (SNAP) redemption has increased substantially (usually doubling or more annually) in markets offering incentives. The analysis of farmer surveys revealed that both farmer and market characteristics are important to the impact of incentives on participating farmer sales. Farmers who were more likely to report increased sales from incentives were those with a higher proportion of market gross sales accounted for by fruits and vegetables; who depend on Disclosure: The first two authors act as paid evaluators for
Wholesome Wave’s Double Value Coupon Program. a, * Corresponding author: Lydia Oberholtzer, Penn State University; Agricultural Economics, Sociology, and Education; Armsby Building, University Park, PA 16802 USA; author mailing address: 214 Spring Avenue; Takoma Park, MD 20912 USA; +1-301-891-0470; [email protected]
individual farmers’ markets for a higher percentage of farm sales; who sell products at small or
medium-sized markets; or who are very satisfied with the implementation of incentive programming at their markets. As these are preliminary results of new programming, future research needs are addressed.
Keywords
economic benefit, farmers, farmers’ markets, federal nutrition benefits, healthy foods, nutrition incentive programs, SNAP
Introduction
The number of farmers’ markets in the United States has increased rapidly over the last 20 years. The U.S. Department of Agriculture (USDA) listed almost 7,200 markets in 2011, up from 1,755 in 1994 (USDA Agricultural Marketing Service [AMS], 2011). Often farmers’ markets are promoted as a way to increase farmer incomes and enhance local and regional food systems, kick-start economic development in communities, and protect local farmland (Oberholtzer & Grow, 2003). Recently they have also attracted a great deal of attention from policy-makers (Raz, 2009; The White House, 2009; The White House Task Force on Childhood Obesity, 2010), researchers (Holben, 2010; Story, Kaphingst, Robinson-O’Brien, & Glanz, 2008), as well as advocates (Briggs, Fischer, Lot, Miller, & Tessman, 2010) — all endorsing farmers’ markets’ potential to provide consumers in rural and urban “food deserts” with nutritious foods, especially fresh fruits and vegetables. However, challenges to attaining this goal exist in many communities.
Incentive programs at farmers’ markets (and more recently through CSA farms) targeting federal nutrition benefit customers have emerged in an effort to address these issues. These programs match purchases made using federal nutrition benefits, such as the SNAP (formerly called food stamps) and the Famers Market Nutrition Pro-grams (FMNP), at participating farmers’ markets. Some programs match on a dollar-for-dollar level, often with a maximum match per week; for example, a consumer spends USD20 in SNAP and receives a USD20 match in “double coupons” to spend at the market. Other programs may match a
portion of the amount spent by the consumer. Many programs limit redemption of incentives to fresh fruits and vegetables, while some programs allow purchases to mirror those eligible for the federal nutrition benefit being redeemed. Regard-less of the structure of the nutrition incentives, these programs have grown rapidly in number over the last few years, from only a few markets before 2008, to 150 markets in 2010 and over 350 markets in 2011.1 Coordinated by various organizations around the country and supported primarily by private funding, these programs have multiple goals, including enhancing access to affordable fresh, locally grown produce in areas often considered food deserts; increasing fruit and vegetable consumption by participating consumers; growing the number of federal nutrition benefit customers who shop at farmers’ markets; and increasing the viability of participating markets and farmers (Schumacher, Nischan, & Simon, 2011).
We know of no published research that has examined the impact of nutrition incentive programming on farmers. Often the focus of previous research has been on the participating consumer and the program’s impact on health indicators, and most of these studies are found outside of peer-reviewed journals. In terms of benefits to farmers, the premise is that as incentive programming increases, so too will the usage of federal nutrition benefits, thereby increasing sales for farmers and the viability of each market. However, the reality is significantly more complex; many factors affect the outcomes for farmers and markets. These factors may include, among others, the types and quantity of outreach to federal nutrition benefit consumers undertaken by the markets, the composition of the community surrounding the market (including the number of residents eligible for federal nutrition benefits and the ethnic makeup of the community), how
accessible the market is for participating customers, the level of funding for incentive programming,
and how welcoming the market atmosphere and individual farmers are to these consumers.
This article relies on data from almost 100 markets running nutrition incentive programming in 2010 to provide baseline data on federal nutri-tion benefit and incentive usage at markets, and preliminary indications of the type of farmers and markets that might most benefit from incentive programming. The data come from research undertaken in 2010 by a national organization facilitating incentive programming in the Northeast, Mid-Atlantic, Southeast, Midwest, and Mountain regions of the United States. We first review the literature on the current state of federal nutrition benefits usage and incentive programming at farmers’ markets and on the economic and community impacts of farmers’ markets. Next, we quickly examine summary data gathered at the market level to study federal nutrition benefit and incentive usage at the study’s participating markets. Finally, we use data from a survey of farmers at participating markets to study how farmer and market characteristics impact the likelihood that a farmer reports increased sales from incentive programming. This analysis provides a basis for discussion about future research needs.
Background and Literature Review
One key component of providing access to fresh fruits and vegetables at farmers’ markets for
low-income consumers is the use of federal nutrition benefits at markets, including SNAP, Women, Infants, and Child (WIC) FMNP and Cash Value Vouchers (WIC CVV), and Senior FMNP (table 1). SNAP benefits can be redeemed for a broader list of products than FMNP, including bread, cereal, fresh produce, meat, fish, poultry, dairy, and starter plants. However, SNAP benefits cannot be used to purchase hot meals, prepared foods, soap, or other body care items. Generally only fresh fruits and vegetables can be purchased using FMNP.
While SNAP can potentially bring significant benefits to farmers’ markets and their vendors, it has a mixed history in regard to its success in the market setting, much of it stemming from the adoption of electronic benefits transfer (EBT) systems in the 1990s. In 2010, approximately 12 percent of all markets redeemed SNAP benefits nationwide (Love, 2011a; USDA, 2010), a 50 percent increase over 2008. This translated into USD7.5 million in purchases made by SNAP recipients at farmers’ markets, up from USD1 million in 2007 (Love, 2011a; USDA, 2010; USDA FNS, 2010a). However, markets are still playing catch-up; before SNAP EBT systems were implemented in the late 1990s, SNAP redemption at markets was over USD9 million (1993).
Redemptions decreased substantially as EBT systems came online (Briggs et al., 2010) and markets had difficulty switching, in part because it
Table 1. Types of Federal Nutrition Benefits and Usage at Farmers’ Markets
Type of benefit Redemption at farmers’ markets, 2010 farmers accepting benefit, 2010 Estimated number of markets / Benefit limit per participant
Supplemental Nutrition
Assistance Program (SNAP) USD7.5 million
1,040 markets /
unknown number of farmers
Limited only by monthly benefit maximums and restrictions on purchases; average monthly benefit per person USD133 (2010)
WIC Farmers Market Nutrition
Program (WIC FMNP) USD15.7 million 3,650 markets /18,000 farmers USD10–30 annually
WIC Cash Value Voucher
(WIC CVV) Unknown
26 WIC state agencies have authorized farmers to accept CVVs at farmers’ markets / unknown number of markets and farmers
USD6 per child and USD8–10 for mother monthly
Senior Farmers Market Nutrition
requires electricity and, in the past, land line phones, amenities not often associated with outdoor markets. With recent improvements in wireless systems, EBT has become more feasible for markets. Barriers still remain for farmers’ markets wishing to redeem SNAP, including funding, managing scrip, receipts, or vouchers for SNAP, and staffing (Briggs et al., 2010; Jones & Bhatia, 2011; USDA, FNS, 2010b). As some markets start to experiment with new technologies, such as smartphones and related apps (Love, 2011b), barriers to using EBT at markets may continue to decrease, although it is still too soon to gauge the impact.
FMNP, unlike SNAP, is focused exclusively on farmers’ markets and remains primarily a paper-based system, at least for now. In 1986, the Massa-chusetts Department of Agriculture organized a pilot WIC program to provide vouchers that could only be spent at farmers’ markets for summer and fall fruits and vegetables (see Schumacher et al., 2011, for additional history of this and the Senior FMNP program). Other states followed suit and the federal WIC FMNP program was established in 1992. In 2010, WIC FMNP operated in 45 States, U.S. territories, and federally recognized Indian Tribal Organizations, with redemptions totaling more than USD15.7 million. Although used in more markets than SNAP, the potential impact is limited because the benefit is restricted to USD10– 30 annually for participants.
In 2009, the WIC CVV program was imple-mented nationwide to supplement WIC; vouchers are available for WIC-eligible participants monthly USD (USD6 for children and USD8–10 per mother). In 2010, USD525 million in WIC CVV were redeemed at supermarkets; it is unknown how much was redeemed at farmers’ markets. While farmers at markets are eligible to redeem WIC CVV, the number of markets able to accept WIC CVV is increasing slowly. Simplification of proce-dures for WIC CVV by USDA FNS and admin-istering state agencies could result in significant revenue for market farmers (Briggs et al., 2010).
In 1989 Massachusetts again created a program to benefit both markets and low-income con-sumers, modeling the Senior FMNP for low-income seniors after the WIC program. It was
started at the federal level in 2001. The Senior FMNP program awarded USD22.5 million in 2010 to 51 states, U.S. territories, and federally recog-nized Indian tribal governments to provide low-income seniors with USD20–50 in coupons annually to purchase eligible products at farmers’ markets, among other direct markets.
The recent and rapid growth in nutrition incentive programming was described earlier. Although most incentive programs are funded through private funds, two publicly funded pro-grams are worth noting. New York City’s Health Department launched the Health Bucks program in the South Bronx in 2005 (New York City
Department of Health and Hygiene, 2010). The city distributes USD2 coupons for every USD5 in SNAP spent to be spent by participants on fresh fruits and vegetables, through community-based organizations and individual farmers’ markets. In 2009, the city distributed more than 110,000 Health Bucks coupons; over 60 city farmers’ markets participated in 2011. The Healthy Incen-tives Pilot (HIP) is a study piloted in Hampden County, Massachusetts, authorized in the 2008 Farm Bill to determine if incentives provided to recipients at the point of sale (including all retail outlets, not just farmers’ markets) increase the purchase of fruits, vegetables, or other healthful foods among SNAP participants (USDA, FNS, 2011). HIP provides an incentive of 30 percent of purchase price to participants using benefits to purchase target fruits and vegetables.
on nutrition-related outcomes (McCromack, Laska, Larson, & Story, 2010).
As noted earlier, the impact of federal nutrition benefit usage at markets on their vendors is a little-studied area. A national survey of farmers’ market managers in 2006 (USDA AMS, 2009) revealed that 61 percent of markets redeemed WIC FMNP vouchers, with an average monthly redemption of USD1,744; 45 percent redeemed Senior FMNP, with an average monthly redemption of USD1,004. SNAP redemption was not covered in this study; as noted earlier, current statistics show that 12 percent of farmers’ markets accept SNAP. Another study reveals a positive relationship between acceptance of WIC at markets in Indiana and the number of customers per week for markets (Hoffman, Dennis, & Marshall, 2009). One of the four recommendations made by Schmit and Gomez (2011) to improve farmers’ market viability is to reduce the cost burden to underserved resi-dents and increase the number of federal nutrition benefit customers at markets.
More research has examined the impact of farmers’ markets on farmers and their communities. It has been well established that farmers that market directly to consumers, through venues such as farmers’ markets, can potentially capture a larger portion of the food dollar than those selling through wholesale outlets. One study (Brown, Miller, Boone, Boone Jr., Gartin & McConnell, 2007) noted that many characteristics — including types of products produced, number of weeks attending market, and marketing activities on the part of the farmer — influences market sales for farmers. Schmit and Gomez (2011) note that market leaders need to pay particular attention to location, product and vendor mix, prioritizing marketing and outreach, and reducing cost burdens to underserved, low-income residents in order to boost the viability of markets and the performance of vendors. This analysis revealed that vendors prefer selling at a limited number of markets as well as a positive association between their satis-faction and the number of years selling at markets. A higher number of vendors at a market, as well as higher proportions of vendors selling organic products, was associated with higher levels of vendor satisfaction. Vendors at older markets, on
the other hand, were less satisfied. Furthermore, Varner and Otto (2008) find that sales for vendors at Iowa markets are positively affected by an urban location and higher per capita income of consu-mers. Surprisingly, the time that market was held (Saturday markets versus all other days) was not significant for vendor sales. Stephenson and colleagues (2007) address the other side of market success, examining what factors are associated with failure, including small size (based on vendor numbers), need for more product mix, lack of administrative revenue, status of market manager (volunteer or low salary), and high manager turnover.
Beyond actual sales, farmers’ markets can also be a good way for farmers to develop entrepre-neurial and business skills, expand their business, and build a customer base (Oberholtzer & Grow, 2003). Vendors see the markets as a way to over-come a number of barriers; the benefits they report include low costs in starting and operating a busi-ness at a farmers’ market, reduced overhead costs, market manager expertise in marketing, informa-tion sharing, and social support from fellow vendors. In addition, researchers note that farmers’ markets can offer important community benefits. They can help local businesses by bringing customers to an area and drawing tourists. Several studies have also tried to quantify the economic impact of farmers’ markets (Hughes, Brown, Miller, & McConnell, 2008; Market Umbrella, 2010; Otto, 2010; Project for Public Spaces [PPS], 2007), all of which show positive economic impacts on com-munities, although differing study methodologies mean that the outcomes vary greatly.
Farmers’ Market Data and Results
Applied Research Methods
farm retail stands, and CSAs from 16 states pro-vided weekly records on federal nutrition benefit usage (including dollar amount and transaction numbers), incentive dollars distributed and redeemed by corresponding program (SNAP and/or FMNP), and total incentive dollars redeemed by all market farmers. Data were also collected on the number of farmers redeeming federal benefits and other vendors unable to redeem federal benefits for each market. The data were organized in Microsoft Excel and imported into SPSS for analysis.
Market Level Impact
Overall, the data collected showed that the over 100 participating markets in 2010 redeemed USD1 million in federal nutrition benefits (USD600,000) and nutrition incentives (USD400,000) over the season, representing over 57,000 federal nutrition benefit transactions from an estimated 20,000 individual consumers. Over half (60 percent) of the participating markets had started their incentive program in 2010; another 33 percent had started their programs in
2009 (and thus had been running the programs for 2 years); and only 9 percent had run programs since 2008. As noted earlier, incentive programs at farmers’ markets were virtually nonexistent before 2008. Only 11 per-cent of the markets had been redeeming SNAP prior to imple-menting incentives, while most started accepting SNAP and incentives at the same time.
Since federal nutrition benefits can be used to purchase only eligible products, not all vendors at a
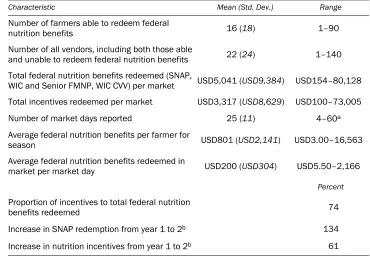
market can redeem the benefits. As noted earlier, SNAP can be used to purchase a broader range of products than FMNP, but nevertheless many vendors, such as those selling coffee or prepared foods, cannot redeem the benefits. Approximately 1,700 farmers who were able to redeem federal benefits, and another 700 vendors who were not, sold products at the study markets. This translates into a per market average of 16 farmers redeeming federal benefits and 22 total vendors (including farmers able to redeem benefits and other vendors who cannot) (table 2). This average is consistent with the median number of vendors reported nationwide in 2006 (USDA AMS, 2009), although a bit higher than those reported in other farmers’ market studies (Otto, 2010; Schmit & Gomez, 2011).
The range of both federal nutrition benefits and incentives redeemed was wide, with one market redeeming a little over USD80,000 in federal nutrition benefits, and over 30 percent of markets reporting under USD1,000. Of course, the total federal benefits and incentives redeemed is, in
Table 2. Characteristics of Farmers’ Markets with Incentive Programming (N=95)
Characteristic Mean (Std. Dev.) Range
Number of farmers able to redeem federal
nutrition benefits 16 (18) 1–90
Number of all vendors, including both those able
and unable to redeem federal nutrition benefits 22 (24) 1–140
Total federal nutrition benefits redeemed (SNAP,
WIC and Senior FMNP, WIC CVV) per market USD5,041 (USD9,384) USD154–80,128 Total incentives redeemed per market USD3,317 (USD8,629) USD100–73,005
Number of market days reported 25 (11) 4–60a
Average federal nutrition benefits per farmer for
season USD801 (USD2,141) USD3.00–16,563
Average federal nutrition benefits redeemed in
market per market day USD200 (USD304) USD5.50–2,166
Percent
Proportion of incentives to total federal nutrition
benefits redeemed 74
Increase in SNAP redemption from year 1 to 2b 134
Increase in nutrition incentives from year 1 to 2b 61
aSome markets reported for more than one market day per week.
some part, affected by the number of market days a market might be open; some markets may run year round, while others are only open in the summer or winter seasons. It is also affected by the total amount raised to fund the incentives. While most markets did not run out of incentive funding during the season, some did. Also of note is that often a market will not have data on FMNP redeemed at the market, as usually the farmer is the one that collects and submits those vouchers to his or her state for reimbursement. Thus, these data probably underestimate the total amount of federal nutrition benefits redeemed.
The total value of SNAP redemptions from one year to the next (for those markets running incentives more than one year) increased an average of 134 percent, while nutrition incentives usage increased and average of 61 percent. Other farmers’ market incentive programs have seen similar increases in SNAP redemptions following nutrition incentive implementation (Bodonyi & Gilroy, 2011; New York City Department of Health and Hygiene, 2010). However, there was a large range of change in SNAP redemptions for individual markets, from an 88 percent decrease to almost 1,000 percent increase. The data also show that participating markets have been somewhat effective at attracting additional federal nutrition benefits above the amount of incentives provided, with one dollar of federal nutrition benefits redeemed for every 74 cents in incentives provided to consumers.
Data and Impact on Participating Farmers
Applied Research Methods
A survey of farmers at markets participating in the organization’s incentive programming was imple-mented in late fall of 2010 to study a number of aspects of vendor participation in incentive pro-gramming and determine the economic and other impacts of incentives on farmers. The survey included 18 questions that examined the impact of incentives on farmer sales, the number of federal benefit nutrition customers, overall market foot traffic, any changes in production or marketing practices undertaken as a result of incentive imple-mentation at the market, and the importance of
incentives and federal nutrition benefits in farmer retention. The survey also included questions to gauge the farmers’ satisfaction with the incentive program at their market and to gather demographic information about the farmer, farm sales, and types of marketing outlets used.
A list of vendors at markets participating in the organization’s incentive programming was
generated by contacting market managers and obtaining contact information from participating market websites. Approximately 860 vendors were identified from 85 participating markets. The survey was administered in different formats based on the best way to contact the farmer, and was available online through SurveyMonkey.com and through the mail with paper surveys; the two surveys were identical. In a few cases, usually when the market would not allow the researchers to contact the farmers directly, market managers distributed the survey to vendors with a return envelope attached. Two follow-up email contacts were made for the web version and one follow-up contact (in the form of a postcard) was made for the mail survey. Survey incentives were included in the form of a lottery for a chance to receive one of five USD50 gift certificates.
In total, 190 market vendors responded to the survey, representing a 22 percent return rate. The web version had a higher response rate when used in conjunction with email addresses. Low response rates are not unusual for farmer surveys (Pennings, Irwin, & Good, 2002). Although we do not know the characteristics of the nonresponse population because all market vendors were included in the survey (both those redeeming federal nutrition benefits and those who could not redeem the benefits), we believe that a higher proportion of vendors that do not accept federal benefits or incentives did not respond.
unable to redeem federal nutrition benefits. These vendors were excluded from this analysis because they answered a subset of the survey questions focused only on the impact of incentives on foot traffic and farm demographics.
Respondents generally represented the regions in which the organization’s incentive programming was active in 2010. Organizations in the Northeast region (Connecticut, Massachusetts, Maine, New York, Rhode Island, and Vermont) ran the vast majority of incentive programming in 2010, and 53 percent of respondents came from the Northeast. The Mid-Atlantic region of Washington, D.C., Maryland, and Virginia accounted for another 23 percent of respondents, while the Southeastern region (Florida, Georgia, and Tennessee)
accounted for 15 percent. The final 8 percent came from the states of Idaho and Illinois. No incentive programming by the organization was underway on the West Coast in 2010 so there is no
representation from states in these regions.
Farmer and Market Characteristics Affecting the
Impact of Incentives on Farmer Income
The impact of incentive programming on farmers can be examined by studying whether farmers reported increased sales due to incentive program-ming at their markets. To do this, we used a logistic regression to study the farmer and market charac-teristics influencing this result. Included in the analysis are both market and farmer characteristics, as we know from the literature (e.g., Schmidt & Gomez, 2011) that market factors — not just farmer characteristics — can affect a farmer’s success or failure at a market.
The descriptive data provides an overall pic-ture of farmers who redeem federal benefits and incentives at participating markets. Generally speaking, those farmers responding to our survey were young farmers operating small commercial farms (table 3). Half the respondents were under 45, a much higher percentage than the national average (22 percent) according to the 2007 Census of Agriculture (USDA NASS, 2009). Respondents seem to be operating small commercial farms, with higher gross incomes within the small farm cate-gory (under USD250,000 gross sales per year) occurring at a higher rate for respondents than for
farmers nationally in 2007. In the lowest category of farm sales, only 46 percent of respondents reported sales under USD15,000, whereas 58 percent of farmers report sales under USD10,000 nationally. Furthermore, 26 percent of all farms nationally have between USD10,000 to USD99,999 in gross sales, whereas 34 percent of respondents
Table 3. Demographic Characteristics of
Respondents and Farm Operations (N=150)
Percent
Age of respondent
Under 35 years old 24
35–44 years old 26
45–54 years old 25
55 years and older 26
2009 gross sales of farm products
Less than USD14,999 46
USD15,000–99,999 31
USD100,0000–249,999 10
USD250,000–999,999 8
USD1 million or more 2
Market operations Mean (Std. Dev.)
Percentage of gross sales from
farmers’ markets, 2010 59 (20.6)
Number of farmers’ markets attended
by farmer (sells product at) 3.2 (4.6) Number of markets farmer attended
that accept federal nutrition benefits 2.2 (2.8) Number of markets farmer attended
where incentives are provided 1.4 (0.7) Number of seasons farmer accepted
incentive coupons 1.7 (0.8)
Farmer accepts SNAP, percent 80 (40) Farmer accepts WIC FMNP, percent 40 (49) Farm accepts Senior FMNP, percent 32 (47) Farmer accepts WIC CVV, percent 37 (48) Dollar value of incentives accepted by
farmer at market1 (median USD200)
USD696 (USD1,415) Percent of total farmer sales made up
by incentives at marketa 12.3 (20.4) Percent of farmer customers that use
incentives at marketa 11.7 (21.5)
aFarmers accepting incentives at more than one market were
have between USD15,000 and USD99,999. Gross farms sales in the highest categories — those that would be defined as medium or large farms by USDA (USD250,000 or more) — occur at the same rate as the national average (10 percent).
Most of the respondents’ farming operations were focused on direct marketing, with an average of 59 percent of their operations’ gross sales coming from farmers’ markets. Respondents attended an average of three farmers’ markets in 2010, of which an average of two accepted federal nutrition benefits. Of those markets attended by the farmer, an average of more than one market provided nutrition incentives. With incentive programming starting in most markets in 2008 or beyond, it is not surprising that respondents reported accepting incentives for a mean of only 1.7 years. The vast majority of respondents (80 percent) accepted SNAP benefits, with close to a
third accepting WIC FMNP (40 percent) or Senior FMNP (32 percent). Survey respondents reported that they redeemed an average of almost USD700 in incentives during the 2010 season per market, and that an average of 12 percent of their sales and customers came from incentives.
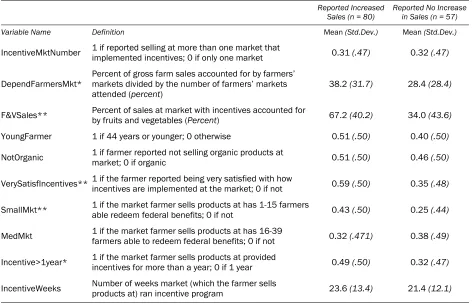
Summary statistics for the variables used in this model are listed in table 4. The variables thought to influence sales from incentives include character-istics of the farm operation (gross sales, marketing avenues, type of products sold), market character-istics (size of market, number of vendors, number of weeks running incentives), and experience with incentive programming. A priori, it was expected that farmers with a higher proportion of gross sales at the market accounted for by fruits and vege-tables, and farmers who depended on farmers’ markets for a large proportion of sales, might be more likely to report increased sales due to
incen-Table 4. Summary Statistics of Variables Used in the Logistic Regression
Reported Increased
Sales (n = 80) Reported No Increase in Sales (n = 57) Variable Name Definition Mean(Std.Dev.) Mean(Std.Dev.)
IncentiveMktNumber 1 if reported selling at more than one market that implemented incentives; 0 if only one market 0.31 (.47) 0.32 (.47)
DependFarmersMkt* Percent of gross farm sales accounted for by farmers’ markets divided by the number of farmers’ markets attended (percent)
38.2 (31.7) 28.4 (28.4)
F&VSales** Percent of sales at market with incentives accounted for by fruits and vegetables (Percent) 67.2 (40.2) 34.0 (43.6)
YoungFarmer 1 if 44 years or younger; 0 otherwise 0.51 (.50) 0.40 (.50)
NotOrganic 1 if farmer reported not selling organic products at market; 0 if organic 0.51 (.50) 0.46 (.50)
VerySatisfIncentives** 1 if the farmer reported being very satisfied with how incentives are implemented at the market; 0 if not 0.59 (.50) 0.35 (.48)
SmallMkt** 1 if the market farmer sells products at has 1-15 farmers able redeem federal benefits; 0 if not 0.43 (.50) 0.25 (.44)
MedMkt 1 if the market farmer sells products at has 16-39 farmers able to redeem federal benefits; 0 if not 0.32 (.471) 0.38 (.49)
Incentive>1year* 1 if the market farmer sells products at provided incentives for more than a year; 0 if 1 year 0.49 (.50) 0.32 (.47)
IncentiveWeeks Number of weeks market (which the farmer sells products at) ran incentive program 23.6 (13.4) 21.4 (12.1)
*indicates differences in means that are statistically significant; t-values with significance at α = 0.10 level.
tive programming. In addition, those farmers who sold at more than one market with incentive programming might also be more likely to report increased sales with the assumption that federal nutrition benefit sales may account for a larger proportion of their overall sales. An age variable was also included on the assumption that younger farmers may be more open to marketing to a new clientele base (namely federal nutrition benefit customers), primarily because they have not been farming as long and their operations may be more adaptable to any new products demanded by a such a new base, which may result in increased sales from incentives. Finally, a variable “not organic” was included to study whether incentive consumers may favor farmers not using organic methods based on the supposition that that organic farmers would receive higher prices and incentive con-sumers (given their income level) may shy away from these higher prices.
In regard to market characteristics, we
assumed that the location of the market as defined by a U.S. region would be unlikely to affect farmer sales, although the size of the market might influence the likelihood that a farmer would report increased sales. Also included were the number of weeks incentives were redeemed at the market, with the assumption that those farmers in markets where incentives ran longer would be more likely to report increased sales. We also assumed that a market running incentive programming longer (for more than one year) might positively affect farmer sales through the experience level of market managers and farmers.
We model the impact of the incentives on farmer sales as a discrete choice where the depen-dent variable, yi, takes on the value of 0 if the farmer has reported that the implementation of incentives at the market did not affect sales (they stayed the same after implementation) or the value of 1 if the farmer reported that sales either
increased or greatly increased. Based on the logistic distribution, the probability of increased sales is:
1. Pr{y = 1} =
=
+
Jk x x
i j i j
e
e
1
' '
1
ββ
for j = 1, while
the probability of no impact on sales is: 2. Pr{y = 0} =
=
+
Jk xi j
e
1
'
1
1
β
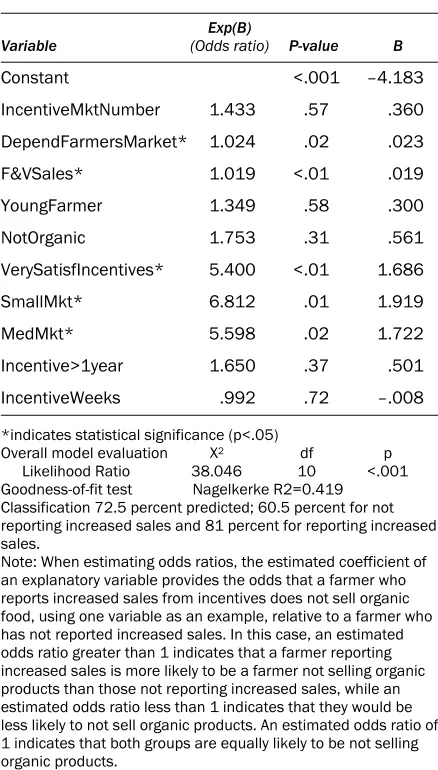
Either probabilities (p) or the odds ratio, p/(1-p), can be estimated in the logistic model. We chose to estimate the odds ratio rather than proba-bilities for ease of exposition (see table 5 for expla-nation of interpretation). The results of the logit
Table 5. Logistic Regression Analysis of Farmers
with Increased Sales Due to Incentives (N = 102)
Variable (Odds ratio) Exp(B) P-value B
Constant <.001 –4.183
IncentiveMktNumber 1.433 .57 .360
DependFarmersMarket* 1.024 .02 .023
F&VSales* 1.019 <.01 .019
YoungFarmer 1.349 .58 .300
NotOrganic 1.753 .31 .561
VerySatisfIncentives* 5.400 <.01 1.686
SmallMkt* 6.812 .01 1.919
MedMkt* 5.598 .02 1.722
Incentive>1year 1.650 .37 .501
IncentiveWeeks .992 .72 –.008
*indicates statistical significance (p<.05)
Overall model evaluation X2 df p
Likelihood Ratio 38.046 10 <.001
Goodness-of-fit test Nagelkerke R2=0.419
Classification 72.5 percent predicted; 60.5 percent for not reporting increased sales and 81 percent for reporting increased sales.
model are shown in table 5, and confirm some hypotheses. Farmers who were more likely to report increased sales from incentives were those (1) with a higher proportion of gross sales at the market accounted for by fruit and vegetables; (2) who depend on individual farmers’ markets for a higher percentage of farm sales; (3) who attend small or medium-sized markets; or (4) who are very satisfied with the implementation of incentive programming at their markets. When examining more closely the odds ratios, those farmers from small markets (15 or fewer farmers able to redeem federal nutrition benefits) were almost seven times more likely to report increased sales, holding all other variables constant, while those from medium-sized markets (16–39 farmers) were over five times more likely. In addition, those farmers who were very satisfied with the implementation of the incentive programming at their market were five times more likely to report increased sales due to incentive programming.
As the percentage of a farmer’s total gross sales at the study market accounted for by fruit and vegetables increases, so too does the likelihood that a farmer will report increased sales. In this case, each unit of change (increase in the percentage) increases the likelihood that a farmer will report increased sales by 1.9 percent. Thus, a farmer with 40 percent of his or her gross sales accounted for by fruits and vegetables is almost three times more likely to report increased sales; someone with 70 percent accounted for by fruits and vegetables is almost five times more likely. This result is not surprising given that most federal nutrition benefits and nutrition incentives are used to purchase fruits and vegetables at the market.
One other continuous variable — dependence on any individual markets for farm sales — is also significant. Again, the change is small (approxi-mately two percent), but with each percentage change in the dependence on individual markets for farmers’ market sales for a farmer, the likeli-hood that a farmer will report increased sales due to incentives increases by two percent. Thus a farmer who spreads farmers’ market sales among many markets — and may only depend on any one market for 10 percent of his or her total farm sales — will be less likely to report increased sales due to
incentives than a farmer who depends on only one or two markets for all of his or her farm sales. The a priori notion that markets running incentive programming for more than one year and those farmers participating in more than one market providing incentives would be more likely to report increased sales did not bear out in the analysis. Surprisingly, farmers not using organic methods, and thus more likely to be asking lower prices at the market than organic farmers, were not more likely to report increased sales. Also, the number of weeks incentives are redeemed at the market has no significant impact on increased farmer sales due to incentives. The age of the farmer was also not a predictor of whether a farmer reported increased sales due to incentives. In addition, geographic variables — whether the market was located in the Northeast, Southeast, or Mid-Atlantic areas — were not found to be significant during model development and were not included in the final model due to the small sample size. Also not significant were the gross farm sales or the types or number of benefits redeemed on the part of the farmer. The former was surprising given that one could assume that farmers with lower gross farm sales might see a relatively larger impact from the incentives.
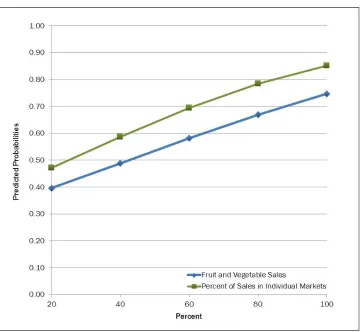
Figure 1 (next page) provides a different way (predicted probabilities) to examine the results from the continuous variables — the percentage of total gross sales at the market accounted for by fruit and vegetables and dependence on any individual markets for farm sales. As described above, as the share of a farmer’s sales at market accounted for by fruits and vegetables increases, so too does the likelihood that a farmer will report increased sales from incentives. A greater effect is seen by a farmer’s dependence on any individual market for farm sales, so that the likelihood of reporting increased sales from incentives increases with the percentage of sales that comes from individual markets.
Discussion and Future Research Needs
farmers, and communities. These programs seek to increase the amount of federal nutrition benefits “dollars” used at participating markets, thereby enhancing the market’s viability. They also seek to increase access to affordable fresh, locally grown produce (often in areas considered food deserts) and fruit and vegetable consumption by partici-pating consumers. Little research has been pub-lished on the impact of these programs, probably because they are so new. Research on federal nutrition benefits at farmers market is also limited. As SNAP usage at markets continues to expand rapidly, this may change. This paper examines these emerging trends and provides preliminary results of the impact of some of the earliest nutrition incentive programming on farmers and their markets.
The market-level data provided by individual markets show that
federal nutrition benefits and SNAP sales have increased (usually doubling or more) annually in markets. Of course, the impact of the incentives directly on SNAP
redemption is unknown. Com-paring SNAP redemptions from markets with incen-tive programs to those not imple-menting incentives might elucidate this. The analysis of participating farmer surveys revealed that both farmer and market charac-teristics are impor-tant to whether a farmer reported increased sales due to nutrition incen-tive programming.
We know from the analysis that those farmers with more gross sales accounted for by fruits and vege-tables and those that depend on individual farmers’ markets for a larger proportion of their sales are more likely to report increased sales due to incentives. The first result is not surprising given the products eligible for purchase using SNAP and FMNP, and it does support one policy goal of the organizations running many of these programs — that is, to enhance the viability of specialty-crop growers. Unexpectedly, farmers not using organic methods were not more likely to report increased sales, and this may be an interesting topic for future research: Do low-income consumers at farmers’ markets seek out organic foods at the same level as higher-income consumers? Many other demographic variables studied, such as size of the farm and age of the farmer, as well as how
Figure 1. Predicted Probabilities: Fruit and Vegetable Sales and Dependence on Markets
many markets the farmer attends where incentives are provided, did not affect the likelihood that a farmer reported increased sales from incentive programming.
Because of this, we believe that market characteristics may be as important or more so than farmer demographics in determining a farmer’s likelihood of increased sales from incen-tives. While it may be attractive for organizations funding nutrition incentive programs to target larger markets, thereby getting the “biggest bang for the buck,” we see that farmers from small and medium-sized markets are more likely to report increased sales. As funding from the organization did not take size of the market into account, the impact of a few thousand dollars in incentives provided to larger markets is likely getting washed out among the larger number of farmers at these markets. Farmer interaction with participating consumers may also be important. In smaller markets, farmers may have more contact with a larger number of federal nutrition benefit
customers, whether or not they purchase products, thereby affecting their perception of the program’s impact. A bit surprising was the fact that the number of weeks incentives were run at the market, or how many years the market had provided incentives, did not affect a farmer’s likelihood of reporting increased sales. However other market characteristics not included in this study, such as the number of federal nutrition benefit customers within a two-mile area, its location, or outreach activities, are likely to have an impact and should be included in future research on the topic.
As federal nutrition benefit redemption at markets grows and more markets become interested in and implement incentive programs, additional research that looks at market character-istics and the effectiveness of markets to imple-ment these programs is important. Currently we cannot fully answer why incentives are more effec-tive at increasing sales for some farmers and not for others. Logically, if federal nutrition benefit redemption increases at a market, one would assume an increase in overall sales at the market for all participating farmers. But many questions remain, such as whether there are some markets where incentive programs result in federal nutrition
benefit dollars and customers replacing non-benefit dollars and customers? What other market char-acteristics (such as product mix, season length, consumer demand from federal nutrition benefit participants, on-site SNAP sign up or WIC offices) affect a successful outcome of incentive funding? Does an increase in federal nutrition benefit dollars at a market have any negative effects on a market and its farmers or on a subset of its vendors? What are the costs associated with running these pro-grams, and are they an efficient use of federal and private funding? What are the most effective ways to attract federal nutrition benefit customers to these markets and promote the incentive programs? Long-term viability of the incentive programs and whether participating consumer shopping behavior is affected are also issues often raised by those running the programs, as well as by policy-makers and funders. How do these programs change the way a participating consumer shops, and how can markets retain participating con-sumers once their benefits and incentives have run out? Additional research is also needed to study the impact of incentives on the consumer and on the surrounding businesses near the markets; some research on these topics is currently underway.
Acknowledgements
We wish to thank staff from Wholesome Wave, including Michel Nischan, Cristina Sandolo, Skye Cornell, Maggie Reynolds, and Ned Porter, and former Wholesome Wave staff Juliette Storch and Ellee Igoe, who made this research possible and shared their experiences with the markets and partners. We also wish to thank the many markets and partners who assisted in the data collection and provided feedback on the survey instruments and data collection tools.
References
Bodonyi, B., & Gilroy, A. (2011). Healthy eating at farmers markets: The impact of nutrition incentives. Portland, Oregon: Oregon Public Health Institute.
Briggs, S., Fischer, A., Lott, M., Miller, S., & Tessman, N. (2010). Real food, real choice: Connecting SNAP recipients with farmers markets. Venice, California: Community Food Security Coalition and the Farmers Market Coalition.
Brown, C., Miller, S., Boone, D., Boone Jr., H., Gartin, S., & McConnell, T. (2007). The importance of farmers’ markets for West Virginia direct marketers.
Renewable Agriculture and Food Systems,22(1), 20–29. http://dx.doi.org/10.1017/S1742170507001561 Herman, D., Harrison, G., Afifi, A., & Jenks, E. (2008).
Effect of a targeted subsidy on intake of fruits and vegetables among low-income women in the Special Supplemental Nutrition Program for Women, Infants, and Children. American Journal of Public Health, 98(1), 98–105.
http://dx.doi.org/10.2105/AJPH.2005.079418
Hoffman, C., Dennis, J., & Marshall, M. (2009). Factors influencing the growth of farmers’ markets in Indiana. HortScience, 44, 712–716.
Holben, D. (2010). Farmers’ markets: Fertile ground for optimizing health. Journal of the American Dietetic Association, 110(3), 364-365.
http://dx.doi.org/10.1016/j.jada.2009.11.015 Hughes, D., Brown, C., Miller, S., & McConnell, T.
(2008). Evaluating the economic impact of farmers’ markets using an opportunity cost framework.
Journal of Agricultural and Applied Economics, 40(1), 253–265.
Jones, P. J., & Bhatia, R. (2011). Supporting equitable food systems through food assistance at farmers’
markets. American Journal of Public Health, 101(5), 781–783.
http://dx.doi.org/10.2105/AJPH.2010.300021 Love, D. (2011a). Farmers markets SNAP sales soar in 2010.
Charlottesville, Virginia: Farmers Market Coalition. Retrieved from http://farmersmarketcoalition. org/snap-sales-soar-2010
Love, D. (2011b). Square Up: New technology turns smartphones into POS devices. Charlottesville, Virginia: Farmers Market Coalition. Retrieved from http://farmersmarketcoalition.org/square-up Market Umbrella. (2010). Sticky Economy Evaluation Device:
Measuring the financial impact of a public market.
Retrieved from http://www.crescentcityfarmers market.org/uploads/file/Crescent_City_Farmers_
Market_2010_Combined-20101020.pdf
McCormack, L. A., Laska, M. N., Larson, N. I., & Story, M. (2010). Review of the nutritional implications of farmers’ markets and community gardens: A call for evaluation and research efforts. Journal of the American Dietetic Association, 110(3), 399–408. http://dx.doi.org/10.1016/j.jada.2009.11.023 New York City Department of Health and Hygiene.
(2010). Farmers’ markets initiatives: Promoting fresh fruits and vegetables in underserved communities 2010 report. Retrieved from http://www.nyc.gov/html/doh/ downloads/pdf/cdp/cdp-farmers-market-report.pdf
Oberholtzer, L., & Grow, S. (2003). Overview and characteristics of producer-only markets in the Mid-Atlantic region: A survey of market managers. Arlington, Virginia: Henry A. Wallace Center for Agricultural & Environmental Policy at Winrock International. Otto, D. (2010). Consumers, vendors, and the economic
importance of Iowa farmers markets: An Economic impact survey analysis. De Moines, Iowa: Iowa Department of Agriculture and Land Stewardship. Retrieved from http://www.iowaagriculture.gov/ Horticulture_and_FarmersMarkets/pdfs/
FarmersMarketEIS2009.pdf
Pennings, J. M. E., Irwin, S. H., & Good, D. L. (2002). Surveying farmers: A case study. Review of
Agricultural Economics, 24(1), 266–277. http://dx.doi.org/10.1111/1467-9353.00096 Project for Public Spaces [PPS]. (2007). Estimating the
Racine, E., Vaughn, A., & Laditka, S. (2010). Farmers’ market use among African-American women participating in the Special Supplemental Nutrition Program for Women, Infants, and Children. Journal of the American Dietetic Association, 110(3), 441–446. http://dx.doi.org/10.1016/j.jada.2009.11.019 Raz, G. (2009, October 4). Farmers markets: Fresh, local,
government-approved [Radio program]. National Public Radio. Retrieved from http://www.npr.org/ templates/story/story.php?storyId=113484871 Schmit, T., & Gomez, M. (2011). Developing viable
farmers markets in rural communities: An investigation of vendor performance using objective and subjective valuations. Food Policy, 36, 119–127.
http://dx.doi.org/10.1016/j.foodpol.2010.10.001 Schumacher, G., Nischan, M., & Simon, D. B. (2011). Healthy food access and affordability. Maine Policy Review, Winter/Spring, 124–139.
Stephenson, G., Lev, L., & Brewer, L. (2007). “I’m getting desperate”: What we know about farmers’ markets that fail. Renewable Agriculture and Food Systems, 23(3), 188–199.
http://dx.doi.org/10.1017/S1742170507002153 Story, M., Kaphingst, K., Robinson-O’Brien, R., &
Glanz, K. (2008). Creating healthy food and eating environments: Policy and environmental
approaches. Annual Review of Public Health, 29, 253– 272. http://dx.doi.org/10.1146/annurev.publhealth. 29.020907.090926
U.S. Department of Agriculture [USDA]. (2010, June 26). USDA releases guide to expand SNAP benefit electronic benefit technology at farmers markets [Press release No. 0346.10]. Washington, D.C.: Author. U.S. Department of Agriculture Agricultural Marketing
Service [USDA AMS]. (2011). Farmers market growth: 1994–2011. Retrieved from http://www.ams.usda. gov/AMSv1.0/ams.fetchTemplateData.do? template=TemplateS&leftNav=Wholesaleand FarmersMarkets&page=WFMFarmersMarket Growth&description=Farmers%20Market%20 Growth&acct=frmrdirmkt
U.S. Department of Agriculture AMS. (2009). National farmers market manager survey 2006. Washington, D.C.: Author.
U.S. Department of Agriculture Food and Nutrition Service [USDA FNS]. (2010a). Supplemental Nutrition Service: Farmers’ market SNAP participants.
U.S. Department of Agriculture Food and Nutrition Service [USDA FNS]. (2010b). Supplemental Nutrition Assistance Program feasibility of implementing Electronic Benefit Transfer systems in farmers’ markets: Report to Congress. Washington, D.C.: Author.
U.S. Department of Agriculture Food and Nutrition Service [USDA FNS]. (2011). Healthy Incentives Pilot (HIP). Retrieved October 29, 2011, from
http://www.fns.usda.gov/snap/hip/default.htm U.S. Department of Agriculture National Agricultural
Statistics Service [USDA NASS]. (2009). 2007 Census of Agriculture report: Volume 1, complete report, all tables. Retrieved from http://www.agcensus.usda. gov/Publications/2007/
Varner, T., & Otto, D. (2008). Factors affecting sales at farmers’ markets: An Iowa study. Review of
Agricultural Economics, 30(1), 176–189.
http://dx.doi.org/10.1111/j.1467-9353.2007.00398.x White House, The. (2009, September 17). Remarks by the
First Lady at the opening of FreshFarm farmers’ market
[Press release]. Retrieved from
http://www.whitehouse.gov/the_press_office/ Remarks-by-the-First-Lady-from-farmers-market/ White House Task Force on Childhood Obesity, The.