Proc. IAHS, 370, 183–188, 2015 proc-iahs.net/370/183/2015/ doi:10.5194/piahs-370-183-2015
© Author(s) 2015. CC Attribution 3.0 License.
Open Access
in
Flood
Risk
and
P
erception
in
Catchments
and
Cities
(HS01
–
IUGG2015)
A process-based analysis of the suitability of copula
types for peak-volume flood relationships
J. Szolgay1, L. Gaál1,2, S. Kohnová1, K. Hlavˇcová1, R. Výleta1, T. Bacigál3, and G. Blöschl2
1Department of Land and Water Resources Management, Faculty of Civil Engineering, Slovak University of
Technology, Bratislava, Slovakia
2Institute for Hydraulic and Water Resources Engineering, Vienna University of Technology, Vienna, Austria
3Department of Mathematics and Descriptive Geometry, Faculty of Civil Engineering, Slovak University of
Technology, Bratislava, Slovakia
Correspondence to: J. Szolgay ([email protected])
Received: 17 March 2015 – Accepted: 17 March 2015 – Published: 11 June 2015
Abstract. The work aims at analyzing the bivariate relationship between flood peaks and flood volumes, with a particular focus on the type and seasonality of flood generation processes. Instead of the usual approach that deals with an analysis of the annual maxima of flood events, the current analysis includes all independent flood events in a catchment. Flood events are considered independent when they originate from distinguishably dif-ferent synoptic/meteorological situations. The target region is located in the northern part of Austria, and con-sists of 72 small and mid-sized catchments. On the basis of the discharge measurements with a time resolution of 1 h from the period 1976–2007, independent flood events were identified and were assigned to one of the three following flood generation type categories: synoptic floods, flash floods and snowmelt floods. These were subsequently divided into two seasons, thereby separating predominantly rainfall-fed and snowmelt-fed floods. Nine frequently-used copula types were locally fitted to the samples of the flood type and seasonal data. Their goodness-of-fit was examined locally as well as analyzed in a regional scope. It was concluded that (i) treating flood processes separately is beneficial for the statistical analysis; (ii) suitability patterns of acceptable cop-ula types are distinguishably different for the seasons/flood types considered, (iii) the Clayton and Joe copcop-ulas shows an unacceptable performance for all the seasons/flood types in the region; (iv) the rejection rate of the other copula types depends on the season/flood type and also on the sample size; (v) given that usually more than one statistically suitable dependence model exists, an uncertainty analysis of the design values in the en-gineering studies resulting from the choice of model seems unavoidable; (vi) reducing uncertainty in the choice of model could be attempted by a deeper hydrological analysis of the dependence structure between flood peaks and volumes in order to give hydrological support to the decision on model’s suitability in specific regions and for typical flood generation mechanisms.
1 Introduction
The design of flood retention basins and other hydraulic structures where storage is involved requires the entire hy-drograph or, at least, the flood volume/shape estimates re-lated to the flood peaks. Therefore, the relationship between flood peaks and volumes is an interesting scientific research issue both from the statistical and hydrological points of view. In particular, the examination of the interplay of cli-matic and catchment processes in defining the probabilities
de-184 J. Szolgay et al.: Suitability of copula types for peak-volume flood relationships pendence structure between them. Numerous studies have
been published on the degree of the dependence between flood peaks and volumes (e.g., Shiau, 2003; De Michele et al., 2005; Chowdhary et al., 2011; Requena et al., 2013) and how to choose he appropriate copula functions (e.g., Favre et al., 2004; Genest and Favre, 2007). Since the problem was often approached more from a purely statistical perspective, we attempted in two previous studies to better understand the hydrological factors controlling the dependence between peaks and volumes. In Gaál et al. (2012), we analyzed the ratio of both quantities based on the concept of compara-tive hydrology in a regional context in Austria and compared catchments with contrasting characteristics in order to un-derstand the controls in a holistic way. The results indicated that the catchment area is not the most important control but that the climate was found to be very important through its generating the storm type together with the process attributes through antecedent soil moisture and soil characteristics.
In Gaál et al. (2015), our aim was to understand the causal factors controlling the relationship between flood peaks and volumes for the same data. The consistency of the peak-volume relationship was quantified by Spearman’s rank cor-relation coefficient, which ranged from about 0.2 in the high alpine catchments to about 0.8 in the lowlands. The weak de-pendence in the high alpine catchments was due to the mix of flood types. The results also suggested that the factors con-trolling the dependence were mainly related to climate rather than catchment characteristics. This work, therefore, aims at analyzing the suitability of various copula-based bivariate re-lationships between flood peaks and flood volumes, with a particular focus on the type and seasonality of flood gener-ation processes with the goal of going beyond the statistics alone in the choice of the copula functions. This additional information is also important as there are rarely enough data to reliably fit the copula models of peaks and volumes for large return periods, so a priori information on causal factors may prove to be essential.
2 The study region and data
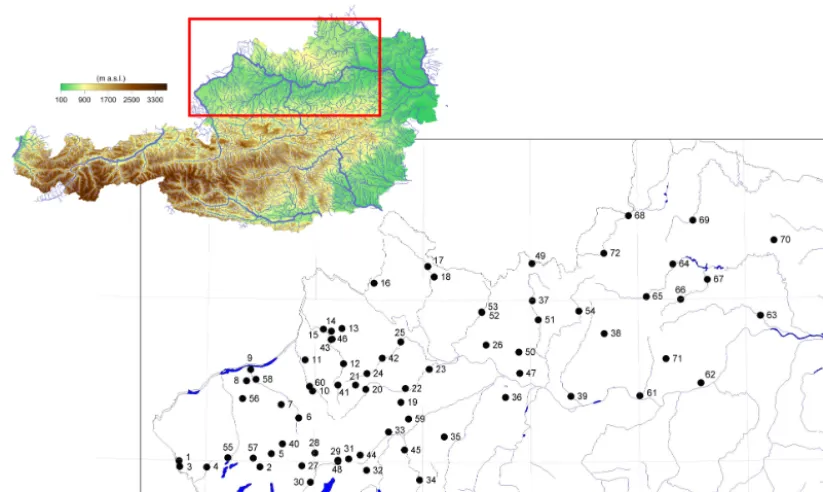
The data set used in this paper builds on the Austrian flood data described in Gaál et al. (2012, 2015) and the papers ref-erenced therein. In this paper, the runoff data observed with a time resolution of 1 hour were used from the period 1976-2007. There is a wide variety of flood-generation mecha-nisms across Austria (e.g., Merz and Blöschl, 2003), which result in complex flood peak-volume relationships (Gaál et al., 2012). In order to reduce this complexity in this first-step analysis, we decided to restrict our analysis to a geo-graphically more limited area, namely, the Northern Low-lands region (Fig. 1). The region is located in the northern part of Austria and covers approximately 1/5 of the area of the country. The 72 catchments analyzed have areas rang-ing from 10.6 to 444.3 km2 (median: 78.6 km2), while the
range of their mean elevations is 342 to 888 m a.s.l. (median: 571 m a.s.l.). The area is dominated by lowland and hilly sites, with elevations ranging from about 400 to 1500 m a.s.l. From a climatological point of view, the western parts of the region are under the influence of air masses from the Atlantic. Since the orographic enhancement is not significant, the an-nual rainfall amounts (from about 500 to 1500 mm) are lower than in the Alps. The mean annual precipitation in the tar-get region shows a decreasing western-to-eastern gradient. Floods in the Northern Lowlands region may occur both dur-ing the summer and winter. The winter floods are usually induced by snowmelt and rain-on-snow processes when an-tecedent snow melt saturates the soils, and air temperature in-creases. In such cases, relatively low rainfall intensities may cause significant floods.
3 Methodology
Independent flood events were identified in the runoff data series. According to our understanding, two subsequent flood events are independent when they do not originate from the same synoptic situation. We assumed here that after a 7-day period, a completely different atmospheric situation takes place, since in Central Europe cyclonic situations (fronts, weather types, etc.) usually do not persist longer than 7 days on average. The flood type classification introduced by Merz and Blöschl (2003) and modified in Gaál et al. (2015) was used to classify each separate flood event into synoptic floods (originally long or short rain-induced floods), flash floods (no change in the original classification) and snowmelt floods (originally rain-on-snow floods or snowmelt floods). These three types were subsequently further grouped into two sea-sons, i.e., the summer and winter seasea-sons, thereby separat-ing the predominantly rainfall-fed (synoptic and flash) events and floods related to snowmelt.
Nine frequently used one-parametric copula families from several classes of copulas were fitted locally to the samples of the grouped data, namely from the Archimedean class (Clay-ton, Frank, Gumbel-Hougaard and Joe copula), the extreme-value class (Gumbel-Hougaard, Galambos, Hüsler-Reiss), the elliptical class (normal, Studentt) and finally the Plackett copula. Their properties are summarized in Table 1. (The ab-breviations of the copulas used throughout the paper are: cla =Clayton, fra=Frank, gal=Galambos, gum= Gumbel-Hougaard, hus=Hüsler-Reiss, joe=Joe, nor=Normal, pla =Plackett, tco=tcopula). The mathematical background is summarized in a number of papers and is not repeated here (e.g., Genest and Favre, 2007).
The parametersθof the copulas were estimated by maxi-mizing the so-called pseudo-likelihood function
L(θ)=X i
logcθ U1,i, U2,i
, (1)
transforma-Figure 1.Geographical location of the 72 catchments selected.
Table 1.A summary of the 9 copula types fitted to the data.
Copula Archimedean Extreme Lower Upper
type copula value copula tail dependence tail dependence
Clayton yes no yes no
Frank yes no no no
Galambos no yes no yes
Gumbel-Hougaard yes yes no yes
Hüsler-Reiss no yes no yes
Joe yes no no yes
Normal (Gaussian) no (elliptical) no no no
Plackett no no no no
t(Student) no (elliptical) no yes yes
tion ofnreal observations of random variableXj, by means of a corresponding empirical distribution function (some-times referred to as the plotting position).
The goodness-of-fit was examined locally as well as an-alyzed in a regional scope. The goodness-of-fit of the para-metric copulas under consideration was tested by a “blanket” test (Genest et al., 2009) with the Cramér-von Mises measure of distance
Sn= n
X
i=1
Cθ U1,i, U2,i−Cn U1,i, U2,i2 (2)
between the parametric copulaCθ and the empirical copula defined by
Cn(u1, u2)= 1 n
n
X
i=1
1 U1,i≤u11 U2,i≤u2. (3)
The probability distribution of the test statisticSn, given that the null hypothesis (H0:Cθ fits well) holds, is unknown and needs to be bootstrapped. Consequently, thep-value is a per-centage of how many simulations of the test statistic (under H0) exceeds the estimator from the real observations.
4 Results and discussion
186 J. Szolgay et al.: Suitability of copula types for peak-volume flood relationships
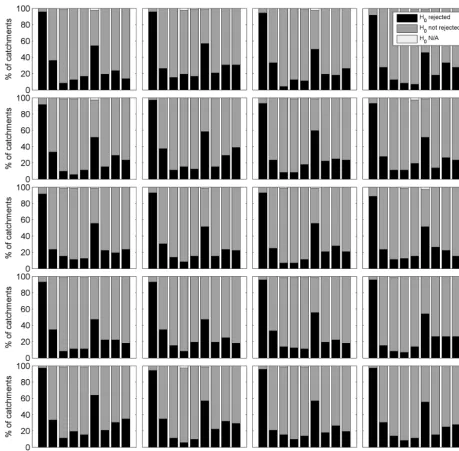
Figure 2.Matrix ofp-values for the goodness-of-fit test of the nine copula types at 72 catchments for the summer (synoptic and flash) and winter (snowmelt) floods. The black color indicatesp≤0.05, i.e., the rejection of the null hypothesisH0, while the grey colors yield the fact thatH0cannot be rejected.
Figure 3. Results of the goodness-of-fit test of the given copula types for the summer and winter floods: per cent ratio of the catch-ments where the given copula is rejected or cannot be rejected.
the patterns from Fig. 2. It shows the ratio of the catchments where the given copula is rejected or cannot be rejected for the summer and winter floods.
It can be concluded that for the rainfall-fed floods, three extreme value copulas performed best in the region (the Galambos, Gumbel-Hougaard and Hüsler-Reiss copulas) fol-lowed by the normal copula. The other copulas cannot be regarded as regionally acceptable. The choice changed and broadened when the winter floods were analyzed: the best performer was the Frank copula, followed by the normal and Plackett copulas and the three extreme value models. The
Clayton and Joe copulas show an unacceptable performance for both seasons.
However, the number of events analyzed was different for each flood type. The numbers ranged from 123 to 399 (av-erage 265), 18 to 150 (68) and 6 to 70 (24) for synoptic, snowmelt and flash floods, respectively. It was therefore fur-ther analyzed, if the different regional pattern of copula suit-ability in winter can only be attributed to the difference in the dependence structure itself (see Gaál et al., 2015, for a detailed discussion of the topic) or also to the fact that the number of winter events is lower compared to the summer floods (though larger than in many copula studies).
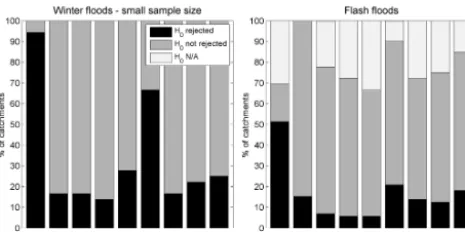
We illustrate the importance of considering the influence of the length of data series through two simple simulation experiments. In Fig. 4 the output from 20 randomly selected subsamples from the summer floods series is presented, where for all catchments the number of summer floods was set equal to the number of snowmelt floods. Figure 5 (left panel) shows the test results for a subset of catchments in which the number the winter floods was below the median (63 events and less). For comparison, the test results of the flash floods (which have the smallest number of events from all the flood types selected for this study) is also shown in the right panel in Fig. 5. Note that in some cases (indicated by N/A), the test could not be performed (i.e., copulas could not be fitted) due to the small data samples.
Figure 4.Results of the goodness-of-fit test of the given copula type for 20 randomly selected subsamples from the summer flood series, where for all catchments the number of summer floods was set equal to the number of snowmelt floods: per cent ratio of the catchments where the given copula is rejected or cannot be rejected or cannot be fitted due to a short data series (N/A).
and some of the patterns strongly resemble that of the winter floods (all events). The only clear tendency which remained is the high rejection rate of the Clayton and Joe copulas. The acceptance rate in Fig. 5 for the short winter flood series is higher for all types (but still more or less preserving the re-gional pattern), whereas for the very short flash flood series even the Clayton and Joe models approach the status of ac-ceptability. These results indicate that acceptance of a copula model can be conditioned on processes but the length of the series and possibly also the homogeneity of the flood types within a series play an important role.
188 J. Szolgay et al.: Suitability of copula types for peak-volume flood relationships
Figure 5.An analysis similar to that of presented in Fig. 3. Left panel: test results for a subset of catchments in which the number of the winter floods was below the median (63 events and less). Right panel: test results for the flash floods.
steps required to select a copula model (see, e.g., Genest and Favre, 2007). Our results support Favre et al. (2004), who emphasized that further work is needed to choose the best copulas capable of reproducing the dependence structure of multivariate hydrological variables.
5 Conclusions
Most of the work done so far does not relate to the hydrolog-ical adequacy of the copula selection, e.g., by directing the multivariate analysis toward the selection of certain types of models for specific runoff generation processes. The IID (= independent and identically distributed) requirement for the marginal distributions can also be seen as a weak point, es-pecially when the extremes analyzed are not selected on the basis of the catchment and meteorological processes govern-ing the flood generation.
Here the first issue was addressed in a regional context through a first step analysis by a rough differentiation of the flood types. It can be concluded that (i) modeling depen-dence by treating the flood processes separately in seasons is beneficial; (ii) the suitability patterns of acceptable copula types are distinguishably different for the seasons/processes considered, (iii) the Clayton and Joe copulas show an unac-ceptable performance for all the seasons/processes; (iv) the rejection rate of the other copula types depends on the sea-son/flood type and also on the sample size (smaller samples allow for a broader selection of suitable models); (v) given that usually more than one statistically suitable dependence model exist, an uncertainty analysis of the design values in the engineering studies resulting from the choice of model is recommended; (vi) reducing uncertainty in the choice of model should be attempted by a deeper hydrological analy-sis of the dependence structure/model’s suitability in specific hydrological environments or for a more specific distinction of the typical flood generation mechanisms. This will be done in a subsequent study.
Acknowledgements. We would like to thank the Austrian Academy of Sciences (International Strategy for Disaster Reduction Programme, IWHRE2008, 2008–2013), for the financial support. This research was also supported by the Slovak Research and De-velopment Agency under Contract No. APVV 0496-10, by the Slo-vak Grant Agency VEGA under Project No. 1/0776/13 and by the IMPALA project (FP7-PEOPLE-2011-IEF-301953) of the Marie Curie Intra European Fellowship.
References
Chowdhary, H., Escobar, L. A., and Singh, V. P.: Identification of suitable copulas for bivariate frequency analysis of flood peak and flood volume data, Hydrol. Res., 42, 193–216, 2011. De Michele, C., Salvadori, G., Canossi, M., Petaccia, A., and Rosso,
R.: Bivariate statistical approach to check adequacy of dam spill-way, J. Hydrol. Eng., 10, 50–57, 2005.
Favre, A.-C., El Adlouni, S., Perreault, L. Thiémonge, N., and Bobeé, B.: Multivariate hydrological frequency anal-ysis using copulas, Water Resour. Res., 40, W01101, doi:10.1029/2003WR002456, 2004.
Gaál, L., Szolgay, J., Kohnová, S., Parajka, J., Merz, R., Viglione, A., and Blöschl, G.: Flood timescales: Understand-ing the interplay of climate and catchment processes through comparative hydrology, Water Resour. Res., 48, W04511, doi:10.1029/2011WR011509, 2012.
Gaál, L., Szolgay, J., Kohnová, S., Hlavˇcová, K., Para-jka, J., Viglione, A., Merz, R., and Blöschl, G.: Depen-dence between flood peaks and volumes – A case study on climate and hydrological controls, Hydrol. Sci. J., 60, doi:10.1080/02626667.2014.951361, in press, 2015.
Genest, C. and Favre, A.-C.: Everything you always wanted to know about copula modeling but were afraid to ask, J. Hydrol. Eng., 12, 347–368, 2007.
Genest, C., Rémillard, B., and Beaudoin, D.: Goodness-of-fit tests for copulas: A review and a power study, Insurance: Mathematics and Economics, 44, 199–213, 2009.
Goel, N. K., Seth, S. M., and Chandra, S.: Multivariate modeling of flood flows. ASCE, J. Hydraul. Eng., 124, 146–155, 1998. Merz, R. and Blöschl, G.: A process typology of regional floods,
Water Resour. Res., 39, 1340, doi:10.1029/2002WR001952, 2003.
Requena, A. I., Mediero, L., and Garrote, L.: A bivariate return pe-riod based on copulas for hydrologic dam design: accounting for reservoir routing in risk estimation, Hydrol. Earth Syst. Sci., 17, 3023–3038, doi:10.5194/hess-17-3023-2013, 2013.
Shiau, J. T.: Return period of bivariate distributed extreme hydro-logical events, Stoch. Environ. Res. Risk Assess., 17, 42–57, 2003.