Proc. IAHS, 373, 119–123, 2016 proc-iahs.net/373/119/2016/ doi:10.5194/piahs-373-119-2016
© Author(s) 2016. CC Attribution 3.0 License.
Open Access
spatial
dimensions
of
w
ater
management
–
Redistr
ib
ution
of
benefits
and
risks
Modeling human-water-systems: towards a
comprehensive and spatially distributed assessment of
co-evolutions for river basins in Central Europe
Peter Krahe, Enno Nilson, Malte Knoche, and Anna-Dorothea Ebner von Eschenbach
Department Water balance, Forecasting and Predictions, Federal Institute of Hydrology, Koblenz, 56002, Germany
Correspondence to: Peter Krahe ([email protected])
Published: 12 May 2016
Abstract. In the context of river basin and flood risk management there is a growing need to improve the understanding of and the feedbacks between the driving forces “climate and socio-economy” and water systems. We make use of a variety of data resources to illustrate interrelationships between different constituents of the human-water-systems. Taking water storage for energy production as an example we present a first analysis on the co-evolution of socio-economic and hydrological indicators. The findings will serve as for the development of conceptual, but fully coupled socio-hydrological models for selected sectors and regions. These models will be used to generate integrated scenarios of the climate and socio-economic change.
1 Introduction
The adequate availability of water is an important determi-nant for the socio-economic development – with water repre-senting either an essential raw material or a threat e.g. in the case of flood events. At the same time the socio-economic de-velopment affects the water resources and the environment. Extensive reviews of challenges as well as guiding princi-ples of developing integrated socio-hydrological models for (i) system understanding (ii) forecasting and prediction as well as (iii) policy and decision-making have recently been given by Sivapalan and Blöschl (2015) and Blair and Buy-taert (2016). With this study we intend to assess the need and the feasibility of socio-hydrological approaches for solving practical management questions (cf. iii).
In the context of medium to long term river basin and flood risk management there is a growing need to improve the un-derstanding of and the feedbacks between the water and the human component. Among others, scenarios of global and regional climate change need to be combined with those of developments of the society to come to “adaptive scenarios” instead of “climate driven impact scenarios”. As a first step of an ongoing study we explore relevant human-water loops in a major part of Central Europe (Fig. 1).
In this paper (i) regions where human interference with the water cycle is particularly strong will be highlighted by a hydrological modelling approach, and (ii) time scales and potential drivers of a human-water system will be explored using the Swiss water power sector as a case study.
2 Study area
Our study area covers a major part of Central Europe
(ap-prox. 800 000 km2), namely the German river catchments
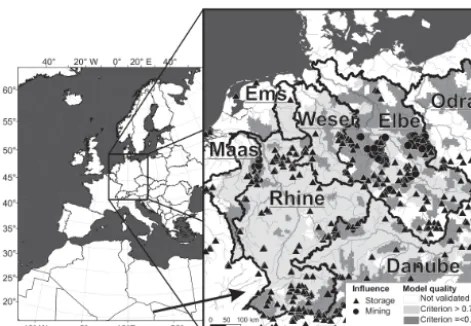
Figure 1. Model domain (left map) and validation results (right map) for river basins of the conceptual hydrological model LARSIM-ME. Grey scales in the right panel show classified val-ues of the coefficient of determination (R2) of daily flow values (November 1976 to October 2005). Locations of dams and min-ing were compiled from various sources (among others; Hydrolog-ical Atlas of Germany (BMU, 2003); Global Reservoir and Dam Database, GRanD; Lehner et al., 2011). Arrow marks the region selected as a case study.
Also, the water demand is unequally distributed region-ally, being concentrated in a number of large agglomeration areas. The socio-economic systems in Central Europe are op-timized to and dependent on relatively high and stable water resources. Consequently, the region is vulnerable to changes of water availability. Water resources and water use are thus regularly monitored on a national and continental level. Also, the “German Adaptation Strategy to Climate Change” intro-duces several indicators describing water resources (UBA, 2015).
3 Data and methods
Main challenges in socio-hydrological studies refer to the availability of long time series of data and indicators repre-senting the socio-economic part of the human-water-system as well as the level of conceptualization and complexity at appropriate spatial and temporal scales that allow integrating them into hydrological models. We start assessing these chal-lenges by identifying regions in our study area where human interference with the water cycle is particularly strong.
For that purpose, a hydrological model is applied for Cen-tral Europe (“LARSIM-ME”) using a new homogeneous hydro-meteorological data product (DWD-BFG HYRAS) as input. The model has been parameterised by regionalization of model parameters from catchments that show no/weak hu-man influence. We assume the simulated runoff to reflect nat-ural conditions and compare them with observed runoff data and with an inventory of dams and mining areas in the model domain.
Starting from this version of the water balance model, hu-man influence is currently successively being implemented. This will be done using operation plans of dams and water transfers, pumping volumes from open pit mines and water abstraction rules. Acquisition of this kind of information over a large region as the overall model domain is an intricate task because of the diversity of institutions and sectors involved. In some cases detailed information is often not available at all because it is retained due to privacy reasons.
Therefore, we evaluate methods to synthesize operation data for our model domain based on information from se-lected case studies that show an extraordinary good data sit-uation. On top of data availability, each case study has to fulfil two prerequisites: (i) the sector has to be dependent on at least one component of the water balance (ii) the regional water balance is modified by the sector with at least one man-agement measure.
In the following section we choose the case study “Wa-ter Power in Switzerland” as an example to highlight avail-able data and to display time scales and drivers of change. Data resources are given in Table 1. Analyses with regard to co-evolution processes will be performed by comparing time series of these variables with water resources data as well as meteorological and hydrological data.
4 Results
4.1 Water balance simulations
Selected results of the large scale water balance simulation run with regionalized parameters for the period November 1976 to October 2005 are depicted in Fig. 1. As the model parameters were determined in catchments with no/weak hu-man interference, the simulation can be regarded as repre-senting natural flow conditions. The dark grey regions show particular strong deviations between simulations and obser-vations. These regions are most frequent in the River Elbe catchment, the Alpine subcatchments of the Rivers Danube and Rhine, and in some catchments of tributaries of the Lower River Rhine. The spatial distribution of clusters of mining activities and water storages match well these regions (Fig. 1) indicating important modifications of the natural hy-drological system in Central Europe (transfer systems are not shown). Obviously, water balance simulations aiming to match the observed runoff require additional representation of human activities.
4.2 Case study “Water Power in Switzerland”
Table 1.Data used in case study “Water Power in Switzerland” (1t=temporal resolution, d=daily, m=monthly, a=annual; as plotted in Figs. 2 and 3).
Theme 1t Source
Air temperature of river basin upstream of gauge Basel-Rheinhalle
a, m CRU TS3.10 (Harris et al., 2014) EOBS8 (Haylock et al., 2008) Runoff at gauge Basel-Rheinhalle a, d FOEN (2016)
Storage water levels m SFOE (2016b) Power production from reservoirs m SFOE (2016a) Electricity consumer price index m FSO (2016b) Electricity consumption m SFOE (2016c) Consumer price index electricity (type III) m, a FSO (2016c)
Population a FSO (2016a)
Gross domestic product GDP a < 1995: Zuercher (2010) > 1995 (change): FSO (2016d)
Storage capacity a SwissCOD (2016)
Water power production a < 1985: Swiss Energy Council (1987) ≥1985: SFOE (2016c)
Electricity consumption a < 1990: Swiss Energy Council (1987) ≥1990: SFOE (2016c)
1910 1920 1930 1940 1950 1960 1970 1980 1990 2000 2010
2 4 6 8 10
Population [x 10 6 inh.]
0 200 400 600 800
GDP [x 10
9 CHF]
0 2 4 6 8
Storage capacity
[km
3]
0 20 40 60 80
Energy [x 10
3 GWh]
2 4 6 8 10
Temperature [°C] 200
400 600 800 1000
Runoff [m
3 s -1]
Population
Gross domestic product (GDP) Temperature
Runoff
Storage capacity Water power production Electricity consumption
50 75 100 Price-Index
Figure 2. Annual data of water storage capacity of dams, water
power generated (storage plus runoff power plants), and electric-ity consumed, hydrometeorologial conditions and socio-economic drivers in Switzerland since 1910. Runoff (lowest daily flow) and temperature refer to hydrological years (November–October). The arrow marks a period of a higher level of low flows after 1970. (Data sources: cf. Table 1)
Swiss/German border as well potential climatic and socio-economic drivers of change. Available data allows this as-sessment on an annual basis for the period 1910 to 2012.
At the beginning of the 20th century storage capacities and electricity consumption were very low. At this time water power was used more or less mechanically in the vicinity
of the rivers (Swiss Energy Council, 1987). In the follow-ing decades storage capacities and water power production increased continuously until the 1970ies as a consequence of several developments: (i) a Swiss law targeting at the utilization of water power was released in 1918 (ii) techni-cal innovations allowed the construction of larger dams and (iii) improved distribution of electricity over large distances. The latter also preconditioned the general electrification of the society and economy, which were both steadily growing. Since the mid of the 1970ies, there was no further increase of storage capacity and water power production. At the same time nuclear power was prioritized to meet the still growing electricity demand (Swiss Energy Council, 2015). It may be noteworthy, that after the mid 1970ies onwards the annual minimum runoff at gauge Basel hardly did ever drop below
400 m2s−1(cf. arrow in Fig. 2). This can to a large degree be
attributed to the storage capacity implemented.
From 1995 onwards water power production data shows only minor long term increases (due to optimization of ex-isting power plants), but a stronger year-to-year variability. This is at least in part due to a change of the data source and the way the data were calculated (cf. references given in Ta-ble 1). Nevertheless, these data may give an indication that – although socio-economical drivers dominated the centennial development – meteorological and hydrological conditions affect water power production variability on a year-to-year scale. This coincidence is, however not very clear on the an-nual scale.
01/1995 01/2000 01/2005 01/2010 01/2015
0 1 2
Filling level
[-/-]
0 1 2
Power production
[-/-]
0.75 1 1.25
Power consumption
and price [-/-]
-20 0 20
Temperature
[K]
0 1 2
Runoff [-/-]
Figure 3.Time series of monthly water storage filling level,
wa-ter power generation, electricity consumption/prices, and hydrom-eteorological conditions in Switzerland since 1995. All data were converted to anomalies with respect to their averages of the period 1995–2010. (dashed line: Electricity consumer price index; shad-ing indicates hydrological seasons with white=winter; the arrow marks a singularity in winter 2006/07) (Data sources: cf. Table 1)
During the winter season, when runoff is typically low, wa-ter is released. The wawa-ter power production shows a vague pattern with one weak peak during the high runoff period in summertime and one stronger peak during the release period in wintertime. The overall consumption of electricity shows – on top of a long term increase up to the year 2006 – a rather regular pattern with a single major peak during the heating season in winter. The amplitudes of most variables vary only moderately and the pattern persists remarkably stable over the years. One exception is the winter of 2006/2007 which was extraordinary warm. This coincides with higher than av-erage minimum water levels of storages due to lower elec-tricity consumption (less heating).
5 Discussion and conclusions
Clearly, potential water availability is the backbone of activ-ity in the water power sector. However, technological devel-opments were the main drivers for the onset and the cessation of the growth of water power production and the related mod-ifications of the natural water system through reservoirs. The increase of water power production took place over three to four decades. Variability of natural drivers as reflected e.g. by air temperature and runoff manifests as second order vari-ability in water power time series. This is visible on a year-to-year basis, but much more on a monthly timescale.
The steady seasonal pattern of reservoir operation repre-sents a feature that could be described by comparatively sim-ple models. This would allow us to generate storage data for the past as well as for climate impact studies. However, the long term socio-economy-driven developments tell us, that the pattern may be stationary only for limited time. Global climate change, a change of energy mix in Europe, and the ongoing deregulation of the energy market in Switzerland are possible candidates to cause changes in the operation of Swiss dams. Estimating the consequences of these so far un-observed phenomena remains a challenge.
Similar case studies are underway in other regions of our model domain and examining other sectors such as urban wa-ter supply, agriculture, navigation etc. We attempt to build simple conceptual models representing those sectors which interfere most with the water cycle in Central Europe. By combining these models with the water balance model we try to provide explicit information on spatial and temporal scales that are suitable for supra-regional water resources manage-ment.
Data availability
Most of the data used in this study are taken from freely avail-able (open access) data sources listed under references. We acknowledge the E-OBS dataset from the EU-FP6 project ENSEMBLES (http://ensembles-eu.metoffice.com) and the data providers in the ECA&D project (http://www.ecad.eu). Locations of dams and mining taken from Hydrological At-las of Germany are protected by copyright but published as a printed map (BMU, 2003). Digital data can be supplied for research activities by the author.
References
Blair, P. and Buytaert, W.: Socio-hydrological modelling: a review asking “why, what and how?”, Hydrol. Earth Syst. Sci., 20, 443– 478, doi:10.5194/hess-20-443-2016, 2016.
BMU (Bundesministerium für HAD Umwelt, Naturschutz und Reaktorsicherheit): Hydrologischer Atlas von Deutschland (Hy-drological Atlas of Germany), Map 7.2 Water Supply, Bonn, 2003.
FOEN (Federal Office for the Environment, Switzerland): Hy-drological Data Service for water courses and lakes, available at: http://www.bafu.admin.ch/wasser/13462/13494/15076/index. html?lang=en, 2016.
FSO (Swiss Federal Statistical Office): Bevölkerungsstand und -struktur – Detaillierte Daten (state and structure of population – detailed data), available at: http://www.bfs.admin.ch/bfs/portal/ de/index/themen/01/02/blank/data/01.html, 2016a.
FSO (Swiss Federal Statistical Office): Schweizerische Preisindizes 1914–2014 (Price indices of Switzerland), available at: http:// www.bfs.admin.ch/bfs/portal/de/index/themen/05/01/100.html, 2016b.
avail-able at: http://www.bfs.admin.ch/bfs/portal/de/index/themen/05/ 02/blank/data.html, 2016c.
FSO (Swiss Federal Statistical Office): Bruttoinlandprodukt – Daten, Indikatoren (Gross domestic product – data idicators), available at: http://www.bfs.admin.ch/bfs/portal/de/index/ themen/04/02/01/key/bip_gemaess_produktionsansatz.html, 2016d.
Harris, I, Jones, P. D., Osborn, T. J., and Lister, D. H.: Updated high-resolution grids of monthly climatic observations – the CRU TS3.10 Dataset, doi:10.1002/joc.3711, 2014.
Haylock, M. R., Hofstra, N., Klein Tank, A. M. G., Klok, E. J., Jones, P. D., and New, M.: A European daily high-resolution gridded dataset of surface temperature and precipitation, J. Geo-phys. Res.-Atmos., 113, D20119, doi:10.1029/2008JD010201, 2008.
Lehner, B., Reidy Liermann, C., Revenga, C., Vorosmarty, C., Fekete, B., Crouzet, P., Döll, P., Endejan, M., Frenken, K., Magome, J., Nilsson, C., Robertson, J. C., Rodel, R., Sin-dorf, N., and Wisser, D.: Global Reservoir and Dam Database, Version 1 (GRanDv1): Dams, Revision 01. Palisades, NY: NASA Socioeconomic Data and Applications Center (SEDAC), doi:10.7927/H4N877QK, 2011.
Nilson, E., Krahe, P., Lingemann, I., Horsten, T., Klein, B., Caram-bia, M., and Larina, M.: Auswirkungen des Klimawandels auf das Abflussgeschehen und die Binnenschifffahrt in Deutschland, Schlussbericht KLIWAS-Projekt 4.01. KLIWAS-43/2014. BfG, Koblenz, doi:10.5675/Kliwas_43/2014_4.01, 2014.
Schneider, C., Laizé, C. L. R., Acreman, M. C., and Flörke, M.: How will climate change modify river flow regimes in Europe?, Hydrol. Earth Syst. Sci., 17, 325–339, doi:10.5194/hess-17-325-2013, 2013.
SFOE (Swiss Federal Office of Energy): Electricity Statistics, Wochenstatistik Elektrizitätsbilanz (Weekly statistic of elec-tricity balance), available at: http://www.bfe.admin.ch/themen/ 00526/00541/00542/00630/index.html?lang=en&dossier_id= 00767#, 2016a.
SFOE (Swiss Federal Office of Energy): Electricity Statistics, Fül-lungsgrad der Speicherseen (filling level of reservoirs, avail-able at: http://www.bfe.admin.ch/themen/00526/00541/00542/ 00630/index.html?lang=de&dossier_id=00766, 2016b.
SFOE (Swiss Federal Office of Energy): Electricity Statistics, Gesamte Erzeugung und Abgabe elektrischer Energie in der Schweiz (total generation and release of electricity in Switzer-land), available at: http://www.bfe.admin.ch/themen/00526/ 00541/00542/00630/index.html?dossier_id=00769, 2016c. SwissCOD (Swiss Committee On Dams): Dams in
Switzer-land, available at: http://www.swissdams.ch/index.php/en/ swiss-dams/dams-in-switzerland, 2016.
Sivapalan, M. and Blöschl, G.: Time scale interactions and the co-evolution of humans and water, Water Resour. Res., 51, 6988– 7022, doi:10.1002/2015WR017896, 2015.
Swiss Energy Council (Ed.): Energiestatistik der Schweiz 1910– 1985, Zürich 1987, available at: http://www.worldenergy.ch/ Seiten/Energiestatistik/uebersicht/Einleitung/?oid=1482&lang= de, 1987, 2015.
Umweltbundesamt (UBA) (Ed.): Monitoringbericht 2015 zur Deutschen Anpassungsstrategie an den Klimawandel, Bericht der Interministeriellen Arbeitsgruppe Anpassungsstrategie der Bundesregierung, Dessau-Roßlau, available at: http://www. umweltbundesamt.de/publikationen/monitoringbericht-2015, 2015.