Performance Analysis of HSPA Technology for Networked
Control System Application
Muhammad Ary Murti
1, 2*, Harijono A. Tjokronegoro
1, Edi Leksono
1, Wiseto Agung
3 1 Institut Teknologi Bandung, Indonesia.2 Telkom University, Indonesia. 3 PT. Telkom Indonesia.
* Corresponding author. Tel.: +6281214382436; email: [email protected] Manuscript submitted July 23, 2014; accepted April 15, 2015.
doi: 10.17706/ijcce.2016.5.3.165-175
Abstract: Delay and dropout are important parameters in Networked Control System (NCS). They influence
to overall control system performance. The characteristic of delay and dropout that occur in the network should be considered on NCS implementation. Global System for Mobile (GSM) technology is advantage alternative on wide coverage and easy deployment to provide connection through internet network. Live performance testing of GSM network commonly looks at the quality of service parameters, such as throughput, jitter, and packet loss. Those parameters are not enough for considering NCS implementation. The goal of this research is to find the properties of one-way delay and dropout of every single data packet and the performance of the High Speed Packet Access (HSPA) network regarding to NCS needed application design. Testing has done by observing each data packet sent to the destination. The delay and dropout as a function of the data size and Transmission Time Interval are analyzed. The amount of delay and dropout are influenced by speed availability of mobile operator. The result from this test had 60 kbps average internet speed and with 800 Byte of data size, 1000 packets transmitted on interval of 100 ms, the delay and dropout increased significantly up to 9.5 s of delay and 43% of dropout. This paper recommended data size and transmission time interval under 600 Byte and 100 ms to keep delay and dropout at low level.
Key words: Delay, dropout, high speed packet access, networked control system.
1.
Introduction
Using data communication networks in control System to connect sensors, actuators and controllers has been growing driven by wireless network technology. The advantages of wireless technology are simple on installation and allowing the controller has different location with the plant site [1]. It had extended a new application where a plant could serve by a control system that sent control signals via a data communication network. This system is known as a Networked Control System (NCS) [1].
However data communication networks application generates its own problems due to random delay and dropout [2]. A delay is a time that needed by data package to arrive on the receiver. If the delay is longer than the life time allowed in the network, the data packet will be dropout. Packet Loss is the amount of dropout packets. Wireless networks presented more significant effect because the nature of the time-varying channel, the presence of attenuation, multipath fading, limited spectrum, and the interference.
this case, the control solution may be achieved by implementing the observer. Periodic Observer and Robust Fuzzy Observer have been proposed in references [3] and [4] respectively.
As the internet technology advances the use of the Internet as a data communication network for NCS application is started to be considered. Internet has advantages on low prices and wide coverage for many applications by remote distances [5]. The Machine to Machine (M2M) communication, as part of the internet based system, is becoming popular after the M2M standards has been introduced by the European Telecommunications Standards Institute (ETSI). The M2M actually is a specific machine with capabilities to communicate with another machine through a specific data communication channel in autonomous [1]. There are number of internet access technologies are available to public such as GSM (Global System for Mobile), CDMA (Code Division Modulation Access), ADSL, Satellite, and Fiber Optic.
Cellular network has advantages in terms of availability of a wide coverage of network, modem device with affordable prices, and in particular continues development to increase the transmission speed [6]. In addition, the data transmission speed through the GSM network has fulfilled the needs of data streaming applications by 3G technology and beyond.
A number of papers have shown the results of performance analysis on 3G and 3.5G cellular networks through simulation [7], [8]. To have an accurate model of cellular networks delay and dropout for NCS applications, it is necessary to analyze and improve the model using empirical data [9]. A number of papers have completed the analysis by experimental. Reference [10] discussed a performance analysis of data with UDP (User Datagram Protocol) and TCP (Transmission Control Protocol) through HSPA (High Speed Packet Access) network. The performance has been evaluated using the parameters of goodput, delay and jitter that occurred on the network without discussing the presence of dropout or packet loss. While reference [11] and [12] have conducted the experiment on 3G and 3.5G cellular technologies with different ground speed scenarios. They analyzed the effects on the parameters of throughput, jitter and loss rate. Reference [13] included the operator's network traffic data into simulation to calculate the effect of number of users to throughput. The parameters those have been analyzed are jitter, throughput, and packet loss on average. Some of them provide information solely on RTT (Round Trip Time) delay on average. The one-way delay experimentation was conducted by Soto et al. [12]. Experiment was done with duration of 10 seconds for every test. The obtained data was averaged in 10 second for 40 tests for every test scenario. But, in the experiment of Solo, no mention the size of data to be sent and the time interval of each test.
So far, all of the results do not provide the information of delay and dropout on cellular networks for NCS application purposes. It’s due to the experiment that has been done for data communication analysis only. Many control methods required an accurate model of network [9], for example, predictive control methods are discussed Xia et al. [14] requires a precise model of the delay. Ghanaim et al. [15] develop model of delay that occurred on Ethernet network using Petri Net based on working time sequences, and formulate it on Markov Model. This Markov model can estimate sequence of next delay and used it for analyst control system performance.
As far as author knowledge, no papers discussed on HSPA network experiment to get information on delay and dropout that occurs for every single data packet has sent. Considering NCS application, it is necessary to do experiment to obtain information about one-way delay and dropout on two directions at the same time. In addition, necessary testing was conducted to determine the effect of data size and interval transmission time to delay and dropout. In addition, in this research has been analyzed as well cellular network performance regarding on its application to NCS.
2.
System Model
Networked Control System
2.1.
NCS network models are generally divided in two types. The first model treats the network as a system that is represented by the changing of delay and dropout, regardless of network type and technology. The example of first model type can be seen in reference [1], [16] and [17]. While the second type consider the structure and mechanism on network, as discussed in reference [15] and [18].
Down Link
Controller
Up Link
Actuator
Plant
Sensor
u
ˆ
u
y
ˆ
yFig. 1. NCS block diagram.
In general, the block diagram of NCS can be described as by Fig. 1. As shown by Fig. 1, when the controller is located on the server side and the plant is in client side, then the direction of data communication from Controller to Actuator (CA) called as Down Link, while from the sensor to the controller (SC) called Up Link.
Referring to Fig. 1, control signal u(t) which sent by controller to actuator may be experienced delays and dropouts, or can be state as u tˆ( ) f y t( ( ),ca,Lca). Likewise, the feedback signal, the sensor output which
sent over the network may be experienced the delays and dropouts so can be written as,
ˆ( ) ( ( ), sc, sc)
y t f y t L , where τca: down link delay, Lca : dropout at down link, y(t) : feedback signal, τsc : up link delay, and Lsc : Dropout at up link.
HSPA (High Speed Packet Access)
2.2.
HSPA was defined by 3GPP (Third Generation Partnership Project) as one of GSM technologies evolution, and then known as third and half generation (3.5G) after UMTS (Universal mobile Telecommunications System) as 3G technology. Theoretically, HSPA can reach speeds of 1.8-14 Mbps depending on the implementation. This speed performance is obtained by using new modulation scheme, adaptive coding and HARQ (Hybrid Automatic Retransmission Query) [19]. But the frequency spectrum bandwidth owned by a cellular operator will effect on real speed at end user. With so many operators in Indonesia, the available spectrum provides narrow bandwidth for every operator. And with a large number of mobile users, the expected speed cannot be obtained in practice.
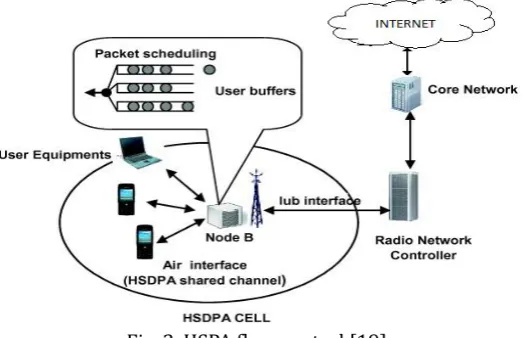
The scheme of HSPA flow control is shown by Fig. 2. The delay on the HSPA network occurs mainly due to queuing on the network. Data packet will be stored at buffer and waiting to transmit to destination. Flow Controller on HSPA measure the size and number of Packet Data Unit (PDU) at Node-B buffer. It doesn’t consider the availability of resources on the Iub transport network that sharing for services as Real Time (RT), Non-Real time (NRT) and HSPA used. As shown in Fig. 2, the data flow controller will maintain amount of data that sent from and to the RNC (Radio Network Controller) to keep buffer and capacity of air interface becomes optimal, and delay in the buffer is not too large.
In HSPA networks, there are three buffers where data packet will experiences longest delay. At those buffers, the packet may be drop when buffer is full or data packet stay in a buffer and pass the allow maximum time. The three buffers are [19] RLC (Radio Link Control), Transport Network, and MAC-hs Buffer. Flow Controller in Node-B will provide information to RNC the data capacity allocation on PDU number that can be sent to user based on user channel quality at that time. Node-B will send data to the UE (User Equipment) during 2 ms with number of PDU sent is SNode-B. While the RLC send PDU to Node-B on duration
10 ms with number of PDU sent is SRLC. The queuing time delay at RLC buffer is given by [19]:
(
)
1
(
)
/
(1
) (
)
2
RLC
RLC RLC RLC
RLC RLC
E X
E
TTI
TTI
P
E A
(1)where
XRLC : queue length at the buffer; PRLC : probability of dropout at RLC; ARLC : number of incoming packets;
TTIRLC : Transmission Time Interval (10ms).
Total delay in three buffers can be written as [19]:
Node
= (
)
(
)
(
)
T
E
RLCE
TrE
B
(2)τT : Total Delay
E(τRLC) : Delay on RLC buffer E(τTr) : Delay on Transport buffer E(τNodeB) : Delay on buffer Node B
3.
Experiment Method
To obtain τca and τsc, we need experimentation that allow us to send bidirectional data with adjustable of
data size and transmission time interval. The configuration of experiment is shown in Fig. 3, where two computers connected to internet network using a HSPA modem. The experiment used the same GSM operator for both modems at one BTS (Base Station) to provide best condition.
The data transmission protocol that was used in this experiment was UDP (User Datagram Protocol). Unlike TCP (Transmission Control Protocol), UDP is sending every single data packet in one time, without resending and notification when data packet has arrived. UDP is widely used in applications with streaming data transmission characteristic such as VOIP (Voice over IP) and monitoring system. NCS application also required sending data continuously without retransmission for the same data since there are always new data. In this experimentation is used the application such as Traffic Generator, UDP tool and Packet builder to transmit data in UDP passion.
Fig. 3. Experiment architecture.
Let’s assumed the computer B has been connected to plant, then computer B will send the sensor measurement data to computer A. Based on the received data, the computer A as the controller will calculate and send control signal to computer B. Direction of data transmission from B to A is called uplink path or SC (Sensor to Controller) in Fig. 1. In fact, the data will go through the process of uploading and downloading on modem B and modem A. Similarly with reverse direction from A to B or CA (Controller to Actuator), the data packets are also undergoing a process of uploading and downloading on modem A and modem B.
Furthermore, in both computers are performed network monitoring software. The software will capture every packet of data that was sent and received in computer. One of network monitoring software that can be used is Wireshark with capability to provide information with time resolution of 1 micro second, record source and destination IP address, package size, and other important information of each data packet. By comparing each packet recorded from both computers, one-way delay and dropout for two directions can be obtained.
4.
Result and Discussion
One-Way Delay
4.1.
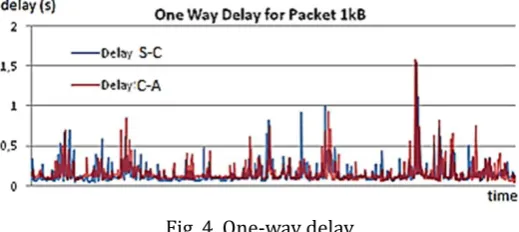
Fig. 4. One-way delay.
hundred of measurement data. It’s big enough to represent a big plant that connected to internet through one modem as gateway. But it’s still small if we compare to internet speed since only need 8 kbps to send a 1000 byte of data packet at one second. The experiment was performed three times and one-way delay data is obtained as shown in Fig. 4.
Fig. 4 shows that each data packet experienced different delay with the smallest delay was 53.217ms, the largest delay was 1.57s, and with average 0.15s. Transmission time interval in average was 0.28 seconds. The smallest time interval in this experiment was 0.13s and the largest reaching 1.3s. The results from three experiments are summarized in Table 1.
Table 1. One-Way Delay
Test
One-way delay (sec) Sensor to Controller
One-way delay (sec) Controller to Actuator
Min max Avg Min max Avg
1 0,0545 0,7319 0,1195 0,0545 0,8673 0,1626 2 0,0532 1,5425 0,1536 0,0532 1,5774 0,1606 3 0,0646 1,5850 0,1644 0,0646 0,8406 0,1593
As shown in Table 1, the maximum value on both directions have different delay of 0.8 s, but the average delay in the third experiment have average of 0.146 s and 0.16 s. The one-way delay of both directions has correlation of 0.51.
Data Size Effect to Delay and Dropout
4.2.
This experiment used Colasoft packet builder application. The application may adjust size of data in one packet and transmission time interval. The goal was to collect data of delay and dropout as function of data size and transmission time interval. Every test was done with 1,000 packets of data sent simultaneously at both directions.
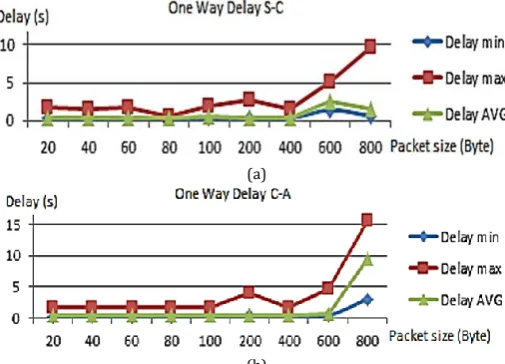
Based on previous test results, traffic generator has average TTI 0.28s to avoid dropout. Therefore, in the experiment has been selected TTI value 0.1 s. Furthermore, 1000 packets were sent, with the packet size is 20 Bytes to 800 Bytes. Using network monitoring software, we got delay and dropout as function of data size as shown by Fig. 5 and Fig. 6.
Fig. 5 and Fig. 6 show that delay and dropout were increased significantly at 800 Bytes of data size. At 800 Byte of data, average delay was increased up to 9.6 s and up to 43% data packets was dropout.
(a)
(b)
Fig. 6. Data packet size effect to dropout.
Transmission Time Interval Effect to Dropout
4.3.
To complete the test, then experiments were conducted with fixed data size of 100 Bytes and transmitted with deferent time intervals, ranging from 100 ms to 10 ms. The experiment with each TTI value sent 1000 packets of data.
Fig. 7. Transmission time interval effect to dropout.
As shown by Fig. 7 the dropout starts growing when TTI is increased until 10 ms. Internet speed (bit rate) can be calculated by:
where:
BR: Bit Rate (bps: bit per second) Packet size: Data size in one packet (bit) TTI: Transmission Time Interval (sec)
When it is used 100 bytes of data size with TTI = 10 ms, then the required data communication speed is equal to 80 kbps. Similarly with 1000 bytes of data and 100 ms of TTI would require the same bit rate of 80 kbps.
Probability Distribution of Delay
4.4.
The Distribution of Probability of delay can be seen in Fig. 8 below.
(a)
TTI
size
packet
=
BR
=
(b)
Fig. 8. Probability distribution of delay. (a) Sensor to controller, (b) Controller to actuator.
Fig. 8 shows the distribution of delay has a shape that is almost equal distribution for both sides, Sensor to Controller and Controller to Actuator. The resulted distribution was close to Poisson distribution as the following equation:
(
)
( ; )
Pr(
)
!
k
e
f k
k
k
(4)where
τ : Delay as random variable;
e : Base of natural logarithm (e = 2.71828...);
k! : Factorial of k;
k = 0,1,2;
λ : Expected value and variant of τ, λ=E[τ]=Var (τ);
5.
Recommendations
NCS requires reliability of data transmission with short delay and dropout at quite small parts. This is related to the selection of control algorithm that allows the influence of the delay and dropout. The two parameters that effected to time delay and packet dropout is the size of data and TTI. Both parameters will be limited by availability of internet connection speed provided by operator as service provider.
Fig. 9 shows the download and upload speed during two identic testing with 1000 Bytes of data size and TTI = 100 ms. As shown by Fig. 9, the average BR that obtained is about 60 kbps. Based on equation (3), it needs BR at least 80 kbps to make it able to send all data packet. Because the real internet speed during the test was slower than required, the delay increased rapidly and big number of dropout data was occurred.
The test results of the service provider used in this study were obtained 60 kbps of average BR. Although the technology of data communication link was HSPA, which allows data rates up to 1 Mbps, however due to bandwidth and allocation restrictions by operator, the real of average BR was lower than expected.
To determine the size of the data packets, we it should be considered number of devices will be connected to one gateway (modem). When using Base64 standard data format, then each device requires 64 bits of data to make it able to be recognized and processed on a server. The number of devices that can be connected to one gateway as function of size of data packet can be seen in Fig. 10. It shows that when we use 100 byte of data packet size then the numbers of devices that can be connected to one gateway are 13 devices.
Fig. 10. Device number versus packet size (byte).
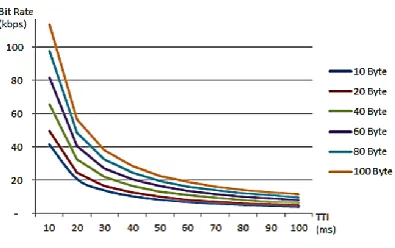
Fig. 11. Speed versus data size and TTI.
Fig. 11 shows the required speed for different data sizes and TTI. If we choose 100 Bytes of data size, than the fastest TTI is 20ms. It’s because required speed is only 56.8 kbps. Based on the experiment results, can be confirmed that this condition will experience almost no dropout with a small delay. It due to the speed of the required data still can be met by internet connection speed.
This paper has shown the test results of live (on network) performance of HSPA networks belonging to one of the GSM operator in Indonesia. The number of delay and dropout are influenced by the size of data and transmission time interval. Delay and dropout significantly increased when the data size reaches 800 byte with 100ms interval that obtained an average delay of 9 seconds and packet loss by 43%. To keep low delay and dropout, it is necessary to consider data size and transmission time interval used in the NCS. The design of NCS must refer to real data speed that provided by internet service provider. In this experiment indicated that available data rates only 60 kbps. Than the fastest TTI is 20ms with 100 bytes of data size. With Base64 data format, 100 byte of data size can transmit from 13 devices.
References
[1] Murti, M. A., Tjokronegoro, H. A., Leksono, E., Wiseto, A. (2013). Multi-delay multi-dropout model of M2M data network for networked control system. Proceedings of the 19th Asia Pacific Conference on Communications.
[2] Chamaken, A., & Litz, L. (2010). Joint design of control and communication in wireless networked control systems: A case study. Proceedings of the American Control Conference (pp. 1835-1840).
[3] Simon, S., Gorgies, D., Izak, M., & Liu, S. (2010). Periodic observer design for networked embedded control systems. Proceedings of the American Control Conference (pp. 4253-4258).
[4] Jing, Y., Chen, Z., & Dimirovski, G. M. (2010). Robust fuzzy observer-based control for TCP/AQM network systems with state delay. Proceedings of the American Control Conference (pp. 1350-1355). [5] Luo, R. C., Su, K. L., Shen, S. H., & Tsai, K. H. (2003).Networked intelligent robots through the internet:
Issues and opportunities. Proceedings of the IEEE, 91(3), 371–382.
[6] Ericsson, A. B. (February 2007). Basic Concepts of HSPA. White Paper Uen Rev A. Ericsson (pp. 4-20). [7] Harteneck, M., Boloorian, M., Georgoulis, S., & Tanner, R. (2005).Throughput measurements of HSDPA
14 Mbit/s terminal.
[8] Jaime, G. D. G., Leão, R. M. M., Silva E. S., & Marca, R. B. (2008).The Effect of Mobility on the User-Level Fairness of a 3G Wireless Technology (EVDO). Proceedings of IEEE Wireless Communications and Networking Conference (pp. 3303–3308).
[9] Gupta, R. A., & Chow, M. (2010). Networked control system: Overview and research trends. IEEE Transaction on Industrial Electronics, 57(7), 2527-2535.
[10]Jurvansuu, M., Prokkola, J., Hanski, M., & Perälä, P. (2007). HSDPA performance in live networks.
Proceedings of IEEE International Conference on Communications (pp. 467-471).
[11]Jang, K., Han, M., Cho, S., Ryu, H., Lee, J., Lee, Y., & Moon, S. (2009). 3G and 3.5G wireless network performance measured from moving cars and high-speed trains. Proceedings of MICNET.
[12]Soto, J. A. E., Diaz, J. A. P., Valdovinos, I. A., & Hernandez, C. F. G. (2012). Performance analysis of 3G+ cellular technologies with mobile clients. Journal of Applied Research and Technology, 10(2), 227-247. [13]Haider, F., Hepsaydir, E., & Binucci, N. (201). Performance analysis of a live mobile broadband — HSDPA
network. Proceedings of IEEE 73rd Vehicular Technology Conference.
[14]Xia, Y., Liu, G. P., & Rees, D. H. (2006). H∞ control for networked control systems in presence of random network delay and data dropout. Proceedings of Chinese Control Conference.
[15]Ghanaim, A., & Frey, G. (2011). Modeling and control of closed-loop networked PLC-systems.
Proceedings of 2011 American Control Conference (pp. 502-508).
[16]Dongsong, L., Zhiwen, W., & Ge, G. (2008). Modeling and stability analysis of MIMO networked control systems. Proceedings of The 27th Chinese Control Conference (pp. 240-242).
[17]Li, Q., Bugong, X., & Shanbin, L. (2011). Modeling and analysis of networked control system with random time delays and packet dropouts. Proceedings of the 30th Chinese Control Conference (pp.
4527-4532).
[18]Alur, R., D’Innocenzo, A., Johansson, K. H., Pappas, G. J., & Weiss, G. (2011). Compositional modeling and analysis of multi-hop control networks. IEEE Transactions on Automatic Control,56(10).
[19]Bodrog, L., Horvath, G., & Vulkan, C. (2008).Analytical TCP throughput model for HSDPA. Proceedings of the 24th UK Performance Engineering Workshop (pp. 89–106).
Muhammad Ary Murti was born in Jakarta on June 7, 1975. He graduated from
Universitas Brawijaya at 1998 on electrical engineering and received his master of engineering degree on instrumentation and control from Institut Teknologi Bandung at 2004.
He joined the STTTelkom (currently Telkom University) in 1998 as a lecturer and since then he has worked for different positions at STTelkom/ITTelkom/Tel-U including coordinator at the Electrical Measurement Lab, the head of Electronic System Laboratory, Control and
Industrial Automation Laboratory, and head of Undergraduate Program (2007-2011).
He involved at many conference, such as WOCN2007 Singapore, WOCN2008 Surabaya, ICCSII2012, TIME-e2013, APCC2013 and more. He is a member of IEEE since 2005, IEEE Communication Society, IEEE Control System Society and IEEE Robotics and Automation Society. His research interests include electrical, control, and industrial automation. Currently he is working on networked control system, cellular M2M, and internet of thing.
Harijono A. Tjokronegoro received the B.S. degree (Engineer) in engineering physics
from Institut Teknologi Bandung, Indonesia in 1977 and both the M.Sc. degree and the Ph.D. degree on automatic control and signal processing from Institut Polytechnique de Grenoble, France in 1987 and 1990, respectively.
He is now a senior professor at the Faculty of Industrial Engineering, Institut Teknologi Bandung, Indonesia. He serves as the chairman of the Board of Professors of Institut Teknologi Bandung and also the president of Instrumentation Society of Indonesia. In recognition of his work, he was awarded as a senior professional engineer by Engineers Society of Indonesia in 1998.
Dr. Harijono is a member of Professional Engineers Commission of Engineering Physics, an active member of The Asia-Pacific Federation of Instrumentation and Control Societies (APFICS). He is also the member of IEEE, ISA and AIAA. His research interest includes adaptive control and signal processing.
Edi Leksono obtained his first engineering degree from the Department of Engineering
Physics, Institut Teknologi Bandung (ITB), Indonesia in 1983. He obtained his master of engineering degree from the Department of Control Engineering, Tokyo Institute of Technology, Japan, in 1990 and obtained his Ph.D. degree in Engineering from the Department of Electrical Engineering, Keio University, Japan in 1998.
He has been working as a faculty member of the Department of Engineering Physics, Institut Teknologi Bandung (ITB), since 1983. He is a member of Indonesia Instrumentation Association, IEEE, and also ASME. He was the head of Engineering Physics Research Group of ITB from 2008- 2013 and has been appointed as the head of Energy Management Laboratory of ITB since 2008.
He has involved in energy system related research activities especially in battery management system (BMS) as part of national electric vehicle research project of ITB, and also has involved in fuel cell control system development for energy back up as well as for smart micro grid applications.
Wiseto P. Agung obtained his first engineering degree from the Department of Electrical
Engineering, Institut Teknologi Bandung (ITB), Indonesia in 1987. He obtained his master of science degree in telematics from University of Surrey, UK in 1994 and obtained his Ph.D. degree in multimedia communication from University of Surrey, UK in 2002.