VTMine Framework as Applied to Process Mining
Modeling
Sergey Andreevich Shershakov
*International Laboratory of Process-Aware Information System (PAIS Lab), National Research University Higher School of Economics, 20 Myasnitskaya str., Moscow 101000, Russia.
* Corresponding author. Tel.: +7495772-95-90; email: [email protected] Manuscript submitted August 10, 2014; accepted January 13, 2015.
doi: 10.17706/ijcce.2015.4.3.166-179
Abstract: Process mining is a research area dealing with inter alia, the construction of models of various types from event logs. Fuzzy maps are an example of such models produced by different process mining tools, such as ProM and Disco. We proposed a new approach to mining fuzzy models which is based on logs representation in the form of relation databases. Fast and effective SQL queries to such logs are made as a part of a DPMine workflow model. Resulting datasets are processed and visualized by a special DPMine component working tightly integrated with VTMine modeling framework. The paper discusses the suggested approach in the context of customization aspects of VTMine framework with an embedded DPM engine.
Key words: Extensible tool, process mining, workflow modeling language.
1.
Introduction
The research and practical purpose of the process mining discipline is closely related to extraction of process models from data located in event logs [1]. Process mining is largely applied to business processes and management [2], telecommunications, software [3], electronics, technological processes [4], touristic booking systems [5], healthcare management [6], municipal administration, and many other systems. The Process Mining Manifesto released by the IEEE Task Force on Process Mining [7] in 2011 is supported by more than 50 organizations, more than 70 experts contributed to it.
There are a number of process mining tools, both on a free and commercial basis. One of these tools is ProM [8], which has more than 600 plug-ins and is widely referred to as a research workbench. Another well-known process mining tool is Disco. Disco is based on the fuzzy miner which was initially implemented in ProM [9].
In this paper we consider mining process models in the form of fuzzy maps. This kind of models is often used and can be produced by Disco and ProM tool. We propose a different approach based on creating fast-executed SQL-based queries operating with logs represented in the form of a normalized database. Such queries result in datasets we process and visualize by using the DPMine workflow engine [10]-[12] operated as a set of plug-ins used for VTMine host modeling system [13].
building of an experiment model for mining fuzzy maps with VTMine and DPMine is presented in Section 5. Finally, Section 6 concludes the paper and a gives a look at the future.
2.
VTMine Framework
VTMine is a modular framework extensible by plug-ins. Plug-ins allow the customizing the core functionality in a wide range. Specialization of the framework is related to process modeling, workflow, and process mining areas. One of the key features of VTMine is mathematical models (graphs and Petri nets) that are widely spread in the process mining discipline.
VTMine/C’s target is to provide a fitting environment for additional plug-ins. From the users’ point of view, interaction with the plug-ins happens through menus, toolbars, instrumental panels and general purpose control containers. The latter are used for representing complex components such as a graph editor.
Basically, the users work with a set of resources by using routines for processing them. The user can also manage resources through projects and project groups. The plug-ins register controls to grant the user with access to the resources’ functionality. The main tasks include creating, editing, (re) storing resources, and transforming them from one to another by using various transformation algorithms.
2.1.
Plug-in Manager
Plug-in manager is a central module of the core platform. It is responsible for loading plug-ins. Each plug-in is located in a special directory.
If plug-in A is dependent on plug-in B version N, it means that A cannot be loaded before the loading of plug-in B version N has been performed. In the case of circular dependencies between two plug-ins (A and
B), no one of them is loaded. This is because it is impossible for Plugin manager to determine which one should be loaded first.
2.2.
Resources
A resource is a typed envelop for data being processed and transformed by VTMine plug-ins. The type of
resource is registered in Resource Manager by a plug-in that introduces such kind of resources to the framework. For example, there is a plug-in registering a “Petri net” resource type. Often, the same plug-in registers not only new resource types but also additional components for working with the resources of that type. In the example above, the plug-in can also register an editor for Petri nets.
Some kinds of resources have a file representation and one or more filename extensions in order for the framework to be able to determine resource types of the imported files. The resources are objects that can be created, copied, deleted either by the user or any other framework component. For example, resources can be produced and processed by plug-ins.
Each resource can be associated with some so-called resource doer objects. A resource doer is a special object which can perform some operations with given resources. Resource doers are exported to the core platform by plug-ins. For example, a resource doer for a Petri net can open a Petri net editor, whereas another resource doer can perform some verification procedure with the Petri net. The users eventually always work with resource doer objects. Access to the resource doer’s functionality is performed through UI controls.
2.3.
Views and Perspectives
special form of document).
A perspective is a named customized set of visual controls including menus, toolbars, tool panels, and containers for custom controls. A perspective aggregates visual controls with a view to providing users with necessary tools or controls for managing some kinds of resources or to perform specific tasks.
Switching of perspectives leads to a change in the number of menus, toolbars and panels. Main perspective is always enabled in the core platform. It stores a minimal set of controls so that the program remains manageable. It contains, for example, such controls as a menu which is responsible for switching between perspectives or exit.
Every view has a default perspective associated with it depending on the type of present resources. Nevertheless, it is possible to switching to other perspective, which allows applying different sets of tools and avoiding any mess.
2.4.
Integration with DPMine
One of the main VTMine’s purposes is to be a host application for DPMine/C library. The latter is integrated with VTMine as a set of plug-ins (further referred to as DPMine) that allows creating DPMine workflow models through DPMine/C library functions.
3.
DPMine Workflow Language and Plug-ins for VTMine
Today there is a wide variety of workflow notations. Some of them have a formal basis (such as Petri nets, finite state automata), others have vendor specific notations. Typically, workflow management systems are used for maintaining various kinds of business processes. DPMine is not another business process management (BPM) system. We rather call DPMine as a “technical workflow language”.
In the context of process mining, DPMine gives ability to create a scientific workflow model that includes individual invocations of particular processing algorithms, cycles support, choice constructs and other controls of the execution thread.
3.1.
DPMine Model (DPModel)
The main work concept for DPMine toolset is the model, which represents some workflow model under experiment.
In the context of integrating DPMine engine to VTMine framework the DPMine model (DPModel) is represented as a resource containing all necessary information about the model such as model name, model author, and so on.
The most important object contained in the model is the so-called main scheme to be executed during the model execution procedure. VTMine DPModel resource type extends the standard DPModel definition by adding special project-related attributes.
A model resource can be serialized to an underlying XML-or JSON-based text file or deserialized from it. One can extend the serialization mechanism to utilize any other storage formats (for more details see Section 5.5).
DPModel can be created and edited by a visual model editor exported to VTMine by a special plug-in. Its ID is “ru.xidv.dpmine.base”.
3.2.
Schemes, Blocks, Ports, and Connectors
Implementation of the basic language semantics is done through the concept of schemes, blocks, ports and
connectors.
1) Block: it is a basic language building element considered as a solitary operation in an external
considered as statements in programming languages. Blocks can have different functionality such as performing a single task of a base platform (task blocks), representing complex schemes into single blocks (scheme blocks), implementing control workflow (control flow blocks) and so on.
Block types system is highly customizable. New block types can be easily added to the DPMine engine by
various plug-ins.
2) Port: it is an object belonging to a certain block and used for connection and data objects transfer to other ports. Ports transfer resources of a specific data type from one block to another. Depending on block type, they can be either custom or built-in.
3) Connector: it is an object connecting two blocks through their ports. Connectors have a link direction: a
connector (with its beginning) always connects an output port of a block with an input port of another one (with its end). One output port can be linked to several connectors, whereas one input port can have only one connector linked.
4) Scheme: it represents a number of interacting blocks connected with each other by connectors. The
schemes are the main mechanism of implementing abstraction, isolation and hierarchy of sub-processes.
3.3.
Model Execution
One of the main goals for constructing a DPMine model is its subsequent execution. Outcome results the executed model is the sum of results of its individual executed blocks. They are based on the subject domain of the task blocks contained in the model.
When considering the execution of a scheme one needs to mention the execution concept for an individual block. Block execution is an operation done by the underlying block’s type class method execute()
based on the block’s individual state. While being executed blocks of certain types can take resources from their input ports, process them, and put newly created resources onto their output ports. Thus, in order for a given block to be able to be executed it is necessary that all the external dependencies of the block be satisfied.
Model Executor is another important component of the executing subsystem. It is a special agent (working
either as a part of a visual model editor or as a single resource doer) linking a DPMine workflow model and VTMine framework together.
3.4.
Visual Model Editor
One of the important parts of the DPMine plug-ins set is a visual model editor which is actually one of
resource doer forms. By applying such a doer for an existing model, the framework creates a new view and
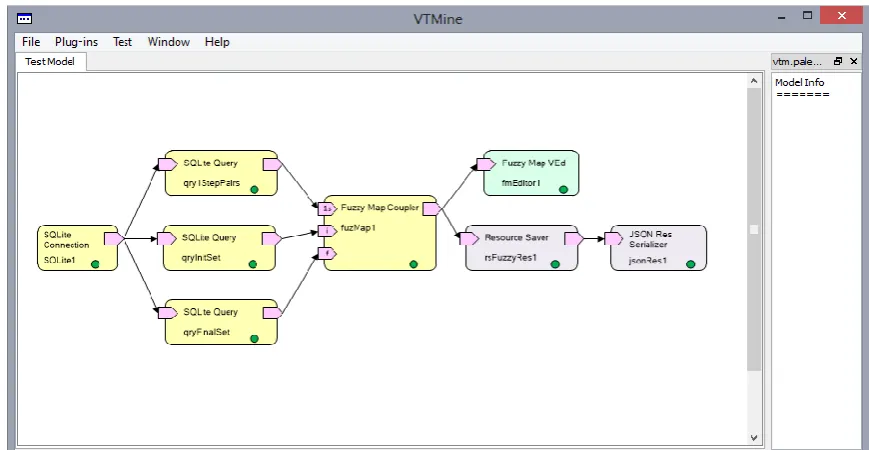
shows it in the current window (see Fig. 1). The visual model editor is based on Qt Graphics view framework. Like many other DPMine components the visual model editor is also customizable by means of an extendable system of custom block renderers. It is similar to the one used by a graph editor discussed in more detail in Section 5.4.
4.
Preparing Datasets for Fuzzy Models Based on RDBMS Logs
4.1.
Using RDBMS for Preparing Logs
Event logs may appear in different formats. One of the most known is XES format which has also become a standard for log representation in Process Mining world. Besides its advantages, XES format has some significant limitations basically related to representation of a big amount of data and their processing.
In fact, there are a lot of approaches for effective working with big amounts of data. One of such approaches is to use a relational database management system (RDBMS) that allows manipulating effectively with hundreds of thousands and even millions of records within a reasonable time lapse.
We decided to use RDBMS as log representation also because it provides the possibility to make various data views for different types of analysis depending on each specific aspect. Views allow looking at data from different points taking into account different aspects of data such as control flow ones, various types of data aspects and so on.
Creating a view on data involves two operations. First, projection of a data set (that could be a regular table as well as a joint of a number of tables) performs selecting only a particular subset of all attributes (table columns) that correspond to specific aspects. Second, filtering of the dataset provides only those records (table rows) which match some selection criteria.
We perform such operations by creating appropriate SQL queries including both projection and filtering clauses. Thus, using SELECT clause allows obtaining a desirable data projection on a specific aspect in a very natural way just by pointing all the necessary attributes out. Using WHERE clause gives a filtered subset of events by specifying arbitrary filtering criteria. We also use other standard SQL clauses like ORDER BY and GROUP BY to perform sorting and grouping (with using statistical functions), respectively. Finally, we use JOIN clause for joining linked tables together in a single view.
In Section 4.2 we show how to use JOIN clause in an unusual way — for obtaining a Cartesian square product of a view, which produces resulting relations between each pair of events of all cases. These relations are used to calculate metrics of reachability of events by other events.
We consider using SQLite, an embedded RDBMS, as a specific tool for such kind of works.
4.2.
Cartesian Products as a Base for Events Relations
Now we show how to use the Cartesian product for obtaining a view with correlations between each pair of events for every case in an event log.
We consider a log containing traces related to work of a GSM modem attached to some equipment and periodically (triggered by certain events of the equipment) making calls to the remote side for sending necessary information. Our goal is to make a model of interchange process in the form of a fuzzy map by using RDBMS approach. An event log is a collection of events where every individual event looks as follows (shown in Table 1).
Here we have three mandatory attributes from a process mining point of view: Case ID, Activity,
whereas Payload (which can also be more commonly named “Resource”) may be used for model analysis from data aspect.
Table 1. Event
Attribute Value
Case ID 93
Activity Call
Timestamp 1387494715779
Payload +78001234567
Case ID is a unique numeric ID of a calling session. Activity attribute represents an action and may be one
of the following (simplified example): Initialization, Call, Handshake, Send Data, Receive Data, and Hang Up.
Timestamp is represented in the form of the standard Unix timestamp. We can use absolute time values to
determine how much time it takes to finish every specific event and also analyze some time-based metrics. For example, we can conduct performance analysis by observing the most time consuming actions and thereby detect so-called “bottlenecks”.
Nevertheless, we have to “discretize” absolute timestamps so that every event in every specific case obtained an ordinal number corresponding to its relative position on the timeline. We refer to such a number as EventSeqNum attribute. In Table 2 we show an example of such discretization.
Further, we are interested only in relative positions so we only consider EventSeqNum attribute as a discrete timestamp. There is a fragment of an event log given in Table 3. This event log is represented as a single SQLite table Events. We use it to make a desirable model.
Table 2. Timestamp “Discretization”
Case ID Timestamp EventSeqNum
93 1387494715779 313
93 1387494716594 314
93 1387494718605 315
93 1387494723606 316
93 1387494724726 317
Table 3. Event Log
Case ID Activity EventSeqNum
93 Initialization (I) 313
93 Call (C) 314
93 Handshake (H) 315
93 Send data (S) 316
93 Receive Data (R) 317
93 Hang Up (U) 318
94 Initialization (I) 319
94 Call (C) 320
94 Handshake (H) 321
94 Receive Data (R) 322
94 Send data (S) 323
94 Hang Up (U) 324
95 Initialization (I) 325
95 Call (C) 326
95 Handshake (H) 327
Thus, here we have three observed traces:
93: I C H S R U / 94: I C H R S U / 95: I C H U
To create a set of relations between all event pairs we make a Cartesian square product of Events table by adding additional INNER JOIN clause to an SQL query (Fig. 2 without WHERE clause).
Fig. 2. Filtering Cartesian products to obtain 1-step event pairs only.
We use Case ID attribute to bind two parts of the resulting view as we are interested only in the relations between events within every individual case. As a result we obtain a view containing 88 records. Attribute
SeqDelta is calculated as a difference between relative positions of two events (in every joint record) in a
(same) case and designates the number of “steps” between two events in each pair.
Further, we are interested only in those pairs with metric SeqDelta equal 1 where the first event is directly followed by the second event. For this very purpose we add WHERE clause to the query (Fig. 2). The resulting dataset contains 13 records and is shown in Table 4.
Now we obtain a set of 1-step transitions between all pairs of events without respect to cases and calculate the amount of such pairs. For reasons of convenience we create a technical view (as a SQLite object) Fol1Step from the query on Fig. 2.
The resulting dataset is presented in Table 5. We can consider this dataset as an adjacency table for a graph representing a fuzzy map of the log. There, activities are vertices of the graph, pairs “Activity 1 — Activity 2”represent directed edges with a weight on each of them that equals the number of occurrences of such a relation that we calculated as PairFreq metric (Fig. 3).
Table 4. Cartesian Product of Event Log with Pairs of Events Having 1-Step SeqDelta Metric
Event 1 Event 2
Seq Delta
Case ID
Activity Event
Seq Num
Case ID_1
Activity_1 Event
Seq Num_1
1 93 Init 313 93 Call 314
1 93 Call 314 93 Handsh 315
1 93 Handsh 315 93 Send 316
1 93 Send 316 93 Receive 317
1 93 Receive 317 93 HangUp 318
1 94 Init 319 94 Call 320
1 94 Call 320 94 Handsh 321
1 94 Handsh 321 94 Receive 322
1 94 Receive 322 94 Send 323
1 94 Send 323 94 HangUp 324
1 95 Init 325 95 Call 326
1 95 Call 326 95 Handsh 327
Table 5. Set of 1-Step Transitions between All Event Pairs
Activity 1 Activity 2 PairFreq
Call Handshake 3
Handshake HangUp 1
Handshake Receive 1
Handshake Send 1
Init Call 3
Receive HangUp 1
Receive Send 1
Send HangUp 1
Send Receive 1
Fig. 3. Query for obtaining a set of 1-step transitions between all event pairs.
Fig. 4. Fuzzy map constructed from the dataset in Table 6.
A fuzzy map constructed from the dataset presented in Table 5 is depicted on Fig. 4.
Finally, to determine a set of initial and a set of final activities we have to distinguish vertices that are unique only for Activity 1 column (initial) and that are unique only for Activity 2 column (final). These activities have additional relations designated on Fig. 4 by dashed arcs. We use two additional queries for this very purpose. One of such queries for initial vertices is presented on Fig. 5 (the other is similar).
Fig. 5. Query for obtaining a set of initial vertices.
5.
DPMine Workflow Model for Mining Fuzzy Maps
Now our goal is to make an experiment model including some interactions with a SQLite based log that gives intermediate datasets, visualizing them as a fuzzy map and simultaneously saving it as a file resource.
Init
Call
Handsh
Receive
HangUp
3 3
1 1
1
1
Send
1 1
This way we create some DPMine “block” components, load them as VTMine framework plug-ins having corresponding relations between each other. Finally, we create an experiment model and execute it.
5.1.
SQLite Supporting Blocks
The first plug-in we are looking at contains some blocks for supporting SQLite databases. Its ID is “ru.xidv.dpmine.sqlitebase”.
The plug-in contains an embedded library for manipulations with SQLite file-based databases and exports to VTMine some interfaces in the form of individual blocks. Here, we are primarily focusing on two types of blocks. They are “SQLite Connection” and “SQLite Query”.
“SQLite Connection” block (Fig. 6(a)) introduces into the model an instance of connection to a SQLite database. It contains a set of parameters that are needed to establish such a connection like a path to a database file, database encoding, and other technical parameters declared by SQLite API.
Note that there are several varieties of “SQLite Connection” blocks that differ from each other in existence of input ports for passing some of parameters above. So, there is a variety where all the parameters are edited only through “block settings” dialog box (or directly through corresponding sections of the model file) and the block does not have any input ports. Another variety has an input port for passing the database file path obtained from the previous block. It could make sense in cases where the path is formed at previous stages of the model execution.
“SQLite Query” blocks (Fig. 6(b)) was used to make SQL queries for a linked database and obtain results of the queries at its output port. The same way as with “SQLite Connection” blocks, “SQLite Query” has several varieties with different numbers of input ports. Every variety has at least one input port used to make a link to a “SQLite Connection” block providing such a connection. Text of the query can be assigned to the “SQLite Query” block either by editing its settings or through one of its input port.
Fig. 6. “SQLite Connection” (a) and “SQLite Query” (b) blocks.
During its execution “SQLite Connection” block attempts preparing and executing the query and presents the results of its execution at its “DataSet” output port. This port transmits a resource (of a special type) that implements IDataSet interface. The latter is a standard interface which encapsulates any object that can provide sequential access to a 2-dimensional set of data record by record. It also declares some methods of getting additional information such as number of records, fetching policies and other.
One of the most significant sorts of information provided by IDataSet interface is the state of a dataset. It could take one of the values that determine success or failure of query execution. In the fail case, we have two options of how “SQLite Query” has to process it.
The first means if query execution fails the block has to be switched to “broken” state that implies the branch of model handling data expected from the “broken” block will remain unexecuted. It also leads to the model execution stopped due to inability of resolving some of dependencies and several blocks obtaining
“canceled” states. It makes sense to stipulate such behavior for models which are strictly based on having
certain datasets obtained.
The other option declares ability to continue execution of the model even if some datasets are not fully obtained but the blocks depending on them can correctly process this case.
For our example we have to create a model with three instances of “SQLite Query” blocks directly connected to a “SQLite Connection” block (Fig. 7) providing an access to a log database. The first query
provides a dataset of 1-step transitions between all pairs of events (Fig. 3), the other two are for providing sets of initial (Fig. 5) and final activities.
Fig. 7. Screenshot of an experiment model.
Having all these blocks executed we may connect the resulting datasets for components interpreting them in a way to make a graphical representation of a fuzzy map.
5.2.
Fuzzy Map (De) Coupling Blocks
There is a set of blocks used for coupling/decoupling datasets, visualizing them as fuzzy maps, and storing them as a fuzzy map resource. All these blocks are provided by a plug-in with “ru.xidv.dpmine.fuzzymap” ID.
5.3.
Fuzzy Map (De) Coupling Blocks
There is a set of blocks used for coupling/decoupling datasets, visualizing them as fuzzy maps, and storing them as a fuzzy map resource. All these blocks are provided by a plug-in with “ru.xidv.dpmine.fuzzymap” ID.
The first block we consider is a coupling “Fuzzy Map Coupler” block (Fig. 8(a)) puts together datasets given at its input as a single resource implementing IFuzzyMap interface. The only one input port is obligatory and used to receive a 1-step pairs dataset, whereas the other two — for providing initial and final vertices — are optional.
Fig. 8. “SQLite Coupler” (a) and “Fuzzy Map Visualizer” (b) blocks.
As it was mentioned in Section 4.2 the fuzzy map is represented as a graph containing activities as vertices and relations between them as arcs. Thereby, the output resource produced by executed “Fuzzy Map Coupler” is a graph determined by an adjacency list constructed basically from the vertices and relation flows from the first (1-step pairs) dataset. This list is appended by additional relations from an artificial “start” vertex to vertices from the initial set of activities, and relations vertices from the final set of activities to an artificial “stop” vertex.
5.4.
Fuzzy Map Visualization
One of the most complex components of the model is “Fuzzy Map Visualizer” block (Fig. 8(b)) provides a graphical notation of fuzzy maps. Since the fuzzy map is just a special form of regular graph, we use a graph visual editor working with a restricted mode to visualize fuzzy maps.
Graph visual editor is a special “Visual Graph Editor” block exported by “ru.xidv.vtmine.graphs” plug-in. It contains a kernel graphical component of the same name also based on Qt Graphics View Framework, the component being rather customizable.
Visual Graph Editor component (do not mix it with “Visual Graph Editor” block) is initialized at the stage
of loading “ru.xidv.vtmine.graphs” plug-in and it can be customized by any other plug-ins depending on “ru.xidv.vtmine.graphs” plug-in later (since such plug-ins can be loaded strictly after all their dependencies). For instance, Visual Graph Editor component us notation of so-called “renderers” that paint all graphs’ elements such as vertices and arcs. Each renderer represents a special component (IGraphRenderer
interface) containing some rendering methods. Such a method, e.g. for painting some vertex of a graph, takes at its input a Graph Vertex object containing superimposed data through a virtual polymorphic object. These data are being cast to an expected type and in case of success the renderer creates a special
QGraphicsItem-inherited object that is then placed on a scene represented by QGraphicsScene descendant.
“ru.xidv.dpmine.fuzzymap” plug-in does customize Visual Graph Editor component in the introduced way. It creates a special renderer “ru.xidv.dpmine.fuzzymap.graph.renderer.default” and appends it to a list of custom renderers of Visual Graph Editor component. “Visual Graph Editor” block uses Visual Graph Editor
component and also looks at a special list of renderers assigned to be used with that component (the list can be further customized by other plug-ins adding other fuzzy map renderers and thereby supporting look-and-feel paradigm). There is a default renderer, and it is also possible to select any other appropriate renderer.
Finally, “Visual Graph Editor” block works like an ordinary “Visual Graph Editor” block. At the execution stage it checks whether all the necessary data are at its input port and switches to executed state. Then, when the user performs a default action with the block (double clicking at a block instance or using its context menu) a new Framework View with a graph editor is created and added to the current Views Set of the current window.
5.5.
Saving Fuzzy Map as a Resource
To make our model a bit more complete we add an additional link between the produced fuzzy map and the resource storage subsystem. Each block in a DPMine model may produce, inter alia, objects represented in VTMine as resources (see also Section 3.1).
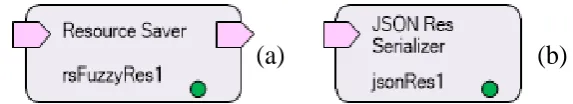
The lifetime of every resource produced by DPMine during the execution of a model is managed by the block that produced it. Normally, such resources are deleted after the model itself has been deleted or, e.g., at every new execution during the reset stage. We introduce ability for saving and managing such resources in a special resource manager by presenting a special “Resource Saver” block (Fig. (9a)). The block has an input port “res” on which the block expects presence of an object that implements special
IPersistentResource interface. Not all the resources may appear as persistent, e.g. can be serialized and deserialized.
When “Resource Saver” block is executed it attempts to extract an IPersistentResource object and in the case of success this resource is registered with the resource manager and can been further used independently.
Fig. 9. “Resource Saver” (a) and “JSON Resource Serializer” (b) blocks.
The main idea here is that we have a two-dimensional table (Table 6) in which there are storage formats in one dimension and resource types in the other. In the cells of the table we have a pointer to a special “saver” object (an implementer of a special IResSaver interface) that performs (de)serialization. If no saver for a combination “format — resource type” is assigned, it is impossible to perform such operations for this very combination. There is a similar approach for loader interface.
Table 6. Resource Types/Formats Customizers
Res \ Format XML JSON …
Graph ResSaver1 ResSaver1 …
Petri Net ResSaver1 ResSaver2 …
Fuzzy Map ResSaver3 ResSaver3 …
… … … …
Such a complex paradigm is obviously used to make the (de) serialization subsystem as flexible as possible. Thus, every plug-in can easily extend the subsystem just by adding an appropriate saver/loader for any desirable format and resource type.
Coming back to our case, there are two possible options how to save a mined fuzzy map resource. The first is to connect an “X Resource Serialization” block directly to a “Fuzzy Map Coupler” block. The second option implies a sequence of connections of a “Fuzzy Map Coupler” block to a “Resource Saver” block and later to an “X Resource Serialization” block. In this case an additional connection between an internal resource and its persistent representation (file) will be established.
6.
Conclusion
This paper presents one more technique for obtaining fuzzy maps models, which is based on a very fast RDBMS approach to preparing intermediate datasets and implemented as a set of VTMine modeling framework plug-ins. The fuzzy maps notation for logs representation is well-known, easy understandable and wide-spread, so it was selected to demonstrate some of the aspects of the architecture of VTMine framework and DPMine modeling system.
The main idea is that all involved components should be loosely coupled and highly customizable by means of a system of interrelated plug-ins.
In a short-term perspective we plan to finish the project management subsystem. The existing subsystems should be greatly improved.
Acknowledgment
The implementation of the study in the framework of the Basic Research Program at the National Research University Higher School of Economics (HSE) is gratefully acknowledged.
References
[1] Aalst, W. M. P. van der (2011). Process Mining — Discovery, Conformance and Enhancement of Business
Processes. Berlin, Heidelberg: Springer-Verlag.
[2] Mitsyuk, A., Kalenkova, A., Shershakov, S. A., & Aalst, W. M. P. van der (2014). Using process mining for
the analysis of an e-trade system: A case study. Business Informatics, 29(3).
[3] Rubin, V., Lomazova, I. A., & Aalst, W. M. P. van der (2014). Agile development with software process mining, Proceedings of the 2014 International Conference on Software and System Process (pp. 70-74). New York: ACM.
[4] Rozinat, A., Jong, I. S. M. de, Günther, C. W., & Aalst, W. M. P. van der (2007). Process Mining of Test
Processes: A Case Study. Eindhoven University of Technology, Eindhoven, the Netherlands.
[5] Rubin, V., Mitsyuk, A. A., Lomazova, I. A., & Aalst, W. M. P. van der (2014). Process mining can be applied to software too! Proceedings of the 8th ACM/IEEE International Symposium on Empirical Software
Engineering and Measurement. New York: ACM.
[6] Mans, R., Aalst, W. M. P. van der, Vanwersch, R. J. B., & Moleman, A. J. (2012). Process mining in healthcare: Data challenges when answering frequently posed questions. Proceedings of the 2012
International Conference on Process Support and Knowledge Representation in Health Care (pp.
140-153). Berlin, Heidelberg: Springer-Verlag.
[7] Aalst, W. P. van der, Adriansyah, A., Alves de Medeiros, A. K., Arcieri, F., Baier, T., Blickle, T., et al. (2012). Process mining manifesto. In F. Daniel, S. Dustdar, & K. Barkaoui, (Eds.), Proceedings of theBPM 2011
Workshops, Part I: Vol. 99. LNBIP (pp. 169-194). Berlin, Heidelberg: Springer-Verlag.
[8] Verbeek, H. M. W., Buijs, J. C. A. M., Dongen, B. F. van, & Aalst, W. M. P. van der (2010). ProM 6: The process mining toolkit. In M. L. Rosa (Ed.), Proceedings of the BPM Demonstration Track: Vol. 615. CEUR
Workshop Proceedings (pp. 34-39).
[9] Günther, C. W., & Aalst, W. M. P. van der (2007). Fuzzy mining: Adaptive process simplification based on multi-perspective metrics. In G. Alonso, P. Dadam, & M. Rosemann (Eds.) Proceedings of the 5th
International Conference BPM 2007: Vol. 4714, LNICS (pp. 328-343). Berlin, Heidelberg: Springer-Verlag.
[10] Shershakov, S. A. (2013). DPMine: Modeling and process mining tool. In A. Kamkin, A. Petrenko, & A. Terekhov (Eds.), Proceedings of the 7th Spring/Summer Young Researchers’ Colloquium on Software
Engineering (SYRCoSE’13) (pp. 19-24). Kazan: ISPRAS.
[11] Shershakov, S. A. (2013). DPMine/P: Modeling and process mining language and ProM plug-ins. In N. Puntikov, A. N. Terekhov, & M. Tsepkov (Eds.), Proceedings of the 9th Central & Eastern European
Software Engineering Conference in Russia. New York: ACM New York.
[12] Shershakov, S. A. (2014). DPMine/C: C++ library and graphical frontend for DPMine workflow language. In A. Kamkin, A. Petrenko, & A. Terekhov (Eds.), Proceedings of the 8th Spring/Summer Young
Researchers’ Colloquium on Software Engineering (SYRCoSE’14). Saint Petersburg: ISPRAS.
[13] Kim, P., Bulanov, O., & Shershakov, S. A. (2014). Component-based VTMine/C framework: Not only modeling. In A. Kamkin, A. Petrenko, & A. Terekhov (Eds.), Proceedings of the 8th Spring/Summer Young
Researchers’ Colloquium on Software Engineering (SYRCoSE’14). Saint Petersburg: ISPRAS.
Sergey A. Shershakov was born in Moscow, Russia. He obtained his MSc degree in software engineering form the National Research University Higher School of Economics in 2012 in Moscow, Russia. Previously he obtained his graduate engineer’s degree in computers, complexes, systems and networks in 2008 and BSc degree in informatics and computer engineering in 2007 from Moscow Technical University of Communications and Informatics.
of Process-Aware Information Systems and as a lecturer at the Software Development Management Department of the Higher School of Economics in Moscow. In 2013 he had an internship at the Technical University of Eindhoven, the Netherlands. His publications cover a number of research interests such as digital HF electronics, software verification and architectures, and process mining. The following is one of his publications: Mitsyuk, A., Nkova, A. K., Shershakov, S., & van der Aalst, W. (2014). Using process mining for the analysis of an e-trade system: A case study. Business Informatics, 3(29).