Early selection of sugarcane using path analysis
R.P. Barbosa1, F. Alcântara Neto1, L.M. Gravina2, G.A. Gravina2,
M.G.T. Portela1 and A.A.C. Bezerra3
1Departamento de Fitotecnia, Universidade Federal do Piauí, Teresina, PI, Brasil 2Laboratório de Engenharia Agrícola,
Universidade Estadual do Norte Fluminense Darcy Ribeiro,
Centro de Ciências e Tecnologias Agropecuárias, Campos dos Goytacazes, RJ, Brasil
3Departamento de Planejamento e Política Agrícola, Universidade Federal do Piauí, Teresina, PI, Brasil
Corresponding author: G.A. Gravina E-mail: [email protected]
Genet. Mol. Res. 16 (1): gmr16019038 Received July 28, 2016
Accepted December 12, 2016 Published February 8, 2017
DOI http://dx.doi.org/10.4238/gmr16019038
Copyright © 2017 The Authors. This is an open-access article distributed under the terms of the Creative Commons Attribution ShareAlike (CC BY-SA) 4.0 License.
high in all path analyses, suggesting that the components evaluated explained a large part of the variation in stalk production and in the technological variables. Stalk diameter was the trait that best correlated with stalk dry matter yield at all timepoints, with positive values that were higher than the residual effect. This demonstrates the possibility of obtaining significant gains via indirect selection for stalk dry matter yield via stalk diameter or via stalk diameter and number of tillers. The technological variables degrees brix and juice pol were the traits that best correlated with total recoverable sugar production, indicating that they could be used to indirectly select for total recoverable sugar.
Key words:Saccharum officinarum L.; Relationship between traits; Indirect selection
INTRODUCTION
The study of relationships between variables is necessary to measure the existence and/or intensity of interactions between traits. In general, these relationships are evaluated through correlations that, in plant breeding for instance, are important, because correlations between traits allow for selection based on a single trait to result in simultaneous changes in one or more characters of agronomic importance. Consequently, many breeding programs use correlations. Correlation analysis allows the breeder to evaluate the degree of association between two traits and the practical viability of indirect selection, which, in some cases, may lead to more rapid progress than direct selection (Cruz et al., 2006; Ferreira et al., 2007).
The correlations evaluated in plant breeding can be of a phenotypic, genotypic, or environmental nature. Phenotypic correlations have genetic and environmental causes, but only genetic causes are heritable and used in breeding programs (Cruz et al., 2004; Esposito et al., 2012). However, despite being an easily obtained statistical parameter, the magnitude of a correlation must be interpreted carefully, because this process is complicated by its significance, the importance of the traits, the effect of two or more traits, and the influence of the environment on their expression (Falconer and Mackay, 1996).
Path analysis can distinguish between the direct and indirect effects of variables that influence a basic or main variable of greater interest (Cruz et al., 2006). The technique, introduced by Wright (1921, 1923) and described in detail by Li (1956, 1975), identifies miscorrelations between two traits that may not necessarily be related by direct cause-and-effect, because of the influence of a third trait. Path analysis has been widely used by plant breeders in a variety of crops, e.g., soybean (Peter et al., 2014), corn (Faria et al., 2015), common bean (Cabral et al., 2011), green bean (Araujo et al., 2012), cowpea (Moura et al., 2012; Santos et al., 2014), rice (Marchezan et al., 2005), wheat (Kavalco et al., 2014), cotton (Hoogerheide et al., 2007; Farias et al., 2016), sweet sorghum (Lombardi et al., 2015), and sugarcane (Saccharum officinarum) (Kang et al., 1983; Reddy and Reddy, 1986; Sukhchain and Sain, 1997; Ferreira et al., 2007; Silva et al., 2009; Souza et al., 2011; Esposito et al., 2012). However, studies of this nature are still necessary, because different population structures, environments, and management strategies should be considered.
these genotypes and indicate their most suitable traits, which would be indispensable when performing indirect selection on sugarcane because it reduces the amount of work necessary when assessing a large number of genotypes in the initial stages of a breeding program.
In view of the above considerations, and given the need for honing the process of selection of promising genotypes in sugarcane breeding programs, the present study was conducted to quantify, by path analysis, the direct and indirect effects of production components on the yield of stalks per hectare, and of technological variables on the total recoverable sugar (TRS) at six data collection periods.
MATERIAL AND METHODS
The experiment was conducted on June 7, 2013, at Companhia Vale do Parnaíba alcohol and sugar mill that belongs to the Olho D’água group, which is in União, PI, Brazil (04°52'09''S, 42°52'45''W, 67 m above mean sea level). According to Thornthwaite and Mather (1955), the climate of the region is classified as dry sub-humid, with a moderate water surplus in the summer and a water shortage from July to December.
A randomized block design with four replications was adopted, and included 12 sugarcane genotypes (RB036066, RB9438, RB935744, RB021764, RB021754, RB021534, RB966229, RB977540, RB863129, and RB987935, and the varieties RB92579 and RB867515 as controls) obtained from the sugarcane breeding programs of the Inter-University Network for the Development of Sugar and Alcohol Sector (Rede Interuniversitária para o Desenvolvimento do Setor Sucroalcooleiro, RIDESA).
The plot was composed of two 5-m furrows spaced 1.4 m apart. Each linear meter of furrow received six sugarcane cuttings with three buds each (totaling 18 buds per linear meter). Base fertilization was based on a chemical analysis of the soil (Table 1), and consisted of 500 kg/ ha of 06-28-22 (N, P and K, respectively) formulation that was applied in the planting furrow.
BS, base saturation; AlS, aluminum saturation.
Table 1. Chemical characteristics of the soil in the experimental area.
Depth (m) pH (CaCl2) P (Mehlich) K Ca Mg Al H+Al AlS BS mg/dm3 Cmolc/dm3 %
0.00-0.20 7.0 94.3 0.59 2.14 0.99 0.0 0.47 0.0 88.80 0.20-0.40 7.0 100.2 0.53 2.34 0.86 0.0 0.49 0.0 88.30 0.40-0.60 6.9 100.3 0.52 2.39 0.84 0.0 0.50 0.0 88.20
Initially, analysis of variance was performed for each environment (collection time) separately, and the homogeneity of the residual variance was checked. Later, a combined analysis of variance was performed that included progeny and environment as random terms, and subsequently, genotypic and phenotypic correlations were estimated.
The degree of multicollinearity of a X'X correlation matrix was established based on its condition number (CN), which is the ratio between the highest and lowest eigenvalue of the matrix (Montgomery and Peck, 1981) and indicates weak multicollinearity between explanatory variables if the ratio between the highest and lowest eigenvalue is equal to or lower than 100. If the CN is 100-1000, multicollinearity is considered moderate to severe, and if CN ≥ 1000, it is considered severe (Moura et al., 2012).
After the establishment of the basic path analysis equations, the resolution in matrix form was obtained according to the equation X'Xβ = X'Y, where X'X is a nonsingular matrix of correlations between the primary variables, β is the path coefficient vector column, and X'Y is the column vector of correlations between the explanatory variables and the dependent variable (Santos et al., 2014).
The following conditions were considered for the path analysis: i) SDM was the main variable and the production variables (NGL, NT, SL, IL, and SD) were explanatory variables; ii) TRS was the main variable and the technological variables [Brix, fiber, purity, juice pol, reducing sugar (RS), TPH, and tons of sugarcane per hectare] were explanatory variables. All of the analyses were performed using the GENES software (http://www.ufv.br/dbg/genes/genes.htm).
RESULTS AND DISCUSSION
Preliminary analyses confirmed the normality of the data and homogeneity of the variance of the experimental error, allowing the inclusion of the six periods of evaluation in a combined analysis. Significant differences were found for all of the traits evaluated. Good experimental precision was observed for most traits, with coefficients of variation lower than 20%. The CN values were lower than 100, except at 120 days of age for the production variables, for which a path analysis under multicollinearity was performed. After this procedure, the highest variance inflation factor was 6.11, using a K value of 0.2069. For the other periods evaluated, multicollinearity was classified as weak. Therefore, the path analyses were performed without the need for more complex statistical approaches. In addition, the high coefficients of determination of the path models (greater than 0.83) supported the use of this technique (Tables 2 and 3).
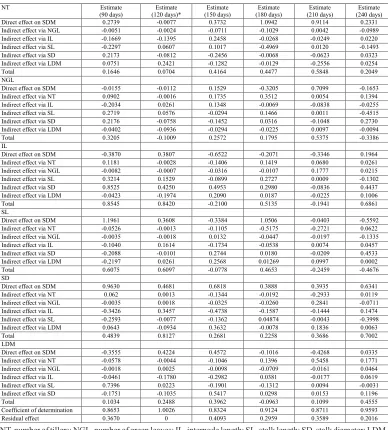
The genotypic correlations among the six independent variables and the dependent or main variable, as well as a decomposition of the genotypic correlations into components of direct and indirect effects on the dependent or main variable (SDM) and the independent explanatory variables for production traits, are described in Table 2 for each timepoint. The strongest genotypic correlations between the explanatory variables and the main variable were obtained for SD, IL, and SL at most of the timepoints. Considering only the correlation coefficients, SD, IL, and SL were the most important production components in the determination of SDM.
Table 2. Decomposition of genotypic correlations into components of direct and indirect effects involving the main dependent variable (stalk dry matter, SDM) and independent, production explanatory variables in 12 sugarcane genotypes at six timepoints.
NT Estimate
(90 days) (120 days)* Estimate (150 days) Estimate (180 days) Estimate (210 days) Estimate (240 days) Estimate Direct effect on SDM 0.2739 -0.0077 0.3732 1.0942 0.9114 0.2331 Indirect effect via NGL -0.0051 -0.0024 -0.0711 -0.1029 0.0042 -0.0989 Indirect effect via IL -0.1669 -0.1395 0.2458 -0.0268 -0.0249 0.0220 Indirect effect via SL -0.2297 0.0607 0.1017 -0.4969 0.0120 -0.1493 Indirect effect via SD 0.2173 -0.0812 -0.2456 -0.0068 -0.0623 0.0323 Indirect effect via LDM 0.0751 0.2421 -0.1282 -0.0129 -0.2556 0.0254 Total 0.1646 0.0704 0.4164 0.4477 0.5848 0.2049 NGL
Direct effect on SDM -0.0155 -0.0112 0.1529 -0.3205 0.7099 -0.1653 Indirect effect via NT 0.0902 -0.0016 0.1735 0.3512 0.0054 0.1394 Indirect effect via IL -0.2034 0.0261 0.1348 -0.0069 -0.0838 -0.0255 Indirect effect via SL 0.2719 0.0576 -0.0294 0.1466 0.0011 -0.4515 Indirect effect via SD 0.2176 -0.0758 -0.1452 0.0316 -0.1048 0.2730 Indirect effect via LDM -0.0402 -0.0936 -0.0294 -0.0225 0.0097 -0.0094 Total 0.3205 -0.1009 0.2572 0.1795 0.5375 -0.3386 IL
Direct effect on SDM -0.3870 0.3807 -0.6522 -0.2071 -0.3346 0.1964 Indirect effect via NT 0.1181 -0.0028 -0.1406 0.1419 0.0680 0.0261 Indirect effect via NGL -0.0082 -0.0007 -0.0316 -0.0107 0.1777 0.0215 Indirect effect via SL 0.3214 0.1529 -0.0899 0.2727 0.0009 -0.1302 Indirect effect via SD 0.8525 0.4250 0.4953 0.2980 -0.0836 0.4437 Indirect effect via LDM -0.0423 -0.1974 0.2090 0.0187 -0.0225 0.1006 Total 0.8545 0.8420 -0.2100 0.5135 -0.1941 0.6861 SL
Direct effect on SDM 1.1961 0.3608 -0.3384 1.0506 -0.0403 -0.5592 Indirect effect via NT -0.0526 -0.0013 -0.1105 -0.5175 -0.2721 0.0622 Indirect effect via NGL -0.0035 -0.0018 0.0132 -0.0447 -0.0197 -0.1335 Indirect effect via IL -0.1040 0.1614 -0.1734 -0.0538 0.0074 0.0457 Indirect effect via SD -0.2088 -0.0101 0.2744 0.0180 -0.0209 0.4533 Indirect effect via LDM -0.2197 0.0261 0.2568 0.01269 0.0997 0.0002 Total 0.6075 0.6097 -0.0778 0.4653 -0.2459 -0.4676 SD
Direct effect on SDM 0.9630 0.4681 0.6818 0.3888 0.3935 0.6341 Indirect effect via NT 0.062 0.0013 -0.1344 -0.0192 -0.2933 0.0119 Indirect effect via NGL -0.0035 0.0018 -0.0325 -0.0260 0.2841 -0.0711 Indirect effect via IL -0.3426 0.3457 -0.4738 -0.1587 -0.1444 0.1474 Indirect effect via SL -0.2593 -0.0077 -0.1362 0.04874 -0.0043 -0.3998 Indirect effect via LDM 0.0643 -0.0934 0.3632 -0.0078 0.1836 0.0063 Total 0.4839 0.8127 0.2681 0.2258 0.3686 0.7002 LDM
Direct effect on SDM -0.3555 0.4224 0.4572 -0.1016 -0.4268 0.0335 Indirect effect via NT -0.0578 -0.0044 -0.1046 0.1396 0.5458 0.1771 Indirect effect via NGL -0.0018 0.0025 -0.0098 -0.0709 -0.0161 0.0464 Indirect effect via IL -0.0461 -0.1780 -0.2982 0.0381 -0.0177 0.0619 Indirect effect via SL 0.7396 0.0223 -0.1901 -0.1312 0.0094 -0.0031 Indirect effect via SD -0.1751 -0.1035 0.5417 0.0298 0.0153 0.1196 Total 0.1034 0.2488 0.3962 -0.0963 0.1099 0.4555 Coefficient of determination 0.8653 1.0026 0.8324 0.9124 0.8711 0.9593 Residual effect 0.3670 0 0.4093 0.2959 0.3589 0.2016 NT, number of tillers; NGL, number of green leaves; IL, internode length; SL, stalk length; SD, stalk diameter; LDM, leaf dry matter. *Path analysis with multicollinearity (highest variance inflation factor = 6.11; K value = 0.2069).
coefficients and reported a large contribution by SD, followed by the number of stalks, on sugarcane yield per hectare. The authors stated that genotypic path coefficients are important in choosing an effective selection criterion (Kang et al., 1983).
RS, reducing sugar. t, tonne. *Path analysis with multicollinearity (highest variance inflation factor =14.41; K value = 0.005638).
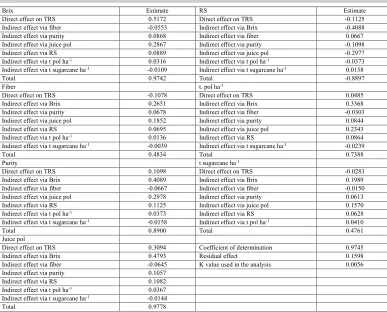
Table 3. Decomposition of genotypic correlations into components of direct and indirect effects involving the main dependent variable (total recoverable sugar, TRS) and independent, technological explanatory variables in 12 sugarcane genotypes at harvest*.
Brix Estimate RS Estimate
Direct effect on TRS 0.5172 Direct effect on TRS -0.1125 Indirect effect via fiber -0.0553 Indirect effect via Brix -0.4088 Indirect effect via purity 0.0868 Indirect effect via fiber 0.0667 Indirect effect via juice pol 0.2867 Indirect effect via purity -0.1098 Indirect effect via RS 0.0889 Indirect effect via juice pol -0.2977 Indirect effect via t pol ha-1 0.0316 Indirect effect via t pol ha-1 -0.0373 Indirect effect via t sugarcane ha-1 -0.0109 Indirect effect via t sugarcane ha-1 0.0158
Total 0.9742 Total -0.8897
Fiber t. pol ha-1
Direct effect on TRS -0.1078 Direct effect on TRS 0.0485 Indirect effect via Brix 0.2651 Indirect effect via Brix 0.3368 Indirect effect via purity 0.0678 Indirect effect via fiber -0.0303 Indirect effect via juice pol 0.1852 Indirect effect via purity 0.0844 Indirect effect via RS 0.0695 Indirect effect via juice pol 0.2343 Indirect effect via t pol ha-1 0.0136 Indirect effect via RS 0.0864 Indirect effect via t sugarcane ha-1 -0.0039 Indirect effect via t sugarcane ha-1 -0.0239
Total 0.4834 Total 0.7388
Purity t sugarcane ha-1
Direct effect on TRS 0.1098 Direct effect on TRS -0.0283 Indirect effect via Brix 0.4089 Indirect effect via Brix 0.1989 Indirect effect via fiber -0.0667 Indirect effect via fiber -0.0150 Indirect effect via juice pol 0.2978 Indirect effect via purity 0.0613 Indirect effect via RS 0.1125 Indirect effect via juice pol 0.1570 Indirect effect via t pol ha-1 0.0373 Indirect effect via RS 0.0628 Indirect effect via t sugarcane ha-1 -0.0158 Indirect effect via t pol ha-1 0.0410
Total 0.8900 Total 0.4761
Juice pol
Direct effect on TRS 0.3094 Coefficient of determination 0.9745 Indirect effect via Brix 0.4793 Residual effect 0.1598 Indirect effect via fiber -0.0645 K value used in the analysis 0.0056 Indirect effect via purity 0.1057
Indirect effect via RS 0.1082 Indirect effect via t pol ha-1 0.0367 Indirect effect via t sugarcane ha-1 -0.0144
Total 0.9778
Unlike SD and NT, the other variables did not have strong direct effects of stalk dry matter, at most timepoints, which, in addition to being weak, were mainly negative. According to Cruz et al. (2006), in this situation, the independent trait is not the main determinant of alterations in the main variable; other factors can also have a large impact in terms of genetic gain in selection. Given these biometric data results, we suggest the development of a selection index for sugarcane genotypes using SD and NT.
statistical tool in identifying components that have a large effect (Esposito et al., 2012). SD, a variable that is easily measured, was the component that contributed the most to sugarcane yield among the production variables, indicating the possibility of obtaining significant gains through indirect selection for SDM via SD.
As shown in Table 3, strong, positive genotypic correlations were obtained between the technological variables and the main variable (TRS), except for RS (-0.8897). However, only for Brix and juice pol did these significant genotypic correlations result in direct effects (greater than the residual effect) on the TRS. Working with technological variables in sweet sorghum, Lombardi et al. (2015) reported strongly positive direct effects of total Brix per hectare on ethanol production per hectare, and concluded that Brix was the variable that most contributed to ethanol production.
There were positive, indirect effects (greater than the residual effects) of fiber, purity, juice pol, and TPH via Brix on the dependent variable. The exception was the indirect effect of RS via Brix (-0.4088), which was strong but negative. These results confirm the importance of the Brix variable as the main component that increases sugarcane TRS; degrees Brix, followed by juice pol, were the traits that most contributed to TRS. Indirect selection for TRS via Brix, or via Brix and juice pol, could provide significant gains in sugarcane yield.
CONCLUSIONS
SD contributed the most to sugarcane SDM. Significant gains can be obtained through indirect selection for SDM via SD, or via SD and NT. Of the technological variables, degrees Brix, followed by juice pol, most contributed to sugarcane TRS production. These variables could provide significant gains in sugarcane yield through indirect selection for TRS via Brix, or via Brix and juice pol.
Conflicts of interest
The authors declare no conflict of interest.
ACKNOWLEDGMENTS
The authors thank Coordenação de Aperfeiçoamento de Pessoal de Nível Superior (CAPES) and the COMVAP for the financial support to this research
REFERENCES
Araujo LC, Gravina GA, Marinho CD, Almeida SNC, et al. (2012). Contribution of components of production on snap bean yield. Crop Breed. Appl. Biotechnol. 12: 206-210 http://dx.doi.org/10.1590/S1984-70332012000300007. Cabral PDS, Soares TCB, Lima ABP, Soares YJB, et al. (2011). Análise de trilha do rendimento de grãos de feijoeiro
(Phaseolus vulgaris L.) e seus componentes. Rev. Cienc. Agron 42: 132-138
http://dx.doi.org/10.1590/S1806-66902011000100017.
Cruz CD, Regazzi AJ and Carneiro PCS (2006). Modelos biométricos aplicados ao melhoramento genético, 2nd edn. UFV, Viçosa.
Esposito DP, Peternelli LA, Paula TOM and Barbosa MHP (2012). Análise de trilha usando valores fenotípicos e genotípicos para componentes do rendimento na seleção de famílias de cana-de-açúcar. Cienc. Rural 42: 38-44 http://
dx.doi.org/10.1590/S0103-84782011005000152.
Faria LA, Pelúzio JM, Afférri FS, Carvalho EV, et al. (2015). Path analysis for growth and grain yield of corn genotypes under different nitrogen doses. J. Bioenergy Food Sci 2: 1-11 10.18067/jbfs.v2i1.13.
Farias FJC, Carvalho LP, Silva Filho JL and Teodoro PE (2016). Correlations and path analysis among agronomic and technological traits of upland cotton. Genet. Mol. Res. 15: 1-7 http://dx.doi.org/10.4238/gmr.15038239.
Ferreira FM, Barros WS, Silva FL, Barbosa MHP, et al. (2007). Relações fenotípicas e genotípicas entre componentes de produção de cana-de-açúcar. Bragantia 66: 605-610 http://dx.doi.org/10.1590/S0006-87052007000400010. Hoogerheide ESS, Vencovsky R, Farias FJC, Freire ECE, et al. (2007). Correlações e análise de trilha de caracteres
tecnológicos e a produtividade de fibras de algodão. Pesq. Agr. Bras 42: 1401-1405
http://dx.doi.org/10.1590/S0100-204X2007001000005.
Kang MSMS, Miller JD and Tai PYP (1983). Genetic and phenotypic path analysis and hereditability in sugarcane. Crop Sci. 23: 643-647. http://dx.doi.org/10.2135/cropsci1983.0011183X002300040010x
Kavalco SAF, Figueiredo R, Groli EL, Zimmer CM, et al. (2014). Análise de trilha em genótipos de trigo submetidos ao estresse por encharcamento. Semina: Cienc. Agrar. 35: 1683-1696
http://dx.doi.org/10.5433/1679-0359.2014v35n4p1683.
Li CC (1956). Concept of path coefficient and its impact on population genetics. Biometrics 12: 190-210. http://dx.doi. org/10.2307/3001760
Li CC (1975). Path analysis: a primer. Boxwood Press, Pacific Grove, CA, USA.
Lombardi GM, Nunes JA, Parrella RA, Teixeira DH, et al. (2015). Path analysis of agro-industrial traits in sweet sorghum.
Genet. Mol. Res. 14: 16392-16402 http://dx.doi.org/10.4238/2015.December.9.8.
Marchezan E, Martin TN, Santos FM and Camargo ER (2005). Análise de coeficiente de trilha para os componentes de produção em arroz. Cienc. Rural 35: 1027-1033. http://dx.doi.org/10.1590/S0103-84782005000500007
Montgomery DC and Peck EA (1981). Introduction to linear regression analysis. John Wiley, New York.
Moura JO, Rocha MM, Gomes RLF, Freire Filho FR, et al. (2012). Path analysis of iron and zinc contents and others traits in cowpea. Crop Breed. Appl. Biotechnol. 12: 245-252 http://dx.doi.org/10.1590/S1984-70332012000400003. Peter FA, Alcântara Neto F, Barros WS, Almeida FA, et al. (2014). Phenotypic correlations and path analysis of soybean
production components in the Brazilian cerrado of Piauí state. Rev. Cienc. Agr 57: 273-279 10.4322/rca.ao1412. Reddy CR and Reddy MV (1986). Degree of genetic determination, correlations and genotypic and phenotypic path
analysis of cane and sugar yield in sugarcane. Indian J. Genet. Plant Breed. 46: 550-557.
Santos A, Ceccon G, Davide LMC, Correa AM, et al. (2014). Correlations and path analysis of yield components in cowpea. Crop Breed. Appl. Biotechnol. 14: 82-87 http://dx.doi.org/10.1590/1984-70332014v14n2a15.
Silva FL, Pedrozo CA, Barbosa MHP, Resende MDV, et al. (2009). Análise de trilha para os componentes de produção de cana-de-açúcar via Blup. Rev. Ceres 56: 308-314.
Souza ERA, Oliveira FJ, Anunciação Filho CJ, Melo Filho PMA, et al. (2011). Seleção de famílias RB visando à alta produtividade e precocidade na maturação em cana-de-açúcar. Bragantia 70: 788-795 10.1590/S0006-87052011000400009.
Sukhchain SD and Sain GS (1997). Inter-relationships among cane yield and commercial cane sugar and their component traits in autumn plant crop of sugarcane. Euphytica 95: 109-114 http://dx.doi.org/10.1023/A:1002962131707. Thornthwaite CW and Mather JR (1955). The water balance. In: Climatology. Drexel Institute of Technology, Centerton. Wright S (1921). Correlation and causation. J. Agric. Res. 20: 577-585.