A Model for the Real Time Detection of
Ventricular Late Potentials Oriented to
Embedded Systems Implementation
Agostino Giorgio
Digital Systems Electronics Lab, Dept. of Electrical and Information Engineering Politecnico di Bari – Italy
Abstract: In this paper, it is proposed a new dynamic model for the real time detection of ventricular late potentials (VLP) in high-resolution electrocardiogram signal (HREGC). The VLPs are very small intensity signals addressing dangerous incoming cardiac pathologies, not detectable without a proper processing of the electrocardiographic signal. The model is based on the time-frequency (TF) representation of the HRECG, and on the wavelet denoising. It is suitable for the implementation in an embedded system useful for the real time acquisition and processing of the HRECG signal, based on FPGA devices. The model was successfully verified on a wide database of HRECGs. Then, it has been successfully compiled by using the DSPbuilder compiler by Altera, in a .sof file to program an Altera’s FPGA device of the Cyclone V family.
Keywords: Ventricular Late Potential, High Resolution ECG, wavelet transform, time-frequency transform, FPGA, Simulink, DSPbuilder
I. INTRODUCTION
The ventricular late potentials (VLP) are very low intensity and high frequency signals (in relation to the bandwidth of the electrocardiographic signal, typically lower than 100 Hz). The presence of VLPs in the electrocardiographic signal has been associated with damages in the ventricular myocardial tissues. The necrosis or ischemic death of myocardial cells causes the formation of high resistivity areas, causing a delay of the propagation of the cardiac action potential. This phenomenon affects the electrocardiographic signal with the presence of electrical activity, although of low intensity, between the end point of the QRS complex and the starting point of the ST segment, where it should not be [1] as in fig. 1, showing the ideal linearized model of the ECG signal for the sake of clarity.
The intensity of VLPs is at least two orders of magnitude smaller than the electrocardiographic signal pert, typically available for diagnostic purposes, so they are usually "hidden" below the noise produced by the acquisition hardware and the electrical activity of the environment or of the human body but not related to the heart. For this reasons VLPs are not easily visible on the ECG signal.
In fact, a typical electrocardiographic signal has amplitude of the order of a few mV and it contains most of the information at frequencies below 100 Hz.
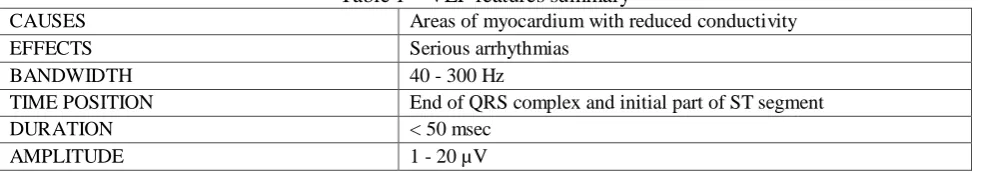
VLPs, if present, are non-stationary and non-gaussian signals with an amplitude between 1 and 20 µV. Table 1 summarizes the main features of the VLP.
Table 1 – VLP features summary
CAUSES Areas of myocardium with reduced conductivity
EFFECTS Serious arrhythmias
BANDWIDTH 40 - 300 Hz
TIME POSITION End of QRS complex and initial part of ST segment
DURATION < 50 msec
AMPLITUDE 1 - 20 µV
VLPs are signals hidden by the noise and therefore their detection is very difficult. It is necessary the acquisition of the electrocardiographic signal at high resolution (HRECG signal) and, then, it is necessary to process properly the signal to reduce drastically the noise level.
This is a quite hard but also very useful task especially for the real time detection. In fact, several statistical studies demonstrated a correlation between the presence of VLPs and the possibility of sudden cardiac death due to arrhythmia, often tachycardia. Patients with previous ischemic events are the most at risk. A correct VLPs detection makes the prevention of these serious malignant arrhythmias possible.
Therefore, in [2], [3]the author already described a new, very efficient algorithm, to detect the VLP by a post-acquisition processing of the HRECG, both in time and in time-frequency domain. Moreover, in [3]it has been demonstrated that the time-frequency processing gives the best results in terms of detection efficiency compared to the time domain processing.
In this paper, the algorithm has been implemented in a Simulink/DSPbuilder model making it ready for embedded system implementation.
The main advantage is to allow the VLP detection in real time by a wearable device, preventing of serious illness and allowing a quick rescue of a patient that often is not aware of the serious damages incoming.
Therefore, in section II an overview on the algorithm and details about the dynamic model implemented, are provided; in section III detection results are discussed and in section IV conclusions and future developments are highlighted.
II.MAIN FEATURES OF THE ALGORITHM AND DESCRIPTION OF THE NEW MODEL
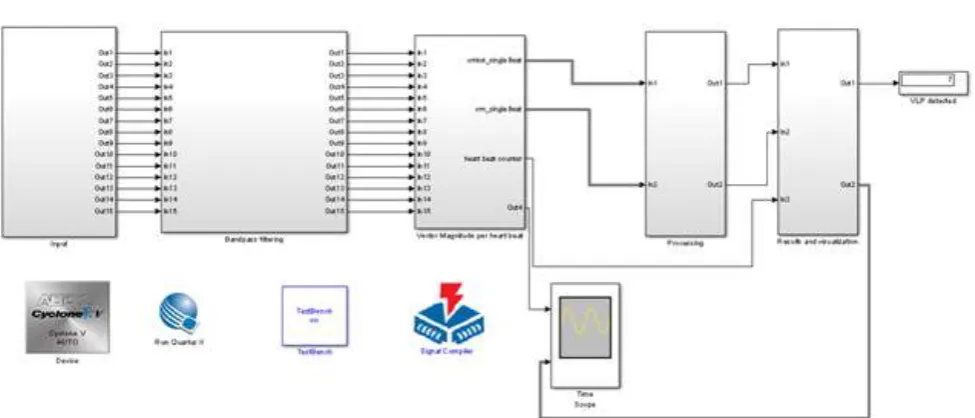
Figure 2: Simulink model of the detection algorithm
A. Bandpass Filtering and Vector Magnitude calculation
The first step of the processing is the band-pass filtering of signals coming from each lead of the acquisition hardware (high-resolution electrocardiograph).
The filtering limits the bandwidth of the signal to the useful range, in order to limit the noise energy, also.
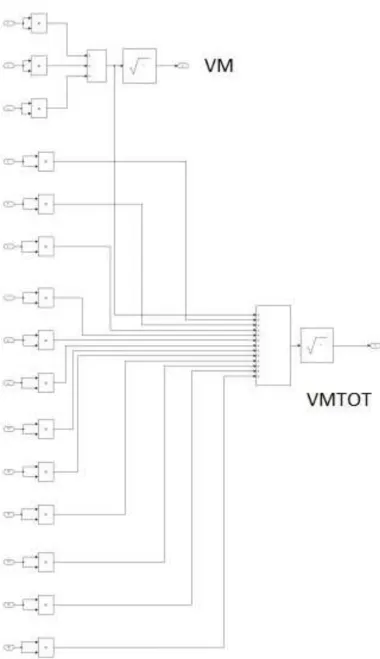
Then, the filtered signals (for each lead) are joined together for the calculation of the Vector Magnitude (VM), with the aim of collecting the information of all ECG leads in a single signal [4].
The Vector Magnitude is calculated using the main three leads (in this case it is simply called VM) or using all leads, 15 in our HRECG acquisition hardware (in this case it is called VMTOT).
Calculation formulas [4] are respectively in (1) and (2):
) ( ) ( )
( 2 2
2
t Z t Y t X
VM (1)
Being X(t), Y(t) and Z(t) the signal coming from the three main leads of the HRECG;
N
n n
TOT L
VM
1 2
(2)
Being Ln the generic n-th lead of the HRECG.
B. Signal denoising
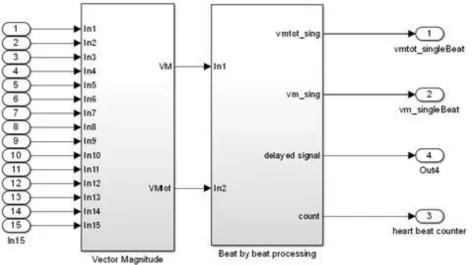
The processing flow continues with the denoising of VM and VMTOT beat by beat, as shown in
figure 4.
Each heart beat is detected by a digital peak detector fixing each incoming QRS wave. This task is particularly easy because of the QRS wave has the highest amplitude in the HRECG beat wave. A digital counter allows also the determination of the heart frequency.
Figure 4: Simulink high level model of the beat per beat processing
The denoising is necessary in order to make the VLPs detectable, because as previously stated they are embedded into the noise. The denoising step is performed in the new algorithm using one or both of them of two methods: the wavelet denoising and the Signal Averaged Electrocardiography (SAECG) technique [4], depending on the specific application. In fact, the author’s algorithm allows to detect VLPs in two different conditions: analyzing a few minutes of prerecorded signal, and in real time, i.e. during the HRECG signal acquisition.
The SAECG allows a very efficient denoising but is is available only for the post -acquisition signal processing. In fact, the SAECG technique is based on a mean value calculation and then needs the full signal to process. The simultaneous use of wavelet denoising and of SAECG, in post-acquisition processing, yielded very good results in terms of detection efficiency also with short -term recored HRECG [3]. Anyway, for pure real-time processing, the SAECG is not available and then the denoising of the signal is performed using the wavelet transform, only.
Numerical details about the denoising wavelet technique are in [5]. It should be used the Discrete Wavelet Transform (DWT) and the Inverse Discrete Wavelet Transform (IDWT).
Better results are obtained by setting a threshold proportional to the residual noise. The noise level is measured in the second level of decomposition, calculating the standard deviation of the signal in a section in which there is only noise. Hard thresholding is used to cancel the coefficients below the threshold, as deeply explained in [5].
C. Time-frequency representation of the VM
The denoised signal is further processed in order to find the characteristic points on the vector magnitude, which localization in time and in frequency domain is sensitive to the VLP presence [4].
To this aim, the denoised VM is transformed according to the Wigner-Ville distribution, expressed in (3):
d e t x t x f tWVD * j2f
2 2 ) , ( (3)
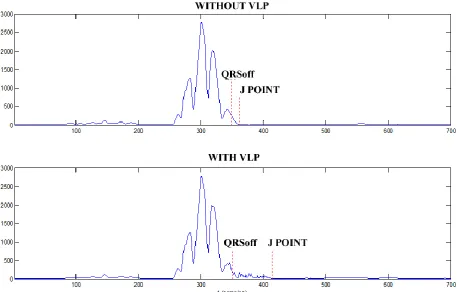
The corresponding function has been implemented by an m-file in the Simulink model. Then, it has been implemented into the “beat by beat processing block” in fig. 4. An example of the one-heart beat VM is in fig. 6, with and without a VLP.
By the VM processed according to the Wigner-Ville transform are calculated the characteristic points sensitive to the VLP presence, as explained in the following.
D. J point localization
The J point marks the end of the QRS wave, as in fig. 6. Its location strongly changes depending on the presence or not of the VLP on a single hearth beat. In a healthy ECG, the J point separates a section characterized by a wide signal from a section without electrical activity. In the presence of VLPs this separation is not so sharp, and it is difficult to locate the J point. In the described model it is adopted a method for J point location based on energy comparison. The principle was introduced in [6]and improved by the author [4] as follows.
Figure 6: Characteristic points J and QRSoff located on the VM signal with and without the VLP
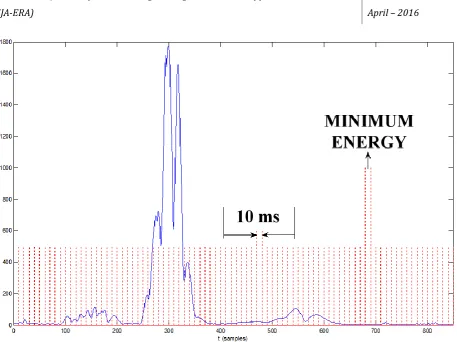
An energy threshold, proportional to the noise energy, is then set. Starting from the R wave peak, which is the absolute maximum of the single-beat VM, the threshold is compared with the energy evaluated in a 10ms interval after each ECG sample. The first point that provides an energy below the threshold is considered as the J point.
E. QRSoff point localization
The same method is used to locate another reference point on the ECG, we called it “QRSoff”.
It represents the end of the QRS wave on the HRECG signal and has to be independent on the possible presence of VLPs. This means that the energy threshold used for its identification must be significantly greater than the one used for J point localization. This point is useful in time-frequency analysis in case of uncertain location of the J point.
The best results were obtained with thresholds about 5 and 100 times greater than the noise energy, respectively for the J point and QRSoff. However the optimal values are very different by
Figure 7: Algorithm to detect the location of the characteristic J and QRSoff points
F. EN and ENEND
As already stated, the time-frequency representations (TFR) are very effective for VLPs detection, due to the localization of VLPs in both domains, time and frequency.
Unlike the time analysis, a standard for this approach has not yet been defined. Anyway, normalized energies have been demonstrated very effective in order to detect VLPs [7].
The energy indexes used in the algorithm and implemented in the new model, are deeply discussed in [4]. They are normalized energy indexes, called EN and ENEND and calculated as
summarised in the following.
The EN index is calculated in an interval around the J point. The extremes of the search window around the J point are statistically determined as follows:
tmin = J point - 55 msec tmax = J point + 25 msec fmin = 55 Hz
fmax = 300 Hz
The energy in this area, called EVLP, is therefore evaluated as in (4)
max
min max
min
) , ( 1
=
E 2
1 VLP
f
f f
t
t t
f t TFR k
(4)
Where TFR is the two-dimensional matrix resulting from the WVD of the signal and k1 is a normalization parameter defined as the product between the rows and columns of the considered search window in TFR matrix.
The second energy index, EEND, introduced by the author in the new algorithm is calculated in
an area next to the QRSoff point, previously described.
max min sec 80 2 2END ( , )
1 = E f f f m QRSoff QRSoff t f t TFR k (5)
This index makes more effective the detection algorithm due to the uncertainty in the correct localization of the J point. The energy values EVLP and EEND are normalized to calculate the indexes of
interest EN and EEND. For this purpose, they are divided by the energy of the QRS complex (EQRS),
evaluated from the R wave to the QRSoff point according to (6):
max min ) , ( 1 = E 2 2 QRS f f f QRSoff wave R t f t TFR k (6)Then, the normalized energy indexes are calculated as in (7) and (8).
QRS E
VLP
E =
EN (7)
QRS E END END E = EN (8)
III.RESULTS
To test the effectiveness of the real-time processing we have used a wide data base of healthy HRECG and we have artificially added a known number of like-VLP signals. Thus, we have generated HRECG signals with a known number of VLP. To know the exact number of VLPs present in the data base is necessary in order to test the capability of the model to find the VLPs in real time HRECG signals. The effectiveness represents the ratio between the number of VLPs detected and the real number of VLPs in the signal.
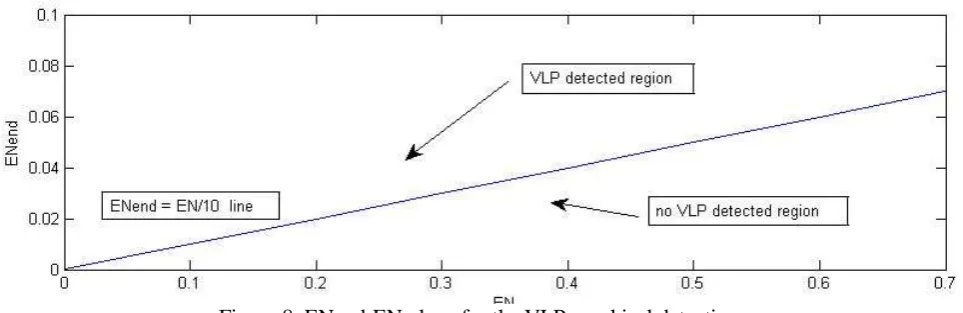
We chose to use bivariable analysis to find the values of the defined indexes, EN and ENEND,
separating in the most effective way the HRECG processed signals with and without VLPs. The complete separation between the healthy ECG and ECG with VLP is found to be marked by the straight line ENEND=EN/10. This separation is not unique, but heavily depends on acquisition hardware and
signals characteristics. Therefore, changing the acquisition hardware makes it necessary to perform again the bivariable analysis.
Then, VLPs were confirmed as “Detected” if, calculating the parameters EN and ENend, the point in the plane (EN, ENend) exceeds the separation line ENend=EN/10, as in fig. 8.
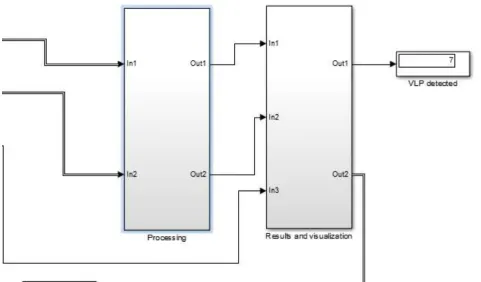
In the Simulink model, for test purposes, there have been included also a time-scope and a 7-segment display, as in fig. 2.
The time scope is useful to display in real time the HRECG signal and the VLP detection by overlapping a vertical line every time a VLP is detected, as in fig. 9.
Figure 9: Output of the time-scope block in the implemented Simulink model, showing in real time the HRECG processed and the eventual VLP detection by using an overlapped vertical line
The 7-segment display is used to alert the user/analyst about the exact number of the VLP detected. The counting is in real time. A detail is in fig. 10
Applying the model to a number of 240 HRECG signals the resulting effectiveness is 97% This means that over a number of 100 VLPs the model is able to detect typically 97 VLPs. This is a very important result. Moreover, the electrocardiogram is generally performed for many seconds of time. The number of heartbeats detected and processed is very high and VLPs if present are in significant number; therefore, the algorithm guarantees the certain detection of their presence even if there is a very little uncertainty about their real number. Anyway, for diagnostic purposes it is not important the exact number of VLPs but their detection.
IV.CONCLUSIONS
We developed a new method for ventricular late potentials (VLP) detection in high resolution electrocardiographic signals, suitable for both post-acquisition analysis and real-time applications. In this paper, the real-time algorithm has been implemented in a Simulink model suitable for embedded systems implementation. The method was validated with a group of 240 healthy ECG, with the addition of realistic artificial VLP. The mean detection efficiency is 97%.
Then, the algorithm can be considered successfully validated.
The model has been also compiled with the DSPbuilder compiler, by Altera, and the compilation procedure is terminated successfully with the creation of the .sof file, ready to program an Altera FPGA.
The most innovative feature of the algorithm deals with the search for parameters, in the time-frequency domain, that confer robustness to the method, as the introduction of a parameter not influenced from the J point location, ENend. In fact, the J point correct location, typically used as reference parameter to detect the presence or not of the VLPs, is very difficult and often matter of failure of the VLPs search algorithms proposed in literature.
The results obtained show how, with the time-frequency representation, it is possible to have a mean effectiveness of 97% for the beat-by-beat analysis.
It is also possible to further improve the results using ever higher performance acquisition hardware and low noise electrodes to acquire the ECG signal.
The algorithm for automatic VLP detection can be implemented by software, for example in the Holter ECG, or by firmware, directly associated with an acquisition hardware.
Future developments may include telemedicine applications. In fact, a miniaturised and wearable telemedicine device, using the LTE connectivity and the web services to send SMS, may send warnings. In conjunction with the sending of the GPS coordinates of the patient, the device may allow a quick alert to rescue of people that may be at high risk of life if VLPs are detected.
Conflict of interest: The author declare that he has no conflict of interest.
Ethical statement: The paper is an upgrade/expansion of other papers already published by the author, as clearly stated in the introduction. The author declare that he has followed ethical responsibilities.
V. REFERENCES
[1] Lin, C.C., (2005) "Improved frequency-domain analysis of ventricular late potentials," Computers in Cardiology, vol. 32, no. 5, pp. 479 -482.
[2] Giorgio, A., (2014) “Digital Electronics for Medical Devices with Advanced Performances” Proceedings of the 1st Workshop Poliba Score, p. 209-213, ISBN: 978-88-492-2967-7
[4] Giorgio A., Gadaleta, M., (2012) “Advances in Electronics for Digital Electrocardiography” SAARBRUCKEN: LAP LAMBERT Academic Publishing AG & Co. KG, ISBN: 978-3-659-29967-4 [5] Muralikumar, B. Saranya, V.P. Shanthiprabha R. Sivakumar, (2011) "Analysis of Ventricular Late Potentials
using wavelets and FFT spectrum," Biomedical Engineering and Technology, vol. 6, no. 1, pp. 76 – 92. [6] Addison, I.R., Grubb, P.S., Clegg, N.R., Robertson, G.R., Watson, C.E., Legarreta, J.N., (2005) "Analysis
of ventricular late potentials prior to the onset of ventricular tachyarrhythmias: end of QRS point detector," Computers in Cardiology, vol. 32, no. 5, pp. 471 -474.