©FUNPEC-RP www.funpecrp.com.br Genetics and Molecular Research 18 (4): gmr18368
L.C. Melo1, A.C.F. Silva2, H.S. Pereira2, P.G.S. Melo3 and T.L.P.O. Souza2
1
Embrapa Arroz e Feijão, Goiania, GO, Brasil
2
Universidade UniCerrado, Goiatuba, GO, Brasil
3
Universidade Federal de Goias, Goiania, GO, Brasil
Corresponding author: L.C. Melo E-mail: [email protected]
Genet. Mol. Res. 18 (4): gmr18368 Received May 17, 2019
Accepted August 27, 2019 Published December 31, 2019
DOI http://dx.doi.org/10.4238/gmr18368
ABSTRACT. Common beans are a key source of protein and are consumed daily by most of the Brazilian population. More than 70% of what is consumed in this country is classified as carioca beans, based on seed qualities and appearance. We evaluated progenies of carioca common beans of the Brazilian agriculture research agency (Embrapa) recurrent selection program. This recurrent selection program is based on resistance to common bean bacterial blight (CBB), seed yield, and other important agronomic traits. Selection also considers the genetic representativeness of the parents and the genetic diversity among phenotypically selected progenies. Initially, 60 superior progenies were selected based on resistance to CBB and on seed type, in two locations (Santo Antônio de Goiás, GO and Ponta Grossa, PR). These progenies were evaluated in the C0S0:2 generation
in field trials in six locations during the rainy growing season. A randomized block experimental design was used with two replications, in plots of two 3-m rows spaced at 0.5 m. The most promising C0S0:3
©FUNPEC-RP www.funpecrp.com.br Genetics and Molecular Research 18 (4): gmr18368
genetic representativeness of their parents and the genetic diversity among them. The phenotypic data was subjected to analysis of variance for each trait in each of the environments, and then joint analyses were performed. To estimate genetic diversity among the progenies, the Rogers-W genetic distance was used, and a dissimilarity matrix was used to construct a dendrogram of genetic distances through the UPGMA method. Among the 60 C0S0:2
progenies that were evaluated, those that stood out for resistance to CBB also stood out for seed yield and for resistance to other diseases. Various progenies were superior, exhibiting large genetic distances between each other and in relation to the parents. This indicates a possibility of direct and indirect gains from the recurrent selection program. This molecular information will help direct selection of individuals for future recombination cycles.
Key words:Phaseolus vulgaris; Common bean breeding; Molecular markers; Disease resistance; Progenies; Seed yield
INTRODUCTION
Due to the considerable importance of the common bean (Phaseolus vulgaris) crop in Brazil, breeding programs conducted by public and private institutions have continually worked to supply Brazilian farmers with improved cultivars. These programs seek, above all, to combine desirable traits, such as disease resistance, low loss in mechanized harvest, early maturity, high seed yield potential, and stability in seed production, thereby contributing to an increase in grain yield from 810 kg.ha-1 in 2000 to 1440 kg.ha-1 in 2016 (Embrapa, 2018); this is an increase of 77.8% in 16 years. The common bean commercial class known as carioca (cream color with light brown stripes) is the most widely consumed in Brazil; it accounts for around 70% of Brazilian production. Yield gains obtained from common bean breeding have been around 0.72% a year for carioca beans (Faria et al., 2013).
Common bacterial blight (CBB) is a high impact disease that occurs in important common bean production regions. It is caused by Xanthomonas axonopodis pv. phaseoli
(Vauterin et al., 1995) and its variant, Xanthomonas fuscans subsp. fuscans (Schaad et al., 2006). Bactericides have not been an effective alternative to control this disease (Denardin and Agostini, 2013). The use of resistant cultivars and certified seeds, adequate use of irrigation, growing in non-infested soils, and crop rotation are the most effective methods for control of CBB (Maringoni and Lauretti, 1999; Singh and Miklas, 2015; Akhavan et al., 2013).
Genetics and Molecular Research 18 (4): gmr18368 ©FUNPEC-RP www.funpecrp.com.br
for this trait and these gains to result in a greater number of cultivars with resistance to CBB.
Recurrent selection is a breeding method that allows accumulation of alleles that are favorable for the target traits in each selection cycle. This leads to populations that are superior for such traits over cycles and to superior lines coming from these populations (Ramalho et al., 2005). Recurrent selection has been successfully used in various species, including the common bean, leading to genetic gains for many traits of economic importance, such as seed yield (Ramalho et al., 2005; Silva et al., 2010), plant architecture (Cunha et al., 2005; Pereira et al., 2017), resistance to CBB (Duncan et al., 2006), resistance to angular leaf spot (Amaro et al., 2007) and white mold (Leite et al., 2017), and early maturity (Silva et al., 2007). Resistance to CBB, in general, presents estimates of heritability ranging from medium to high (above 0.5) (Tar’an et al., 2001; Singh and Miklas, 2015). This makes the use of phenotypic recurrent selection possible, avoiding the necessity of setting up trials with replications, but prioritizing evaluation of resistance to the disease in various locations and thus increasing the efficiency of the selection process.
Microsatellite markers are useful tools to assist in making decisions during different steps of a breeding program (Morais el al., 2016). In the case of recurrent selection, they can assist in selecting parents and in defining the number of intercrosses for maintaining a good level of recombination (Courtois et al., 2003). These markers can also assist in evaluating initial genetic diversity and in maintaining it during the recombination cycles. This maximizes the genetic diversity of the base population in the next cycles and increases the opportunity to obtain genetic gain for various traits in the selection steps of the breeding program (Batista et al., 2014).
Studies conducted with microsatellite markers in allogamous and autogamous plant species indicate that they were effective in determination of the variation of allelic diversity caused by genetic drift, as well as for detecting genetic structuring in recurrent selection populations (Liu et al., 2007, Filippi et al., 2015, Perseguini et al., 2015).
Our objective was to include genetic diversity in the selection of progenies of carioca common beans in Brazil. This was done as part of the Embrapa recurrent selection program for resistance to CBB, seed yield, and other important agronomic traits in this crop. Molecular diversity measures included the genetic representativeness of the parents and the genetic diversity among the phenotypically selected progenies.
MATERIAL AND METHODS
Crosses, plant material and phenotypic screening
©FUNPEC-RP www.funpecrp.com.br Genetics and Molecular Research 18 (4): gmr18368
Fusarium wilt (Fusarium oxysporum), CBB, and bacterial wilt (Curtobacterium
flaccumfaciens pv. flaccumfaciens) (Pereira et al., 2012). BRS Pontal exhibits moderate
resistance to CBB, anthracnose, and rust, (Del Peloso et al., 2004). CNFC 9458 and CNFC 9463 are elite lines that have moderate resistance to CBB and have other good agronomic traits.
To obtain a base population, single hybrids were first developed from crosses between the parents. After that, double and multiple hybrids were generated to represent all six parents: {[(IPR Siriri x CNFC 9458) x (CNFC 9463 x BRS Pontal)] x (IPR Juriti x BRS Pontal)}. The multiple hybrids were then grown to advance a generation, aiming to create a base population in the C0S0 generation.
The seeds of the base population (C0S0) were divided into two sets, which were
sown in the field in the dry growing season (February) and the winter growing season (May) of 2011 in Santo Antônio de Goiás, GO. In the dry season, five 10.0 m rows were sown, and in the winter season, six 5.0 m rows were sown. In both growing seasons, the plots were inoculated with a mixture of the isolates Xap 06, Xap 19, Xap 94, Xap 112, Xap 132, and Xap 154 of X. axonopodis pv. Phaseoli, which are maintained by the Phytopathology Laboratory of Embrapa Arroz e Feijão. They had previously been identified as the most virulent among the available isolates (Wendland et al., 2008). Inoculation was carried out when the plants exhibited the first fully expanded trifoliate leaf (V3 stage). To prepare the inoculum, the isolates were multiplied in a nutrient broth in a magnetic stirrer for a period from 48 to 72 h. The inoculum consisted of a bacterial suspension in sterilized distilled water, whose concentration was adjusted to 108 UFC/mL. At 60 days after inoculation, individual evaluation of the C0S0 plants was performed for resistance to CBB.
Plants evaluated as resistant to the disease, that is, those that did not show symptoms, were harvested individually. From this base population, 220 and 290 C0S0 plants were selected,
respectively, resulting in 510 C0S0:1 progenies.
In the rainy growing season of 2011, these 510 progenies were evaluated for resistance to CBB. The seeds obtained from each plant were separated into two lots for sowing in two different environments. In the rainy growing season (November) of 2011, these C0S0:1 progenies were sown in Santo Antônio de Goiás, GO and in Ponta Grossa, PR,
for evaluation and new selection for resistance to CBB, based on natural occurrence of the disease. These two locations have a strong history of high occurrence of the disease and represent two different regions of great importance for dry edible bean production in Brazil. After that, 92 progenies superior in resistance to this disease were selected (mean degree of susceptibility ≤3.0), considering the mean susceptibility in the two locations evaluated. After harvest, the seeds from these 92 progenies grown in Santo Antonio de Goias were evaluated for 100-seed weight and commercial standard of the seed market class using a 1 to 5 scoring scale, based on visual observation (Ramalho et al., 1998). Thus, the 60 best progenies for both traits were selected, giving rise to the C0S0:2 generation.
At the end of this step, 60 superior progenies were evaluated in field trials with replications in six locations during the rainy growing season (November/December) of 2012. These trials were carried out in Santo Antônio de Goiás and Anápolis, GO; Brasília, DF; Ponta Grossa, PR; and Uberlândia and Sete Lagoas, MG. A randomized block experimental design was used with two replications, in plots of two 3-m rows spaced at 0.5 m. In addition to the 60 C0S0:2 progenies selected, the control cultivars Pérola, BRS Estilo, BRS Pontal and BRS
Genetics and Molecular Research 18 (4): gmr18368 ©FUNPEC-RP www.funpecrp.com.br
In these trials, in addition to resistance to CBB, resistance to the following other diseases were evaluated whenever possible according to when these diseases naturally occur: angular leaf spot (Pseudocercospora griseola); anthracnose; and bacterial wilt. Plant architecture and resistance to lodging were also evaluated. For that purpose, scores on a 1 to 9 scale were attributed – score 1 was attributed to the phenotype desired and score 9 to the phenotype completely outside of the desired standard (Melo, 2009). The yield data (kg.ha-1) were obtained from the weight of seeds harvested in each plot, adjusted to a moisture content of 13%.
Molecular analysis after analysis of the phenotypic data, the C0S0:3 progenies most
promising with regard to combined agronomic performance in the different environments were selected. These progenies were then evaluated by means of 24 microsatellite molecular markers for the purpose of determining the genetic representativeness of their parents and the genetic diversity among them, so as to optimize the number of crosses necessary to form the next recombination cycle without compromising maintenance of genetic variability in the recurrent selection population.
Twenty-four fluorescent microsatellite markers were previously chosen based on their high informative content, distributed in four multiplex panels containing six markers each (Morais et al., 2016). DNA was extracted from bulk samples obtained from leaves of 10 plants from each genotype using the alkaline extraction method, as described by Xin et al. (2003). PCR reactions were conducted in a GeneAmp PCR System 9700 (Applied Biosystems) thermocycler using a final volume of 5.0 µL. The Qiagen® PCR Multiplex kit was used for amplification, composed of Master-Mix(50% of the reaction volume) and Q-Solution (10% of the volume), in addition to the primers marked with fluorescence, with concentrations ranging from 0.03 M to 1.2 M, depending on the intensity of the product amplified, and Milli-Q water (amount necessary to complete the final PCR reaction volume to 5.0 µL).
The amplification products were initially homogenized using 0.5 μL of each reaction product in a final volume of 10.0 μL, containing the formamide reagents and the
Rox Liz internal marker (yellowish). After that, the samples were analyzed in an automatic fragment analyzer ABI3100 (Applied Biosystems) and were then genotyped, which was performed with the aid of the GeneMapper program 4.1 (Applied Biosystems).
In the statistical analysis, the phenotypic data were subjected to analysis of variance for each trait in each of the environments, and then joint analyses were performed using the Genes program (Cruz 2013). In joint analyses, the homogeneity of the variances was evaluated through the 7:1 ratio of the residual mean squares, as reported by Pimentel-Gomes (2009). When necessary, the degrees of freedom of the mean error and of the G x E interaction were adjusted, according to the Cochran (1954) method. The mean values were clustered by the Tukey test at 5% significance.
©FUNPEC-RP www.funpecrp.com.br Genetics and Molecular Research 18 (4): gmr18368
RESULTS
Based on evaluation of the 60 progenies in the five environments for seed yield and resistance to CBB, anthracnose and angular leaf spot, significant differences were observed for the genotype effect, indicating genetic variability and thus justifying selection for superior genotypes since there is the possibility of obtaining genetic gains for these traits (Table 1). Variation was also seen among the environments evaluated and the occurrence of a differential response of the genotypes to the environments. For plant architecture and resistance to bacterial wilt, significant differences were observed only for the effect of genotypes. As for tolerance to plant lodging, significant differences were observed for the effect of genotypes and of the genotype x environment interaction. Most of the traits evaluated showed coefficient of variation estimates lower than 20% in joint analysis of variance, indicating adequate experimental precision (Table 1). Exceptions were evaluations for resistance to anthracnose and to angular leaf spot, which exhibited coefficient of variation above 25%, as expected.
Table 1. Summary of combined analyses of variance for agronomic traits of the trials of the Embrapa recurrent selection program for resistance to common bacterial blight in carioca type common beans, based on evaluation of five environments in the rainy growing season of 2012.
Characteristic MSG MSE MSGxE Mean CV NE
YLD 585391** 102047634** 291991** 2580 17.2 4
CBB 000001.181** 000000046.410 ** 000000.997** 0004.6 17.8 2
ARC 000001.240** 000000004.320ns 000000.344ns 0004.8 11.2 3
LOD 000004.288** 000000001.596ns 000001.025** 0004.3 19.4 3
AN 000003.124** 000000004.875* 000001.777** 0001.4 32.1 3
ALS 000002.066** 000000096.285* 000001.976** 0003.7 28.2 2
BW 000003.187* 000000040.641ns 000000.847ns 0005.1 19.3 2
MSG: Mean square of the genotypes; MSE: Mean square of environments; MSGxE: Mean square of the genotype x environments interaction; Mean: Overall mean of the trials; CV Coefficient of variation (%); NE: Number of environments; YLD: seed yield; CBB: bacterial blight; ARC: architecture; LOD: tolerance to lodging; AN: anthracnose; ALS: angular leaf spot; BW: bacterial wilt; ns: not significant; *significant at P < 0.05; **significant at P < 0.01.
Genetics and Molecular Research 18 (4): gmr18368 ©FUNPEC-RP www.funpecrp.com.br
21 of the 24 SSR loci were amplified. Of the 21 loci, 18 were selected through exhibiting truly evident and robust polymorphisms. These 18 SSR markers were then effectively used to estimate genetic diversity among the progenies tested, as well as the genetic representativeness of the parents in these progenies. A total of 51 alleles were detected, with a mean of 2.83 alleles per polymorphic locus. The highest number of alleles was identified in the PV87 marker (five alleles) and the lowest number in the markers BM185, BM210, PVESTBR101, BM202, PV113, BM113, and BM189 (two alleles).
Table 2. Agronomic performance of 30 C0S0:3 progenies selected as superior by the Embrapa recurrent
selection program for resistance to common bacterial blight in carioca type common beans at five locations in the rainy growing season of 2012.
Progeny YLD CBB BW ALS AN ARC LOD
SRC 211319647* 2325 03.5 02.8 02.3 03.4 05.3 04.8
SRC 211319754* 2978 03.5 02.5 03.8 02.1 03.8 02.8
SRC 211319602* 2677 03.8 03.0 03.0 01.0 04.7 04.2
SRC 211319833* 3059 03.80 02.8 04.5 01.0 04.7 04.2
BRS NOTÁVEL 2164 04.0 02.5 05.0 01.0 04.5 03.7
SRC 211319438 2718 04.0 03.0 05.0 01.0 05.2 04.3
SRC 211319505 2967 04.0 04.0 05.5 01.0 04.8 04.3
SRC 211319579 2293 04.0 02.8 04.3 01.0 05.0 04.5
SRC 211319634 2587 04.0 04.0 05.5 01.6 05.0 03.7
SRC 211319644 2606 04.0 04.3 04.5 01.6 04.7 04.2
SRC 211319704 3269 04.0 03.3 04.5 02.1 04.3 04.2
SRC 211319722 2698 04.0 02.5 04.8 01.9 04.8 04.5
SRC 211319815 2479 04.0 04.0 05.5 01.9 04.8 04.2
SRC 211319515 2888 04.3 03.0 03.5 01.3 05.5 05.8
SRC 211319582 2644 04.3 03.3 05.8 01.0 04.7 02.8
SRC 211319584 2478 04.3 03.5 06.3 01.0 04.7 04.7
SRC 211319632 2537 04.3 04.3 05.8 03.0 04.8 04.2
SRC 211319654 2903 04.3 04.3 06.3 01.0 04.5 03.7
SRC 211319764 2505 04.3 03.8 06.5 01.0 05.0 04.0
SRC 211319798 2202 04.3 04.0 05.5 01.0 05.0 05.0
SRC 211319802 2853 04.3 03.3 05.0 01.6 04.5 03.5
SRC 211319811 2647 04.3 03.3 06.5 01.0 04.8 05.0
SRC 211319388 2351 04.5 03.8 05.5 03.7 04.5 03.2
SRC 211319453 2663 04.5 05.5 05.3 02.1 05.2 05.2
SRC 211319466 2227 04.5 04.0 06.0 01.0 04.7 03.8
SRC 211319588 2394 04.5 04.0 04.5 01.0 05.5 05.3
SRC 211319626 2658 04.5 05.5 05.0 01.0 05.3 05.5
SRC 211319674 3151 04.5 04.0 04.5 01.3 05.2 03.7
SRC 211319708 2449 04.5 03.0 03.8 01.3 05.2 04.7
SRC 211319742 2225 04.5 03.5 07.0 02.3 04.3 03.7
SRC 211319793 2446 04.5 03.5 05.5 01.4 04.7 04.7
BRS ESTILO 2170 04.8 03.8 06.0 01.0 04.7 04.2
BRS PONTAL 2051 04.8 03.0 04.8 01.0 06.2 06.7
PÉROLA 1916 06.0 04.5 04.5 03.7 06.0 05.3
Overall meanA 2580 04.6 03.7 05.2 01.5 04.8 04.3
Mean 1st selectionB 2629 04.2 03.6 05.1 01.6 04.8 04.3
Final meanC 2724 04.0 03.4 04.9 01.6 04.6 04.0
CV(%) 17.2 18.0 28.2 19.3 76.8 11.2 19.4
Tukey (5%) 923.5 02.2 03.1 03.0 02.5 01.3 02.0
YLD: seed yield in kg.ha-1; CBB: mean susceptibilty to common bacterial blight, scores on a 1 to 9 scale, with 1 being
least susceptible; BW: mean susceptibilty to bacterial wilt (Curtobacterium), scores on a 1 to 9 scale; ALS: mean susceptibilty to angular leaf spot, scores on a 1 to 9 scale; AN: mean susceptibilty to anthracnose, scores on a 1 to 9 scale; ARC: mean score for architecture, scores on a 1 to 9 scale; LOD: mean score for tolerance to lodging, scores on a 1 to 9 scale. A60 progenies selected for final phenotypic evaluation; B30 progenies selected for analysis via molecular
©FUNPEC-RP www.funpecrp.com.br Genetics and Molecular Research 18 (4): gmr18368
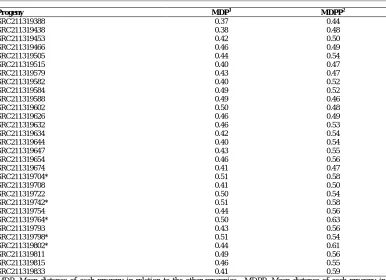
When compared, the progenies that had the greatest mean genetic distance were SRC211319704, SRC211319742, and SRC211319798, with a mean of 0.51 (Table 3). Thus, they were selected for the next recombination cycle. Compared to the six parents, the progenies that had the greatest mean genetic distances were SRC211319764 and SRC211319802, with mean distances of 0.63 and 0.61, respectively (Table 3). These progenies were also selected for the next recombination cycle.
Table 3. Mean genetic distances of the 30 C0S0:3 progenies of the Embrapa recurrent selection program for
resistance to common bacterial blight in carioca type common beans in relation to the other progenies and parents.
Progeny MDP1 MDPP2
SRC211319388 0.37 0.44
SRC211319438 0.38 0.48
SRC211319453 0.42 0.50
SRC211319466 0.46 0.49
SRC211319505 0.44 0.54
SRC211319515 0.40 0.47
SRC211319579 0.43 0.47
SRC211319582 0.40 0.52
SRC211319584 0.49 0.52
SRC211319588 0.49 0.46
SRC211319602 0.50 0.48
SRC211319626 0.46 0.49
SRC211319632 0.46 0.53
SRC211319634 0.42 0.54
SRC211319644 0.40 0.54
SRC211319647 0.43 0.55
SRC211319654 0.46 0.56
SRC211319674 0.41 0.47
SRC211319704* 0.51 0.58
SRC211319708 0.41 0.50
SRC211319722 0.50 0.54
SRC211319742* 0.51 0.58
SRC211319754 0.44 0.56
SRC211319764* 0.50 0.63
SRC211319793 0.43 0.56
SRC211319798* 0.51 0.54
SRC211319802* 0.44 0.61
SRC211319811 0.49 0.56
SRC211319815 0.46 0.55
SRC211319833 0.41 0.59
MDP: Mean distance of each progeny in relation to the other progenies; MDPP: Mean distance of each progeny in relation to the parents; *Progenies selected as superior based on mean genetic distances between progenies and parents.
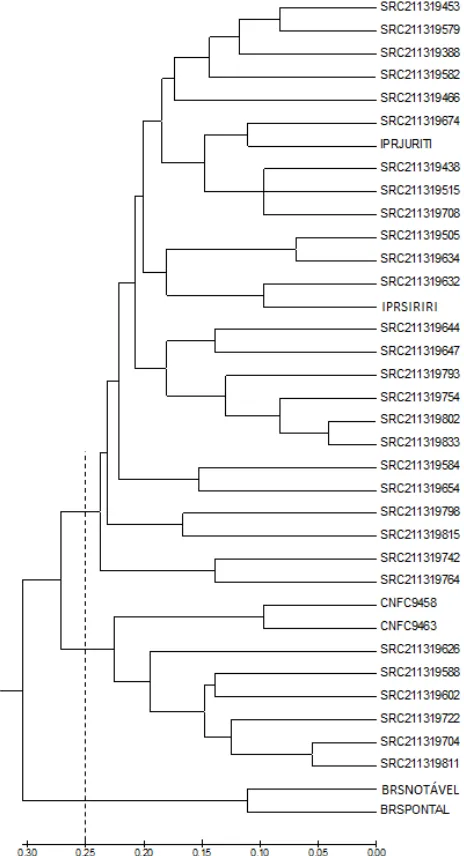
Cluster analysis based on the genetic distance matrix of Rogers-W obtained using the UPGMA method, including the six parents and the 30 selected C0S0:3 progenies, grouped the
Genetics and Molecular Research 18 (4): gmr18368 ©FUNPEC-RP www.funpecrp.com.br
occurred from these two parents having contributed more significantly to the formation of these progenies. The number of private alleles from these two parents observed in the 24 progenies of the cluster explains this result since IPR Juriti contributed with private alleles in all the 24 progenies and IPR Siriri in 16 of these progenies. These results confirm that the use of information on the frequency of the private alleles from each parent in the progenies supplies important information regarding the genetic composition of the progenies analyzed.
Figure 1. Dendrogram obtained from the genetic distance matrix of Rogers-W, using the UPGMA method, considering the six parents and the 30 C0S0:3 progenies selected from the Embrapa recurrent selection program for
©FUNPEC-RP www.funpecrp.com.br Genetics and Molecular Research 18 (4): gmr18368
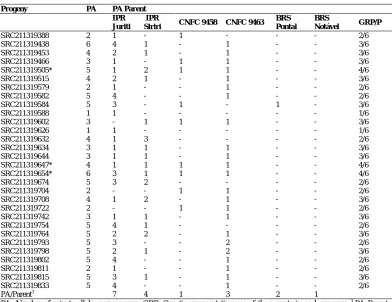
Of the 51 alleles detected, 18 were identified as private in at least one of the parents (Table 4). The parent that exhibited the largest number of private alleles was IPR Juriti (seven alleles). In contrast, CNFC 9458 and BRS Notável showed only one private allele each. The parents IPR Juriti and CNFC 9463 showed greater genetic representativeness in formation of the progenies, exhibiting at least one private allele in 27 and 23 progenies, respectively. It is noteworthy that the parent IPR Juriti was the most similar in the cluster, with 24 progenies.
Table 4. Genetic representativeness of the parents in the 30 C0S0:3 progenies of the Embrapa recurrent
selection program for resistance to common bacterial bean blight in carioca type common beans.
Progeny PA PA Parent
IPR
Juriti IPR
Siriri CNFC 9458 CNFC 9463
BRS Pontal
BRS
Notável GRP/P
SRC211319388 2 1 - 1 - - - 2/6
SRC211319438 6 4 1 - 1 - - 3/6
SRC211319453 4 2 1 - 1 - - 3/6
SRC211319466 3 1 - 1 1 - - 3/6
SRC211319505* 5 1 2 1 1 - - 4/6
SRC211319515 4 2 1 - 1 - - 3/6
SRC211319579 2 1 - - 1 - - 2/6
SRC211319582 5 4 - - 1 - - 2/6
SRC211319584 5 3 - 1 - 1 - 3/6
SRC211319588 1 1 - - - 1/6
SRC211319602 3 - 1 1 1 - - 3/6
SRC211319626 1 1 - - - 1/6
SRC211319632 4 1 3 - - - - 2/6
SRC211319634 3 1 1 - 1 - - 3/6
SRC211319644 3 1 1 - 1 - - 3/6
SRC211319647* 4 1 1 1 1 - - 4/6
SRC211319654* 6 3 1 1 1 - - 4/6
SRC211319674 5 3 2 - - - - 2/6
SRC211319704 2 - - 1 1 - - 2/6
SRC211319708 4 1 2 - 1 - - 3/6
SRC211319722 2 - - 1 1 - - 2/6
SRC211319742 3 1 1 - 1 - - 3/6
SRC211319754 5 4 1 - - - - 2/6
SRC211319764 5 2 2 - 1 - - 3/6
SRC211319793 5 3 - - 2 - - 2/6
SRC211319798 5 2 1 - 2 - - 3/6
SRC211319802 5 4 - - 1 - - 2/6
SRC211319811 2 1 - - 1 - - 2/6
SRC211319815 5 3 1 - 1 - - 3/6
SRC211319833 5 4 - - 1 - - 2/6
PA/Parent3 7 4 1 3 2 1
PA: Number of private alleles per progeny; GRP: Genetic representativeness of the parents in each progeny; 3 PA Parent:
Number of private alleles per parent; *Progenies selected as superior based on genetic representativeness of the parents.
Genetics and Molecular Research 18 (4): gmr18368 ©FUNPEC-RP www.funpecrp.com.br
progenies that exhibited the largest number were SRC211319438 and SRC211319654, with six alleles. The greater the number of private alleles found in a progeny, the more this progeny represents the genetic diversity of its parents, and their identification and selection is of interest to the breeding program because this allows utilization of individuals with a broader genetic base.
DISCUSSION
Recurrent selection is a breeding method that aims increasing the frequency of favorable alleles and of superior genotypes in the population, without reducing genetic variability. The use of molecular diversity information of the recurrent selection populations allows the monitoring of their genetic variability and of potential changes in their genetic base during the selective cycles. This approach enables to increase the mean performance of the populations for the target traits over time, maintaining the genetic variability and ensuring consistent gains during the breeding program.
The phenotypic evaluations for disease resistance were carried out under appropriate conditions of disease occurrence and experimental accuracy, which guaranteed reliability in the obtained results. Anthracnose is a disease with variable distribution in the field because its inoculum dispersal is uneven and irregular (Bianchini et al., 2005). Thus, it is regular to find coefficient of variation above 25% for resistance to anthracnose in the field (Abreu et al., 2003). Angular leaf spot has a more uniform dispersal in the field. Nevertheless, its causal agent has wide genetic variability, which can contribute to an increase in experimental coefficient of variation. Results of coefficient of variation for anthracnose and angular leaf spot similar to these were obtained in studies in field screening trials performed by Bruzi et al. (2007), Couto et al. (2008), and Pereira et al. (2012). For resistance to CBB, there was predominance of experiments with coefficient of variation lower than 20%, similar to that found by Theodoro (2004).
Among the 60 C0S0:2 progenies evaluated, those that stood out for resistance to CBB
also stood out for seed yield, proving to be similar to the resistant control BRS Notável. This indicates a real possibility of direct and indirect gains from selection within the recurrent selection program for resistance to CBB in carioca type common beans conducted by Embrapa. It was possible to select progenies with resistance to CBB, with scores ranging from 3.5 to 4.5 (Table 2), which shown superior resistance than the control Pérola, the current market standard for seed type, which had a score of 6.0. In addition, various progenies exhibited superior response also for resistance to anthracnose, bacterial wilt, angular leaf spot, plant architecture, and tolerance to plant lodging (Table 2). This shows that it is possible to combine resistance to CBB with other important traits in common bean breeding. After analysis of all data, 30 of the progenies (C0S0:3) most promising in regard to combined
agronomic performance in all the locations evaluated were selected.
©FUNPEC-RP www.funpecrp.com.br Genetics and Molecular Research 18 (4): gmr18368
selection of individuals for the next recombination cycle. The contribution and relevance of the use of molecular markers in breeding of common bean has been described by various authors, with emphasis on gains from selection for traits related to both biotic and abiotic stresses (Yu et al., 2000, Miklas et al., 2006; Morais et al., 2016; Oliveira et al., 2008).
Various progenies stood out, exhibiting considerable genetic distances from the others and in comparison with the parents. Genetic distance provides an indication of potential in providing differentiated allele combinations, especially if these progenies also harbor exclusive or private alleles identified in the parents. It is important that the progenies selected for recombination represent the maximum possible variability available in the parents of the base population, aiming to maintaining or expanding genetic variability over the next recurrent selection cycles.
Identification of the progenies with greater representativeness of the parents and with maximum genetic diversity among themselves should optimize selection of resistant and phenotypically complementary genotypes for the genes responsible for genetic control of the target traits, thus generating superior populations in the next selection cycles. Thus, it can be affirmed that identification of private alleles may be a useful strategy to assist recurrent selection programs because it allows estimation of the potential contribution of each parent in the genetic composition of the genotypes and progenies generated and selected for the next recombination cycles.
In cluster analysis, the parents BRS Notável and BRS Pontal exhibited the greatest genetic distance in relation to the 30 progenies analyzed. This result is corroborated by the number of private alleles that each one of them contributed to the formation of the progenies, which was from zero to one private allele, respectively (Table 4). Thus, the greater genetic distance of these parents in relation to the analyzed progenies can be explained by the low representativeness or genetic contribution of these parents to formation of the progenies. This result suggests special attention to the contribution of the parent BRS Notável to the progenies selected in the next recurrent selection cycle. As no private allele of BRS Notável was found in the progenies evaluated, some progenies with high similarity to this parent should be selected. Another option would be to use new molecular markers capable of identifying private alleles of BRS Notável in the evaluations of the next selection cycles. This will ensure its contribution in the genetic composition of the progenies selected in the next cycles, given that this cultivar is considered one of the most resistant to CBB currently on the Brazilian carioca bean market (Pereira et al., 2012).
In our study, the application of microsatellite markers as an auxiliary tool for estimating the genetic relationship of common bean genotypes and the genetic representativeness of parents to thus guide selection of divergent progenies in the sense of strengthening genetic gains in future cycles of the recurrent selection program proved to be useful. In addition to the diversity observed among the progenies, in general, it is in the interest of breeders to select genotypes that have the highest possible number of agronomic traits important for the crop (Elias et al., 2007; Barili et al., 2016). In this study, not only resistance to CBB, but also seed yield and commercial quality of seed are traits of greatest interest.
Genetics and Molecular Research 18 (4): gmr18368 ©FUNPEC-RP www.funpecrp.com.br
priority on the genetic distances of each progeny in relation to the others and on the distance between progenies and parents were SRC211319704, SRC211319742, SRC211319764, SRC211319798, and SRC211319802 (Table 4). Finally, based on the genetic representativeness of the parents, progenies SRC211319505, SRC211319654, and SRC211319647 were selected (Table 4). The intercrossing among all these progenies for the formation of the new base population of the recurrent selection program has potential to unite genetic diversity, resistance to CBB and to other diseases, and seed yield and commercial quality of carioca seeds, ensuring an increase in the frequency of favorable alleles without reducing the variability present in the original population.
The 11 progenies selected exhibited a mean increase of 144 kg.ha-1 in seed yield and an increase in resistance to CBB, indicated by a mean reduction of 0.6 in the CBB score compared to the 60 C0S0:2 progenies evaluated (Table 2). In addition, these progenies also exhibited
satisfactory genetic distance from each other, with mean values ranging from 0.43 to 0.51, and from the parents, with mean values ranging from 0.48 to 0.63 (Table 3). Another criterion of importance was the representativeness of the parents in these 11 progenies, which ranged from two to four parents from a total of six (Table 4). The strategy used in this study was adopted in order to maximize the genetic diversity of the base population in the next recombination cycles and thus maximize the chance of obtaining genetic gains for the diverse traits, especially for seed yield and resistance to CBB, over the next steps of selection of the breeding program.
ACKNOWLEDGMENTS
The authors are grateful to Embrapa Arroz e Feijão, the Universidade Federal de Uberlândia, the Empresa de Assistência Técnica e Extensão Rural de Goiás, Embrapa Milho e Sorgo, and Embrapa Produtos e Mercados for funding, technical and logistic support. L.C. Melo, H.S. Pereira, T.L.P.O. Souza, and A.C.F. Silva acknowledge financial support from CNPq, the Brazilian Council for Scientific and Technological Development.
CONFLICTS OF INTEREST
The authors declare no conflict of interest.
REFERENCES
Abreu AFB, Ramalho MAP, Gonçalves FMA and Mendonça HA (2003). Utilização da produtividade de grãos na seleção para resistência ao Colletotrichum lindemuthianum no feijoeiro. Cienc. Agrotec. 27: 363-369. http://dx.doi.org/10.1590/S1413-70542003000200016
Akhavan A, Bahar M, Askarian H, Lak MR, et al. (2013). Bean common bacterial blight: pathogen epiphytic life and effect of irrigation practices. Sprin. Plus. 2: 41. doi:10.1186/2193-1801-2-41
Amaro GB, Ramalho MAP, Abreu AFB and Silva FB (2007). Phenotypic.recurrent selection in the common bean (Phaseolus vulgaris L.) with carioca-type grains for resistance to the fungi Phaeoisariopsis griseola. Genet. Mol. Biol. 30: 584-588. http://dx.doi.org/10.1590/S1415-47572007000400014
©FUNPEC-RP www.funpecrp.com.br Genetics and Molecular Research 18 (4): gmr18368
Barili LD, Vale NM, Moura LM, Paula RG, et al. (2016). Genetic progress resulting from forty-three years of breeding
of the carioca common bean in Brazil. Genet. Mol. Res. 15: gmr.15038523.
http://dx.doi.org/10.4238/gmr.15038523.
Bruzi AT, Ramalho MAP and Abreu AFB (2007). Desempenho de famílias do cruzamento entre linhagens de feijões andinos e mesoamericanos em produtividade e resistência a Phaeoisariopsis griseola. Cienc. Agrotec. 31: 650-655. http://dx.doi.org/10.1590/S1413-70542007000300008
Bianchini A, Maringoni AC and Carneiro SMTPG (2005). Doenças do feijoeiro (Phaseolus Vulgaris). In: Kimati, H., Amorim, L., Rezende, J.A.M., Bergamin Filho, A. & Carmargo, L. E. A. (eds). Manual de fitopatologia: doenças das plantas cultivadas. Ceres. São Paulo.
Cochran WG (1954). Some methods of strengthening the common x2 tests. Biometrics. 10: 417-451.
http://dx.doi.org/10.2307/3001616
Costa JGC, Melo LC, Pereira HS, Del Peloso MJ, et al. (2011). BRS Esplendor: Common bean cultivar with black grain, upright growth and disease resistance. Crop Breed. Appl. Biotechnol. 11: 276-279. http://dx.doi.org/10.1590/S1984-70332011000300011
Courtois B, Filloux D, Ahmadim N, Noyer JL, et al. (2003). Uso de marcadores moleculares para el manejo de poblaciones de arroz mejoradas mediante selección recurrente. In: Guimarães, E. P. (ed). Mejoramiento poblacional, una alternativa para explorar los recursos genéticos del arroz en américa latina. Cali: Centro Internacional de Agricultura Tropical.
Couto MA, Santos JB and Ferreira JL (2008). Melhoramento do feijoeiro comum com grão tipo carioca, visando resistência à antracnose e à mancha angular. Cienc. Agrotec. 32: 1643-1648. http://dx.doi.org/10.1590/S1413-70542008000500043.
Cruz CD (2013). GENES – a software package for analysis in experimental statistics and quantitative genetics. Acta Sci. Agron. 35: 271-276. http://dx.doi.org/10.4025/actasciagron.v35i3.21251.
Cunha WG, Ramalho MAP and Abreu AFB (2005). Selection aiming at upright growth habit of common bean with carioca type grains. Crop Breed. Appl. Biotechnol. 5: 379-386. http://dx.doi.org/10.12702/1984-7033.v05n04a02 Del Peloso MJ, Melo LC, Faria LC, Costa JGC, et al. (2004). BRS Pontal: new common bean cultivar with Carioca grain
type. Crop Breed. Appl. Biotechnol. 4: 369-371. . http://dx.doi.org/10.1590/S1984-70332010000400015
Denardin ND and Agostini VA (2013). Detection and quantification of Xanthomonas axonopodis pv. phaseoli and its variant fuscans in common bean seeds. J. Seed Sci. 35: 428-434. http://dx.doi.org/10.1590/S2317-15372013000400003
Duncan RW, Singh SP and Gilbertson RL (2007). The dilemma of recurrent backcrossing for introgressing common bacterial blight resistance in common bean. Annu. Rep. Bean Improv. Coop. 50: 105-106.
Elias HT, Vidigal MCG, Gonela A and Vogt GA (2007). Variabilidade genética em germoplasma tradicional de feijão-preto em Santa Catarina. Pesq. Agropec. Bras. 42: 1443-1449. http://dx.doi.org/10.1590/S0100-204X2007001000011.
Embrapa (2018). Dados conjunturais do feijão (área, produção e rendimento) (Phaseolus vulgaris L.) no Brasil. Available at [http://www.cnpaf.embrapa.br/socioeconomia/index.htm]. Assessed 16 Jan. 2019.
Faria LC, Melo PGS, Pereira HS, Del Peloso MJ, et al. (2013). Genetic progress during 22 years of improvement of carioca-type common bean in Brazil. Field Crops Res. 142: 68-74. https://doi.org/10.1016/j.fcr.2012.11.016 Filippi CV, Aguirre N, Rivas JG, Zubrzycki J, et al. (2015). Population structure and genetic diversity characterization of
a sunflower association mapping population using SSR and SNP markers. BMC Plant Biol. 15: 1-12. https://doi.org/10.1186/s12870-014-0360-x
IAPAR (2016a). Folhetos IPR Juriti. Available at [http://www.iapar.br/arquivos/File/folhetos/iprjuriti/iprjuriti.html]. Accessed 19 Apr 2019.
IAPAR (2016b). Folhetos IPR Siriri. Available at [http://www.iapar.br/arquivos/File/folhetos/iprsiriri/iprsiriri.html]. Accessed 19 Apr 2019.
Leite ME, Figueiredo ICR, Dias JA, Alves FC, et al. (2017). Reaction of common bean lines derived from recurrent selection for white mold resistance and aggressiveness of Sclerotinia sclerotirum isolates. Biosci. J. 33: 1177-1187. https://doi.org/10.14393/BJ-v33n5a2017-36779
Liu J, Liu L, Hou N, Zhang A and Liu C (2007). Genetic diversity of wheat gene pool of recurrent selection assessed by microsatellite markers and morphological traits. Euphytica. 155: 249-258. https://doi.org/10.1007/s10681-006-9326-x
Maringoni AC and Lauretti RLB (1999). Reação de genótipos de feijoeiro comum a Fusarium oxysporum f.sp. phaseoli,
Macrophomina phaseolina e Xanthomonas campestris pv. phaseoli. Pesq. Agropec. Bras. 34: 535-532. http://dx.doi.org/10.1590/S0100-204X1999000400004.
Melo LC (2009). Procedimentos para condução de experimentos de valor de cultivo e uso em feijoeiro comum. Santo Antônio de Goiás: Embrapa Arroz e Feijão.
Genetics and Molecular Research 18 (4): gmr18368 ©FUNPEC-RP www.funpecrp.com.br Morais SRP, Vieira AF, Almeida LCS, Rodrigues LA, et al. (2016). Application of microsatellite markers to confirm
controlled crosses and assess genetic identity in common bean. Crop Breed. Appl. Biotechnol. 16: 234-239. http://dx.doi.org/10.1590/1984-70332016v16n3n35
Oliveira LK, Melo LC, Brondani C, Peloso MJ, et al. (2008). Backcross assisted by microsatellite markers in common bean. Genet. Mol. Res. 7: 1000-1010. http://dx.doi.org/10.4238/vol7-4gmr478
Pereira HS, Almeida VM, Melo LC, Wendland A, et al. (2012a). Influência do ambiente em cultivares de feijoeiro-comum em cerrado com baixa altitude. Bragantia. 71: 165-172. http://dx.doi .org/10.1590/S0006-87052012005000024
Pereira HS, Wendland A, Melo LC, Del Peloso MJ, et al. (2012b). BRS Notável: a medium-early-maturing, disease-resistant Carioca common bean cultivar with high yield potential. Crop Breed. Appl. Biotechnol. 12: 220-223. http://dx.doi.org/10.1590/S1984-70332012000300010.
Pereira LA, Abreu AF, Vieira Júnior IC, Pires LP, et al. (2017). Genetic progress estimation strategy for upright common bean plants using recurrent selection. Genet. Mol. Res. 16: gmr16019494.
Pimentel-Gomes F (2009). Curso de Estatística Experimental (15th ed.). Piracicaba: Esalq.
Presciuttini S, Toni C, Tempestini E, Verdiani S, et al. (2002). Inferring relationships between pairs of individuals from locus heterozygosities. BMC Genet. 20: 3-23. . https://doi.org/10.1186/1471-2156-3-23
Ramalho MAP, Abreu AFB, Santos PSJ (1998). Interações genótipos x épocas de semeadura, anos e locais na avaliação de cultivares de feijão nas Regiões sul e Alto Paranaíba em Minas Gerais. Cienc. Agrotec. 22: 176-181.
Ramalho MAP, Abreu AFB and Santos JB (2005). Genetic progress after four cycles of recurrent selection for yield and grain traits in common bean. Euphytica. 144: 23-29. https://doi.org/10.1007/s10681-005-5694-x
Schaad NW, Postnikova E, Lacy G, Sechler A, et al. (2006). Emended classification of xanthomonad pathogens on citrus. Syst. Appl. Microbiol. 29: 690-695. http://dx.doi.org/10.1016/j.syapm.2006.08.001
Silva FB, Ramalho MAP and Abreu AFB (2007). Seleção recorrente fenotípica para florescimento precoce de feijoeiro 'Carioca'. Pesq. Agropec. Bras. 42: 1437-1442. http://dx.doi.org/10.1590/S0100-204X2007001000010.
Silva GS, Ramalho MAP, Abreu AFB and Nunes JAR (2010). Estimation of genetic progress after eight cycles of recurrent selection for common bean grain yield. Crop Breed. Appl. Biotechnol. 10: 351-356. http://dx.doi.org/10.1590/S1984-70332010000400010.
Singh SP and Miklas PN (2015). Breeding common bean for resistance to common blight: a review. Crop Sci. 55: 971-984. https://doi.org/10.2135/cropsci2014.07.0502
Tar’an B, Michaels TE and Pauls KP (2001). Mapping genetic factors affecting the reaction to Xanthomonas axonopodis
pv. phaseoli in Phaseolus vulgaris L. under field conditions. Genome. 44: 1046–1056. https://doi.org/10.1139/g01-099
Theodoro GF (2004) Reação de cultivares locais de feijão a Xanthomonas axonopodis pv. Phaseoli, em condições de campo. Rev. Bras. Agric. 10: 373-375. http://dx.doi.org/10.18539/cast.v10i3.976
Vauterin L, Hoste B, Kersters K and Swings J (1995). Reclassification of Xanthomonas. Int J. Syst. Bacteriol. 45: 472-489. https://doi.org/10.1099/00207713-45-3-472
Wendland A, Melo LC, Del Peloso, MJ, Costa JGC, et al. (2008). Differential interaction of Xanthomonas axonopodis pv. phaseoli isolates and common beans genotypes. Annu. Rep. Bean Improv. Coop. 51: 206-207.
Wright S (1978). Evolution and Genetics of Populations. University of Chicago, Chicago.
Yu K, Park S and Poysa V (2000). Marker-assisted selection of common beans for resistance to common bacterial blight: Efficacy and economics. Plant Breed. 119: 411-415. https://doi.org/10.1046/j.1439-0523.2000.00514.x
Xin Z, Velten JP, Oliver MJ and Burke JJ (2003). High-Throughput DNA Extraction Method Suitable for PCR.