1
Department of Physics, College of Applied & Industrial Sciences, University of Bahri, Khartoum, Sudan
2
Department of Physics, College of Science- Sudan University of Science &Technology, Khartoum-Sudan
3
International University of Africa- College of Science-Department of Physics & Sudan University of Science
&Technology-College of Science-Department of Physics- Khartoum-Sudan
ARTICLE INFO
ABSTRACT
In this work we used powder of Aluminum hydroxide AL(OH)3 and the solution of iodine as doping
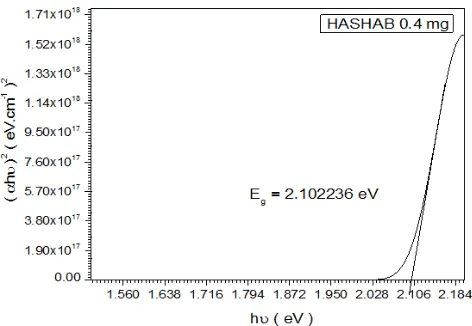
materials for two type of Arabic Gum(Talha and Hashab ) with different in concentration and doping rate. The samples were heated first then pressed to act as p-type sheet. The energy gap at Talha was 3 eV as maximum when doping rate was 0.8% and concentration was 0.8mg/L while Hashab the maximum energy gap was 2.199700 eV when the doping rate was 0.2% and concentration was 0.2 mg/L. These new materials for doping semiconductor Arabic Gum shows many interesting properties. Talha Gum get regular increasing of energy gap related to increase in concentration and doping rate. While the Hashab get the random increasing of Energy gap related to decrease in concentration and doping rate ; It was observed that the different concentration of the samples confirmed the reason for the band gap shifts in addition to active Aluminum properties that increased energy gap.
Copyright © 2016Sawsan Ahmed Elhouri Ahmed et al.This is an open access article distributed under the Creative Commons Attribution License, which permits
unrestricted use, distribution, and reproduction in any medium, provided the original work is properly cited.
INTRODUCTION
A semiconductor is a substance, usually a solid chemical element or compound that can conduct electricity under some conditions but not others, making it a good medium for the control of electrical current. Its conductance varies depending on the current or voltage applied to a control electrode, or on the intensity of irradiation by infrared (IR), visible light, ultraviolet (UV), or X rays. The specific properties of a semiconductor depend on the impurities, or dopants, added to it. An N-type semiconductor carries current mainly in the form of negatively-charged electrons, in a manner similar to the conduction of current in a wire. A P-type semiconductor carries current predominantly as electron deficiencies called holes. A hole has a positive electric charge, equal and opposite to the charge on an electron. In a semiconductor material, the flow of holes occurs in a direction opposite to the
flow of electrons (Bell et al., 2008 and Bubnova et al., 2011).
Doping is the process of adding impurities to intrinsic semiconductors to alter their properties. Normally Trivalent and Pentavalent elements are used to dope Silicon and Germanium. When an intrinsic semiconductor is doped with
*Corresponding author: Sawsan Ahmed Elhouri Ahmed
Department of Physics, College of Applied & Industrial Sciences, University of Bahri, Khartoum, Sudan
trivalent impurity it becomes a P-Type semiconductor (Gregg
et al., 2004 and Kim et al., 2012). The P stands for Positive,
which means the semiconductor is rich in holes or Positive charged ions. When we dope intrinsic material with Pentavalent impurities we get N-Type semiconductor, where N stands for Negative. N-type semiconductors have Negative charged ions or in other words have excess electrons.
EXPERIMENTAL SETUP
MATERIALS AND METHODS
-Two types of Arabic Gum (Talha, Hashab) -Aluminum
hydroxide AL (OH) 3, -Water -Solution of Iodine, -Furnace,
Manual pressing device and -USB2000 Fiber Optic Spectrometer.
USB2000 Fiber Optic Spectrometer
The USB2000 Spectrometer connects to a notebook or desktop PC via USB port or serial port. When connected to the USB port of a PC, the USB2000 draws power from the host PC, eliminating the need for an external power supply (Kim, 2011 and Xia, 2012).
Article History:
Received 17th August, 2016
Received in revised form
24th September, 2016
Accepted 20th October, 2016
Published online 30th November, 2016
Key words:
Talha, Hashab (local plants), Gum Arabic,
Fig. a. Ocean Optics USB2000 Fiber Optic Spectrometer
Method I
How Sampling Works
The following list explains the function of Ocean Optics sampling components in the sampling process:
The user stores reference and dark measurements to
correct for instrument response variables.
The light from the light source transmits through an
optical fiber to the sample.
The light interacts with the sample.
Another optical fiber collects and transmits the result of
the interaction to the spectrometer.
The spectrometer measures the amount of light and
transforms the data collected by the spectrometer into digital information.
The spectrometer passes the sample information to
OOIBase32.
OOIBase32 compares the sample to the reference
measurement and displays processed spectral
information.
Fig. b. USB2000 Spectrometer with Components
Method II
Samples of Arabic Gum was dissolved, lending in water each of them separately and added to a solution of iodine and AL
(OH) 3 powder in different concentrations and then placed in
Petri dishes and exposing the samples by furnace to a
temperature up to 300OC degrees and then formed in the form
of tablets by using manual pressing device and got 4 samples of each type and put discs in the USB2000device, and read the results of energy gap for all samples.
Fig (C) shown the tablet of Arabic Gum doped by active
Aluminum AL+3 using USB2000 device to take the energy gab
Readings
RESULTS
Was calculated the energy gap of all sample of doping Arabic Gum with iodine according to the samples that came from Hashab and Talha and the results were as shown in the fig (1 to 8)
Table 1. Relationships between energy gap and doping concentration of Talha Gum
No of samples Doping % Concentration
of Talha (mg/L)
Energy gap(eV)
Sample 1 0.2 0.2 1.6365
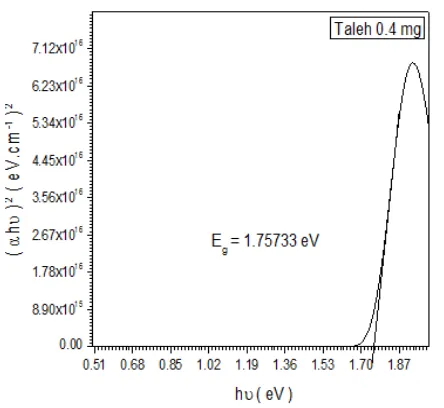
Sample 2 2.4 2.4 1.75733
Sample 3 0.6 0.6 2.06900
Sample 4 0.8 0.8 3.00000
Table 2. Relationship between energy gap and doping concentration of Hashab Gum
No of samples Doping % Concentration of
Talha (mg/L)
Energy gap(eV)
Sample 1 0.2 0.2 2.199700
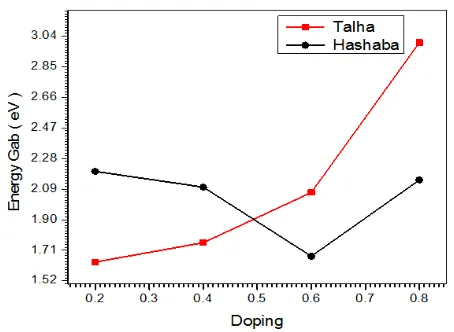
Sample 2 2.4 2.4 2.102236
Sample 3 0.6 0.6 1.672900
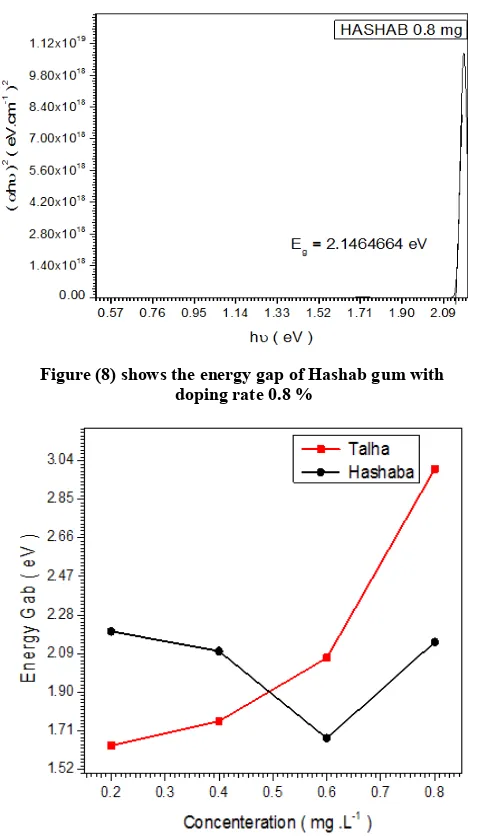
Sample 4 0.8 0.8 2.146466
Figure 2. Shows the energy gap of Talha gum with doping rate 0.4 %
Figure 3. Shows the energy gap of Talha gum with doping rate 0.6 %
Figure 4. Shows the energy gap of Talha gum with doping rate 0.8 %
Figure 5. Show the energy gap of Hashab gum with doping rate 0.2 %
Figure 6. Shows the energy gap of Hashab gum with doping rate 0.4 %
Figure (8) shows the energy gap of Hashab gum with doping rate 0.8 %
Figure 9. Shows the Variation of concentration and Energy Gab for Hashab and Talha GUM
Figure 10. Shows the Variation of doping and Energy Gab for Hashab and Talha GUM
RESULTS
Was calculated the energy gap of all sample of doping Arabic Gum with iodine according to the samples that came from Hashab and Talha and the results were as shown in the fig (1 to 8).
Figure 1a. from table 1 shows the energy gap of Talha gum with doping rate 0.2%
Figure 2a. From table 2 shows the energy gap of Talha gum with doping rate 0.4 %
Figure 3a. From table 1 shows the energy gap of Talha gum with doping rate 0.6 %
DISCUSSION
The optical energy gap (Eg) of grop one (Talha Gum)
The optical energy gap (Eg) has been calculated by the relation
(αhυ)2 = B(hυ – Eg) where (B) is constant. By plotting (αhυ)2
Figure 4a. From table 1 shows the energy gap of Talha gum with doping rate 0.8 %
Figure (1-b) from table 2 shows the energy gap of Hashab gum with doping rate 0.2 %
Figure 2b. From table 2 shows the energy gap of Hashab gum with doping rate 0.4 %
Figure 3b. From table 2shows the energy gap of Hashab gum with doping rate 0.6 %
Figure 4b. From table 2 shows the energy gap of Hashab gum with doping rate 0.8 %
Figure 6. Shows the Variation of doping and Energy Gab for Hashab and Talha GUM
The value of the energy gap has been calculated In fig (1-b) was obtained by Talha 0.2% was 1.6365 eV. as Shown in fig(2-b) energy gap has been calculated for Hashab 0.4% was
1.75733 eV and The optical energy gap (Eg) has been
calculated when using Hashab0.6 as shown in fig.(3-b ) was 2.06900 eV and the energy gap for Talha 0.8% as shown in
fig(4-a ) was 3.00000 eV. In this Talha group the value of Eg
was increased from 1.6365 eV to 3.00000 eV. The increasing
of Eg related to increase in concetration and doping of
samples. It was observed that the different concetration of the samples confirmed the reason for the band gap shifts also.
Conclusion
*Were prepared tablets of Arabic Gum and iodine doped by aluminum hydroxide AL(OH)3 were introduced in USB2000 device where it was knowing the energy gap in Talha Gum
;highest energy gap was 3.0000 eV when the doping rate was
0.8 % and the concentration of Talha was 0.8 mg / L. In
Hashab Gum the highest energy gap was 2.199700 eV when the doping rate was 0.2 % and the concentration of Hashab was 0.2 mg / L.
*The work done shows that increasing of doping rate lead to
regular increasing of Eg.
REFERENCES
Bell, L. E. 2008. Cooling, heating, generating power, and recovering waste heat with thermoelectric systems. Science 321, 1457–1461.
Bubnova, O. et al. 2011. Optimization of the thermoelectric
figure of merit in the conducting polymer poly(3,4-ethylenedioxythiophene). Nature Mater. 10, 429–433. Gregg, B. A., Chen, S. & Cormier, R. A. 2004. Coulomb
forces and doping in organic semiconductors. Chem. Mater. 16, 4586–4599.
Kim, G-H. & Pipe, K. P. 2012. Thermoelectric model to characterize carrier transport in organic semiconductors. Phys. Rev. B 86, 085208.
Kim, Y. et al. 2011. Highly conductive PEDOT:PSS
electrodes with optimized solvent and thermal post-treatment for ITO-free organic solar cells. Adv. Funct. Mater. 21, 1076–1081.
Xia, Y., Sun, K. & Ouyang, 2012. J. Solution-processed metallic conducting polymer films as transparent electrode
of 9optoelectronic devices. Adv. Mater. 24, 2436–2440