http://www.ijcmph.com pISSN 2394-6032 | eISSN 2394-6040
Original Research Article
A study assessing patient satisfaction in otolaryngology OPD of a
district medical college of West Bengal
Shamima Yasmin, Tanmay Kanti Panja*, Baijayanti Baur
INTRODUCTION
Patient satisfaction can be defined as the extent to which the patients feel that their needs and expectations are being met by the service provided.1 Satisfaction of the patients with health care services largely determines treatment compliance, thereby enhancing efficacy of medical treatment.
The practice and system of medicine has evolved over centuries. In developing countries like India, where the government takes up the responsibility of providing free medical care to those who are unable to afford it, expectations can be less.
Patients and their relatives now coming to the hospital not only expect best treatment, but also other facilities to make their stay comfortable in the hospital. This change in expectation has come due to tremendous growth of media and its exposure, as well as commercialization and improvement in facilities.2 Poor communication with physicians, lack of empathy, and the chronicity of many of the disorders lead to dissatisfaction.3
Clearly, feedback from patients is vital if deficiencies are to be identified and improvements to be achieved for a timely, efficient, and patient-centered delivery of quality health care.
ABSTRACT
Background: Patient satisfaction is perhaps is a proxy indicator to measure the success of a hospital.The aim of this
study was to evaluate the level of patient satisfaction among patients attending Otorhinolaryngology outpatient department (OPD) of a tertiary care teaching hospital in a district.
Methods: Cross-sectional observational study among 230 patients attending Otorhinolaryngology outpatient
department (OPD) of a tertiary care teaching hospital in a district using a modified validated Bengali questionnaire. Analysis of results was done by percentage and proportion.
Results: Overall satisfaction was above 60% for only 42.6% of patients. Major dissatisfaction was with the
registration system. 50.4% were dissatisfied for waiting at the queue of registration counter to get OPD ticket. Other causes of dissatisfaction were infrastructure e.g. non-availability of adequate seating arrangement (39.6%), fans (58.7%), non-availability of drinking water (71.7%). 78.3% were dissatisfied for the available washroom facilities. However 92% were satisfied by attention paid by doctors.
Conclusions: The present study was an attempt to assess the level of satisfaction of the patients. It highlights maintaining privacy during history taking examination and improving infrastructure like drinking water and washroom facilities, improving registration system to decrease waiting time can improve patient satisfaction which can be easily done with help of stakeholders.
Keywords: Patient, Satisfaction, Morbidities, Service, Quality
Department ofCommunity Medicine, Midnapore Medical College, Paschim medinipur, West Bengal, India
Received: 30 December 2018
Accepted: 02 February 2019
*Correspondence: Dr. Tanmay Kanti Panja,
E-mail: [email protected]
Copyright: © the author(s), publisher and licensee Medip Academy. This is an open-access article distributed under
the terms of the Creative Commons Attribution Non-Commercial License, which permits unrestricted non-commercial use, distribution, and reproduction in any medium, provided the original work is properly cited.
Patient satisfaction is perhaps is a proxy indicator to measure the success of a hospital. It is an important and commonly used indicator for measuring the quality in health care. It can affect the clinical outcomes, patient retention, and medical malpractice claims.
With this in mind the following study was conducted. The aim of this study was to evaluate the level of patient satisfaction among patients attending otorhino-laryngology outpatient department. OPD of a tertiary care teaching hospital in a district and feedback from them for improvement of the same.
METHODS
Study design and setting
This was a cross-sectional hospital based observational, descriptive type of study conducted from 01.04.18 to 30.04.18 at otorhinolaryngology OPD of a district hospital.
Study units and participants
All the new patients attending the otorhinolaryngology OPD during our data collection period were included in this study. Severely ill patients and those who did not consented were excluded.
Sample size and sampling technique
Sample size: 230. Sampling technique
Sample design was based on a study conducted in North East India in 2017, which showed that the prevalence of patient satisfaction was 32.5%.4 Applying formula n=z² pq/L2, z=1.96,(95% confidence interval) taking allowable error of 20% (relative precision) and taking 10% nonresponse rate, the final sample size came out to be 229. Hence total 230 patients were interviewed.
Data collection
Study tools
Pre-designed, Pre-tested, semi-structured interview schedule for socio-demographic and socio-economic status. Modified validated Bengali version of the questionnaire developed by the department of health and family welfare West Bengal was used to assess patient satisfaction.
Study technique
Exit interview of the patients were taken in the otorhinolaryngology OPD of a district hospital.
Inclusion criteria
All the new patients attending the otorhinolaryngology OPD during our data collection period were eligible to be included in this study.
Exclusion criteria
Severely ill patients, patients not willing to participate, patients/relative of patients who were working in the said hospital at the time of data collection, person below the age of 18.
Methods for assessing levels of patient satisfaction
There are 13 questions to ascertain level of satisfaction. In each question patients were asked to give a score from 1 to 5, 1 being poor and 5 being excellent score.
Person giving score <3 were considered dissatisfied and ≥3 were considered satisfied.
To ascertain overall satisfaction, percentage was calculated upon the total score i.e. (13×5=65). The total score decreased in patients where some questions were not applicable for e.g. Patients not requiring laboratory tests. Their total score was 12×5=60.
Statistical analysis
Data were entered into an MS Excel sheet. Data were analyzed by appropriate statistical techniques. Tables and diagrams were constructed.
Ethical issues and necessary approval
The study obeyed the ethical standards for an observational study and approved by the Institutional Ethics Committee, Informed written consent was obtained from each of the study participant.
RESULTS
A total of 230 patients were interviewed. Table 1 denotes the socio-demographic profiles of the study population. The mean age of the participants was 33.4±12.2 years (median 30 years). Range varied from 18 to 80 years. Most of them were in the age group 18-30 years. 143 were male (37.8%), 71.4% were hindus. 24.3% were unemployed. 23.9% were home makers. 16.9% were illiterates and only 28% had education above higher secondary. Majority of the participants were hailing from lower middle socioeconomic class as per modified BG Prasad socio economic scale January 2018.4
Overall satisfaction was above 60% for only 42.6% of patients.
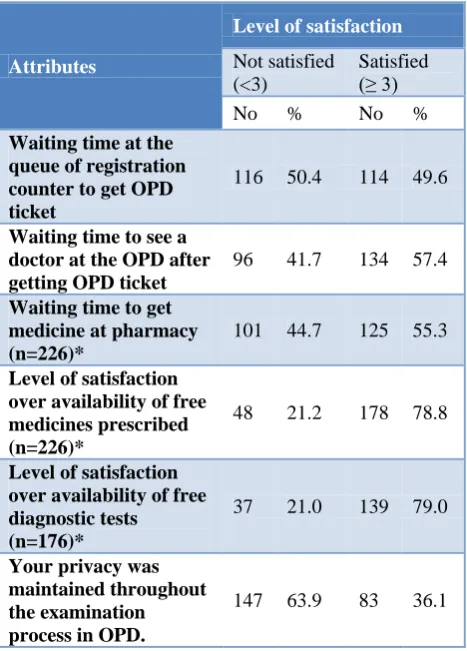
Major dissatisfaction was with the registration system. 50.4% patients of our study population were dissatisfied for waiting at the queue of registration counter to get OPD ticket and 41.7% were dissatisfied for waiting to see a doctor at the OPD after getting OPD ticket. 44.7% were dissatisfied for waiting to get medicine at pharmacy. 63.9% were unhappy because their privacy was not maintained throughout the examination process in OPD.
Table 1: Distribution of study population according to their socio demographic profile.
Variables No %
Age
18-30 118 51.3 31-60 101 43.9 >60 11 4.8
Sex Male 143 62.2
Female 87 37.8
Religion Hindu 164 71.4
Muslim 66 28.6
Place of residence Rural 186 80.8
Urban 44 19.1
Marital status
Unmarried 76 33.0 Married 153 66.6 Widow-widower 01 0.4
Literacy status
Illiterate 39 16.9 Up to primary 60 26.1 Primary to higher
secondary 105 28.8 More than higher
secondary 65 28.2
Occupation
Unemployed 56 24.3 Unskilled labour 54 23.5 Skilled 38 16.6 Service holder 6 2.6 Business 20 8.7 Professional 1 0.4 Home maker 55 23.9
Socioeconomic status
Upper class 6 2.6 Upper middle class 31 13.5 Middle class 56 24.3 Lower middle class 85 36.9 Lower class 52 22.6
Table 3 shows the level of satisfaction w.r.t infrastructure. 39.6% and 58.7% were unhappy for non-availability of adequate seating arrangement and fans respectively. 71.7 were dissatisfied regarding availability of drinking water. 78.3 were dissatisfied for the available washroom facilities.
In Table 4 we find 92% were satisfied by attention paid by doctors. Regarding behavior of hospital staff 88.7% patients were satisfied. 71.3% patients said their medicines were clearly explained by the pharmacist. Table 5 shows for most patients 43% overall satisfaction was in the range of 51-60%.
Table 2: Distribution of study population according to satisfaction with respect to services available
(n=230).
Attributes
Level of satisfaction
Not satisfied (<3)
Satisfied (≥ 3) No % No % Waiting time at the
queue of registration counter to get OPD ticket
116 50.4 114 49.6
Waiting time to see a doctor at the OPD after getting OPD ticket
96 41.7 134 57.4 Waiting time to get
medicine at pharmacy (n=226)*
101 44.7 125 55.3 Level of satisfaction
over availability of free medicines prescribed (n=226)*
48 21.2 178 78.8
Level of satisfaction over availability of free diagnostic tests
(n=176)*
37 21.0 139 79.0
Your privacy was maintained throughout the examination process in OPD.
147 63.9 83 36.1
*Number of participant changes as service not availed.
Table 3: Distribution of study population according to satisfaction with respect to infrastructure level
(n=230).
Attributes
Level of satisfaction
Not satisfied (<3)
Satisfied (≥ 3) No % No % Availability of seating
arrangements 91 39.6 139 60.4
Availability of drinking
water 165 71.7 65 28.3
Availability of fan 135 58.7 95 41.3
Availability of
Table 4: Distribution of study population according to their satisfaction with respect to behavior of health
care professionals (n=230).
Level of satisfaction
Attributes
Not satisfied (<3)
Satisfied (≥ 3)
No % No %
Level of satisfaction over proper attention given by doctors at OPD.
17 7.4 213 92.6
Level of satisfaction over behavior of hospital staff at registration counter.
26 11.3 204 88.7
Directions for taking all the medicines being clearly explained by the pharmacist clear enough to be
understood (n=226)*.
62 27.4 164 72.6
*Number of participant changes as service not availed.
Table 5: Showing overall satisfaction of patients with services at otorhinolaryngology OPD (n=230).
Overall satisfaction (%) No. of patients %
≤50 33 14.3
51-60 99 43.0
61-70 84 36.5
71-80 13 5.7
>80 01 0.4
Total 230 100.0
DISCUSSION
This study was conducted to assess the patient satisfaction with respect to services provided by the department of otolaryngology head and neck surgery (ENT) outpatient department of a district medical college. Patient satisfaction studies are very common in the developed countries but in developing countries there are very few studies. Patients are the end consumers of the health care services and their satisfaction is the key factor in determining utilization.
The present study revealed that overall satisfaction above 60% was present for only for 42.6% patients which are quite less in comparison to other similar studies. In a study conducted by Shrestha in Nepal Medical College the overall satisfaction among patients in ENT OPD was 74.8%.6 Qadri et al revealed overall patient satisfaction of 89.1% in rural Haryana among indoor and outdoor
patients of his institute.7 Jain A reported the overall satisfaction in a tertiary care institute to be 73% in Lucknow.8 Deva et al in Kashmir reported 80%.9 A study by Rizyal reported an overall satisfaction of 76.8% among patients attending eye OPD of NMCTH whereas Gurung et al reported 74% patient satisfaction in a tertiary eye care centre in Kathmandu.10,11
This variation can be due to different study settings, perceptions and expectations of the people and different study tools.
In the present study one of the major causes of dissatisfaction was with the registration system 50.4% were dissatisfied for waiting at the queue of registration counter to get OPD ticket also true for other studies. Jadhav reported 54.8% participants found that the time required for registration was inconvenient for them.12 Reduction of the waiting time by triage of the patients and sending them to the appropriate doctor would save their time and also provide appropriate treatment. The waiting time and area could also be utilized to provide health education to the people as suggested by Kumari.13 Another major concern was in availability of basic infrastructure non-availability of adequate seating arrangement (39.6%) whereas a study conducted by Jadhav et al in out-patient department of Government medical college, Miraj, district Sangli reported that 70.57% satisfied with seating arrangement in OPD.12 Other issues were availability of fans (58.7%), non-availability of drinking water (71.7%).
78.3% were dissatisfied for the available washroom facilities which are quite similar to other studies. Study by Kumari also showed the dissatisfaction was 45.7% for availability of drinking water and (37.4%) for toilet facilities. Sivalenka and Lerttrakarnnon et al who also found these as the major areas of concern in their study.
13-15
63.4% patients were satisfied with the lab facilities in the study of Nepal.6 In the present study 79% were satisfied with free diagnostics available.
72.6% were satisfied with the directions for taking all the medicines, being clearly explained by the pharmacist clear enough to be understood A proper drug dispensing system may help the patients overcome the dissatisfaction regarding the form and duration of the drugs to prevent noncompliance as well as avoid grave consequences of the medication errors.
enhance the level of satisfaction of the patients, considering the fact that most of the patients were drawn to the health facility because of their faith.5,7 The cost effectiveness of the services provided would also go a long way to maintain the bond between the doctors and the patient for the achievement of the optimal level of health of the people.
CONCLUSION
The present study was an attempt to assess the level of satisfaction of the patients with the various aspects of health care. Very few similar studies have been done and therefore we lack the data for comparison. Yet, the findings of the survey are quite helpful if they are transformed into actions for improving the quality of health care. The study was able to find out certain highlighting points like maintaining privacy during history taking examination and improving infrastructure like drinking water and washroom facilities can improve patient satisfaction which can be easily done with help of stakeholders by giving them proper feedback and also by increasing awareness.
Limitations of the study
In the present study, all patients were interviewed so there may be subjective variation or conscious falsification which cannot be verified. Cause of dissatisfaction could not be explored.
Funding: No funding sources Conflict of interest: None declared
Ethical approval: The study was approved by the Institutional Ethics Committee
REFERENCES
1. Iftikhar A, Allah N, Shadiullah K. Predictors of patient satisfaction. Gomal J Med Sci. 2011;9:183-8.
2. Mishraa PH, Gupta S. Study of patient satisfaction in a surgical unit of a tertiary care teaching hospital. J Clin Orthop Trauma. 2012;3(1):43–7.
3. Prakash B. Patient Satisfaction. J Cutan Aesthet Surg. 2010;3(3):151–5.
4. Rajkumari B, Nula P. Patient's satisfaction with care in a government health facility in North East India: A cross-sectional study. J Med Society. 2017;31(2):94-8.
5. Pandey V, Agarwal P. Modified BG Prasad's Socio-economic Classification-2018: The need of an update in the presnrt scenario. Indian J Community Health. 2018;30(1):82-4.
6. Shrestha KK, Jha AK, Joshi RR. Assessment of ENT outpatient department services at a tertiary care centre: The patients’ perspective. Nepal Med Coll J. 2015;17(1-2): 31-5.
7. Qadri SS, Pathak R, Singh M, Ahluwalia. Patient satisfaction with services obtained from a tertiary care hospital in Rural Haryana. Int J Collaborative Res Internal Med & Public Health. 2012;4:1524-37. 8. Jain A, Mishra N. A study to assess patient
satisfaction in outpatient department of a tertiary care hospital in north India. Int J Community Med Public Health. 2016;3(1):328-34.
9. Deva SA, Haamid M, Naqishbandi JI, Kadri SM, Khalid S, Thakur N. Patient satisfaction survey in outpatient department of a tertiary care institute. J Community Med. 2010;6:18-22.
10. Rizyal A. Patients’ satisfaction with eye care services at Nepal Medical College. Nepal Med Coll J. 2012;14:172-5.
11. Gurung K, Baniya B, Rai N. Patient’s perception towards the eye health care system in a tertiary eye care centre in Nepal. Nepal Med Coll J. 2006;8:115-7.
12. Jadhav SB, Lokhande GS, Naik JD. Measuring patient satisfaction towards quality of outpatient care: a part of Health Systems Research. Int J Recent Trends Sci Tech. 2011;1(3):96-103.
13. Kumari R, Idris MJ, Bhusan V. Study on Patient Satisfaction in the Government Allopathic Health Facilities of Lucknow District. IJCM. 2018;47(11):198-219.
14. Patient satisfaction surveys in public hospitals in India. Available at: https://cdn1.sph.harvard.edu/ wpcontent/uploads/sites/114/2012/10/RP203abstract .pdf. Accessed on 15 November 2018.
15. Peerasak L, Surasak B, Pattanawadi U. Patient satisfaction on health service at the family medicine learning centers. Chiang Mai Med Bull. 2004;43:67-76.
Cite this article as: Yasmin S, Panja TK, Baur B.
A study assessing patient satisfaction in