Original Research Article
Time series analysis of dengue cases reporting to a tertiary care hospital
Ravindra S. Kembhavi, Saurabha U. S.*
INTRODUCTION
Climate is closely associated with health. Climate change affects the social and environmental determinants of health - clean air, sanitation, drinking water, sufficient food and secure shelter. It is expected that in near future climate change can cause approximately 250000 additional deaths per year, from malnutrition, malaria, diarrhoea and heat stress. Climate change can also lead to natural disaster and variable rainfall patterns like flood/deluge. This can heighten the risk of water-borne diseases and create breeding grounds for disease carrying insects such as mosquitoes.1 The climate change along with many other non-environmental factors does play a role in the changing incidence of vector borne diseases.
Dengue is a vector borne disease whose incidence has grown dramatically around the world. It has become a major international public health concern. Dengue is endemic in more than 100 countries and causes some 50 to 100 million new infections. The WHO regions
South-east Asia and Western Pacific are the most seriously affected. The epidemiology of dengue in India was first reported in Madras in 1780, and the first outbreak occurred in Calcutta in 1963, and then on outbreaks has been reported from different parts of India.2 The risk of dengue in India is increasing due to rapid urbanization, lifestyle changes and deficient water management leading to proliferation of mosquito breeding sites. The disease has been showing an increasing trend. Dengue is currently a notifiable disease in India.3
Dengue is a viral vector borne infection caused by dengue virus, the virus belongs to the genus Flavivirus. The virus has four distinct serotypes (DEN-1, DEN-2, DEN-3 and DEN-4), distinct genotypes have been identified within each serotype.4 All four serotypes cause full spectrum of disease from subclinical infection to mild self limiting disease, the dengue fever (DF) and a severe disease that may be fatal, the dengue haemorrhagic fever/dengue shock syndrome (DHF/DSS).5 The disease has been grouped under Neglected tropical diseases along ABSTRACT
Background: Dengue fever is a major public health problem, the concern is high as the disease is closely related to climate change.
Methods: This was a retrospective study, conducted for 1 year in a tertiary care hospital in the city of Mumbai. Data of Dengue cases and climate for the city of Mumbai between 2011 and 2015 were obtained. Data was analysed using SPSS- time series analysis and forecasting model.
Results: 33% cases belonged to the 21-30 years, proportion of men affected were more than women. A seasonal distribution of cases was observed. A strong correlation was noted between the total number of cases reported and (a) mean monthly rainfall and (b) number of days of rainfall. ARIMA model was used for forecasting.
Conclusions: The trend analysis along with forecasting model helps in being prepared for the year ahead.
Keywords: Dengue, Time series, Forecast, Seasonal trend, Climate change
Department ofCommunity Medicine, Seth G S Medical College and KEM Hospital, Mumbai, Maharashtra, India
Received: 01 March 2019
Revised: 04 April 2019
Accepted: 05 April 2019
*Correspondence:
Dr. Saurabha U. S.,
E-mail: [email protected]
Copyright: © the author(s), publisher and licensee Medip Academy. This is an open-access article distributed under the terms of the Creative Commons Attribution Non-Commercial License, which permits unrestricted non-commercial use, distribution, and reproduction in any medium, provided the original work is properly cited.
with other communicable diseases that are prevalent in the 149 tropical and subtropical countries. Although it is belongs to the neglected tropical disease group no infection commands such a vast domain as the dengue virus. The enormous territory occupied by this Flavivirus is due the resourcefulness of its principal vector, the Ades ageypti.6 It is transmitted by an infected female mosquito. This vector is highly sensitive to environmental conditions. Temperature, precipitation and humidity are critical to survival, reproduction and development; it can also influence the mosquito presence and abundance.7 The mosquito breeds mostly in man-made containers/artificial collection of water, it is a day time feeder; with peak biting periods early morning and in the evening before dusk. 8
Dengue disease presents itself a highly complex pathophysiological, economical and ecological problem. Research needs to be carried to understand all of these aspects; various studies have been/are being carried out to understand these areas in relation to the morbidity and mortality patterns of the disease. This study addresses the problem of dengue by taking into consideration the climate variability. The high burden of dengue illness (dengue fever and severe dengue which is one of the leading causes of mortality in paediatric age group) and the vector density, being closely associated with climate makes it important to have understanding of this area of the dengue illness. Hence this study has been designed with the aim to analyse the seasonal trends of dengue cases and identify the factors responsible for the trend.
METHODS
Study type: Observational study
Study design: Retrospective study
Study period: February 2017 to February 2018
Study setting: Seth GS Medical College and KEM Hospital- a teaching medical college and tertiary care hospital in the city of Mumbai.
Case definition for inclusion of record
Dengue case was defined as a case of fever with ELISA Dengue NS1 positive or Dengue Ig M positive.
Data source
Data of dengue cases reporting to tertiary care hospital for the duration 2011- 2015 was obtained with due permission from the HOD of Department of Community Medicine who also heads the IDSP unit. The climatic data of the city of Mumbai (coordinates were taken as – latitude 19.11, longitude 72.85) for the same duration was used (data was available on public domain).
The data thus obtained that is A) climatic data and B)data of dengue cases were used to analyse the trend and factors responsible for increase or decrease in the number of cases of dengue.
Data analysis
Data obtained was entered in Microsoft Excel and analysed using SPSS version 22.0. The time series analysis was performed for analyze the trend and identify forecasting model. Statistical tests like mean, median and correlation were used where ever appropriate.
RESULTS
A total of 2324 cases of Dengue were included in the study. An epidemiological mapping of the cases was done for better understanding of the determinants of Dengue cases reporting to the tertiary care hospital.
Figure 1: Age group wise distribution of cases.
The age group maximally affected by the disease was 21-30 years, nearly 33% of the total cases belonged to this age group, this was followed by 25% of the cases belonging to the age group 11-20 years (Figure 1).
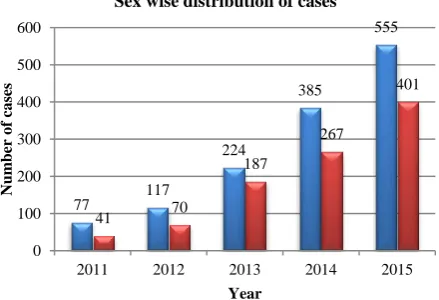
Figure 2: Sex wise distribution of dengue cases.
21%
25% 33%
11% 5%
4% 1%
0-10 11-20 21-30 31-40 41-50 51-60 >60
77 117
224
385
555
41 70
187
267
401
0 100 200 300 400 500 600
2011 2012 2013 2014 2015
Num
ber
o
f
ca
ses
Year
Figure 3: Age sex pyramid for dengue cases.
Of the total cases admitted during the study period 58.4% were men and 41.6% were women, in all the years the number of men affected was slightly more than that of women. In the age group 21-30 years, of the total cases admitted 60% were men and 40% were women (Figure 2 and 3).
A clear increase in the number of cases being reported over the years was observed on time series analysis, with an obvious seasonal trend, maximum cases between June and October (Figure 4).
Figure 4: Time series plot for dengue cases over 5 year period.
Figure 5: Correlation of mean monthly rainfall and cases of dengue being reported.
11% 17%
20% 6% 3% 2% 1%
10% 8%
13% 5% 3% 2% 1%
70% 20% 30%
0-10 11-20 21-30 31-40 41-50 51-60 >61
Percentage distribution by age
A clear increase in the number of cases being reported over the years was observed on time series analysis, with an obvious seasonal trend, maximum cases between June and October (Figure 4).
On comparison of cases with mean monthly rainfall and total days it rained, it was noted that cases begin to get reported as the rainy season begins and rise after the end of continued rainfall. A strong correlation was observed between mean monthly rainfall, total number of days of rainfall and total number of cases reported (Figure 5 and Table 1).
Table 1: Correlation coefficient for the number of cases and variable.
Variable Spearman’s rho P value
Mean monthly rainfall
(mm) 0.490 0.000
Total days it rained 0.471 0.000 Significant at p<0.001.
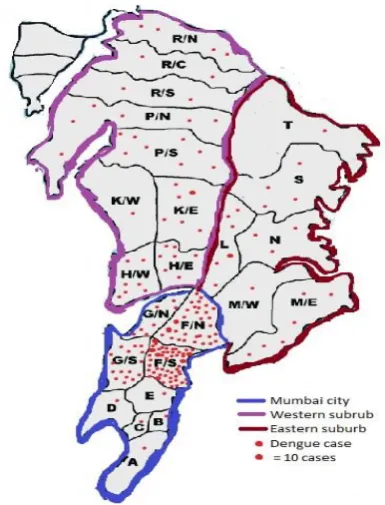
Cases were plotted on the map of Mumbai, maximum case reporting to the hospital were from Mumbai city proper (wards A, B, C, D, E, F/S, F/N, G/S, G/N) (Figure 6).
Figure 6: Spot map for dengue cases reported between 2011 and 2015.
Source of outline map: IDSP Control room, KEM Hospital.
Figure 7: Prediction for the year 2016 using ARIMA model.
Table 2: The number of cases as per prediction model and the actual number of cases.
Jun 2016 Jul 2016 Aug 2016 Sep 2016 Oct 2016 Nov 2016
Predicted 36 73 160 317 289 129
Actual 39 48 174 151 198 139
With the available data of dengue cases and climatic data from 2011 to 2015 a forecast was prepared for the year 2016, the model used was ARIMA (0,0,1) (0,1,0). The
The number of cases predicted by the model was further compared with the actual number of cases that were reported in the year 2016 (Table 2). The cases that were predicted by the model were comparable to the actual number of cases though a slight difference was seen.
DISCUSSION
The problem of dengue has been the one where many solutions have been found but none have helped in controlling the problem to the fullest. This study is a retrospective study carried out on the data available for dengue between 2011 and 2015; a total of 2324 records of dengue illness were included in the study. From the study we can understand, the incidence of cases and the climate seems to be closely related to each other. A seasonal trend is observed in the reporting of dengue cases, the rainfall pattern has a definite influence on the number of cases. Climatic conditions are strongly associated with the disease.
The age group wise distribution of cases reveals that cases are most prevalent in the age group 20-30 years which is in accordance with the study conducted by Gupta E, Dar L, Kapoor G, Broor S and a study conducted by Murhekar M et al which also says the median age of Dengue positive patients was 25 years (IQR 16-36).9,10 It can be understood that the disease affects those in the economically productive age group. A deeper introspection into the economic losses that occur to the nation, family and individual due to this illness is required. The male female difference in infection rates have been discussed in various studies most of them revealing findings similar to our study, wherein men are more affected than women, a review article on topic by Gupta, Srivastav, Amita, Umesh also reveals similar findings and study by Murhekar et al also states the same where the Dengue positivity is significantly higher among males.5 The probable reason that we can give to explain this phenomenon is that most men are engaged in out-door activities during the day. Further prospective studies can be considered where environmental history of the residence and occupation to understand the male female difference in dengue positivity. Also geographical mapping of dengue cases reported as per their details place of occupation, and correlating it with the residential address might help in pin pointing the actual location where the cases are being bitten by the mosquito/ breeding site of mosquitoes. This aspect was not touched upon in this study as this was a retrospective study and such data was not available. In the past three decades there has been development of geographical information system (GIS) and use of satellites has made it possible to monitor weather, climate, environmental and anthropogenic factors that influence the reduction or re-emergence of vector borne diseases, likewise the use of spot maps, a basic epidemiological tool, can be used as an organisations’ very own miniature GIS.11
In a study conducted by Choi et al, where the climatic factors were compared with dengue incidence it was observed that cases were significantly associated with mean temperature and monthly cumulative rainfall which is quite in accordance with our study where number of days of rainfall and mean monthly rainfall correlated with the number of dengue cases whereas temperature did not correlate with number of dengue cases.12 Other climatic variables like humidity and rainfall (in mm) were also studied for correlation but, in our study no statistically significant association was found. The climate data obtained should further be associated with the entomological indices as is being done in studies already this will add on to the understanding of the increase in incidence of cases during certain time of the year.13 The climate is not under our control but few of factors that lead to changes in the climate are definitely under our control. The measures that are being put forward for the control of the effects of climate change are to be taken seriously and implemented in daily life else the morbidity and mortality due to ill effects of climate change on health will definitely keep on rising.
ARIMA (auto regressive integrated moving average) model was used for the forecasting of Dengue cases. This was chosen based on the pattern of Dengue cases, seasonal component was also considered, similar model has been used by a study conducted. The forecasting will help in being prepared for the year ahead, in terms of logistics required, man power needed for patient care, bed requirement in hospitals etc. A close inter-sectoral coordination with the Meteorology Department will also help in being prepared not just dengue but also for various other Monsoon related illnesses.
This study was conducted in a hospital setting hence was limited only to the cases that were admitted, the cases treated on the out-patient basis and those not reporting to hospital under study were not included, inclusion of these cases can help in better understanding of the epidemiological determinants of dengue.
CONCLUSION
The trend in the reporting of dengue cases shows an increasing trend, with slight male female difference, the proportion being higher among men. A clear seasonal distribution of cases is also seen. The climate change has a definite influence on the incidence on the vector borne diseases like dengue. Employing statistical methods like time series analysis and forecasting will help in better understanding of the trend and being prepared for the year ahead.
ACKNOWLEDGEMENTS
Funding: No funding sources Conflict of interest: None declared
Ethical approval: The study was approved by the Institutional Ethics Committee
REFERENCES
1. World Health organisation. Climate change and health. WHO 2018. https://www.who.int/news-room/fact-sheets/detail/climate-change-and-health. Accessed on 12 February 2019.
2. Rao Mutheneni S, Morse AP, Caminade C, Murty Upadhyayula S. Dengue burden in India: recent trends and importance of climatic parameters. Emerg Microbes Infect. 2017;6:e70.
3. Das S, Sarfraz A, Jaiswal N, Das P. Impediments of reporting dengue cases in India. J Infect Public Health. 2017;10:494–8.
4. WHO. Dengue and severe dengue. World Heal Organ 2012. Available at: http://www.who.int/ mediacentre/factsheets/fs117/en/. Accessed on 26 February 2019.
5. Gupta N, Srivastava S, Jain A, Chaturvedi UC. Dengue in India. Indian J Med Res. 2012;136:373– 90.
6. Halstead SB. Dengue hemorrhagic fever - a public health concern and a field of research. Bull WHO. 1980;58:1–21.
7. Johansson MA, Dominici F, Glass GE. Local and Global Effects of Climate on Dengue Transmission in Puerto Rico. PLoS Negl Trop Dis. 2009;3:e382.
8. K P. Park’s Textbook of Preventive and Social Medicine. 24th ed. Jabalpur: M/s Banarsidas Bhanot; 2017: 261-271.
9. Gupta E, Dar L, Kapoor G, Broor S. The changing epidemiology of dengue in Delhi, India. Virol J. 2006;3:92.
10. Murhekar M, Joshua V, Kanagasabai K, Shete V, Ravi M, Ramachandran R, et al. Epidemiology of dengue fever in India, based on laboratory surveillance data, 2014–2017. Int J Infect Dis. 2019. 11. Ceccato P, Connor SJ, Jeanne I, Thomson MC. Application of geographical information system and remote sensing in Malaria risk. Parassitologia. 2005;47:81–96.
12. Choi Y, Tang CS, Mciver L, Hashizume M, Chan V, Abeyasinghe RR, et al. Effects of weather factors on dengue fever incidence and implications for interventions in Cambodia. BMC Public Health. 2016;16:241.
13. Lal V, Gupta S, Gupta O, Bhatnagar S. Forecasting incidence of dengue in Rajasthan, using time series analyses. Indian J Public Health. 2013;56:281–5.