Original Research Article
Effectiveness of school based educational intervention for healthy body
mass index and its association with academic performance among
school children: a quasi-experimental study
Manjula R.
1, Ashok S. Dorle
1, B. S. Mannapur
1, Sachin Desai
1, Ashalatha Mallapur
2INTRODUCTION
The prevalence of obesity among the school-aged children and adolescents has considerably increased in many countries from less than 10% in Russia and East Europe to more than 30% in U.S.1 Childhood obesity is associated with a higher chance of premature death and
disability in adulthood, according to the World Health Organization. More than two-thirds of the adolescents aged 11-17 years are physically inactive in India as per WHO standards. The level of physical inactivity among adults is around 13%.2 Prevalence of hypertension among adolescents is 40.1%, diabetes 14.3% overweight is 28.6% and obesity 12.8% as per Thakur et al.3 A recent
ABSTRACT
Background: Childhood obesity is associated with a higher chance of premature death and disability in adulthood, according to the World Health Organization. More than two-thirds of the adolescents aged 11-17 years are physically inactive in India as per WHO standards. Hence, school based Healthy life style curriculum development is the need of the hour for school children. The objectives of the study were to promote healthy lifestyle, by implementing school based intervention program (physical activity and nutrition education) for healthy body mass index among school children; to study the correlation between the body mass index and academic performance (secondary objective).
Methods: A quasi-experimental study was conducted in the randomly selected schools of Bagalkot. A total of 598 students in intervention group and 575 students in control group participated in the study. Baseline information about demographic characteristics was obtained using pre-designed proforma. For intervention group, multicomponent programme was implemented based on child and adolescent trial for cardiovascular health model and the comprehensive school health programme model by the USA, centre for disease control. After 2 years, post-interventional data was collected.
Results: In pre-test intervention group majority of participants (37.4%) were having normal BMI, while 26.8% participants were obese. In post-test intervention group majority of participants (45.7%) were having normal BMI, while 23.1% participants were obese. In pre-test control group majority of participants (34.7%) were having normal BMI, while 27.1% participants were obese. In post-test control group majority of participants (38.7%) were having normal BMI, while 26.4% participants were obese. Majority of the students attained normal BMI after the intervention. BMI of the participants is negatively correlated to academic performance (r=-0.025).
Conclusions: The life style changes such as physical activity, yoga and meditation are the need of the hour among the schoolchildren, helps in maintenance of healthy BMI.
Keywords: Body mass index, School children, Academic performance, School-based education intervention 1
Department ofCommunity Medicine, 2Department of OBG, S. N. Medical College, Bagalkot, Karnataka, India
Received: 01 February 2018
Accepted: 01 March 2018
*Correspondence:
Dr. Manjula R.,
E-mail: [email protected]
Copyright: © the author(s), publisher and licensee Medip Academy. This is an open-access article distributed under the terms of the Creative Commons Attribution Non-Commercial License, which permits unrestricted non-commercial use, distribution, and reproduction in any medium, provided the original work is properly cited.
study conducted among 24,000 school children in south India showed that the proportion of overweight children increased from 4.94 per cent of the total students in 2003 to 6.57 percent in 2005 demonstrating the time trend of this rapidly growing epidemic. Those with BMI equal to or exceeding the 85th but are below 95th percentiles are defined overweight and are at risk for obesity related
co-morbidities.4 Metabolic syndrome is defined as a
constellation of risk factors, including obesity,
dyslipidaemia, impaired glucose metabolism and elevated blood pressure, all major predictors for cardiovascular disease.5 It has been proven by previous studies that cardio metabolic risk factors frequently cluster in obese children and adolescents. Goodman et al identified four clusters of risk factors in adolescents and found that obesity had the most substantial influence on cumulative cardio metabolic risk.6 Four behavioural risk factors are responsible for significant proportions of these obesity among children and adolescents- unhealthy diet, physical inactivity, tobacco use, and harmful use of alcohol.
Also, students who have a low level of physical activity are more likely to be obese and also more likely to have a
lower grade point average (GPA).7 Academic
performance is generally considered to be related to cognitive and memory functions.8 Given the negative association of obesity with cognitive and memory functions, being overweight or obese might have a negative impact on the academic achievement of adolescents.9 Many studies emphasized on positive
relationship between obesity and poor school
performance, while others has proved no significant correlation between these two issues.10-15
Hence this study was taken up to study the effect of education intervention for healthy body weight and its association with academic performance.
Objectives
To promote healthy lifestyle, by implementing
school based intervention program (physical activity and nutrition education) for healthy body mass index among school children.
To study the correlation between the body mass
index and academic performance (secondary objective).
METHODS
This quasi-experimental study was conducted in the randomly selected high schools of Bagalkot from June 2015 to July 2017. Sample size was calculated based on the study conducted by Warren et al, using Open Epi software version 2.3.1 taking 95% confidence level and 80% power of the study, there was reduction of obesity from 8% to 4% following intervention, which is taken as P1 and P2.6 Minimum sample size required for the present study was 556. A total of 598 students in intervention group and 575 students in control group
participated in the study. After obtaining informed consent from institutional ethical committee, baseline information about demographic characteristics was obtained using pre-designed proforma. For intervention group, multicomponent programme was implemented based on CATCH (Child and Adolescent trial for Cardiovascular Health) Model and The Comprehensive School health programme Model by the USA, Centre For
Disease Control (CDC).16,17 Module was prepared, which
was the tool for our intervention programme. Here the peer educators and teachers were trained by our team in various aspects of health promotion measures which includes nutrition education (healthy eating habits) and physical activity. After 2 years, post-interventional data was collected.
Statistical analysis
Data collected were entered in the Microsoft excel sheet and later analysed using SPSS software. Chi-square test for proportions and student t-test for quantitative data was
applied. P<0.05 was considered as statistically
significant.
RESULTS
In the present study, intervention group has 598 children and control group has 575 children (Table 1). Mean Academic performance in post-test intervention was found to increase from pre-test (p=0.142), though statistically not significant. Calorie intake in post-test intervention group was found to be significantly more as compared to pre-test group. Duration of physical activity per week was found to be more in post-test group (Table 2). In pre-test and post-test intervention group a good
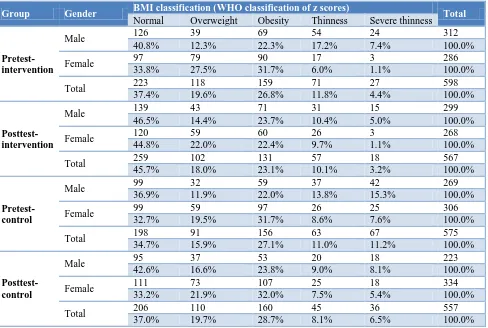
proportion of participants (41.5% and 36.8%
were obese. And just 7.4% male and 1.1% females were severely thin. In post-test intervention group, 23.7% male participants were obese and 22.4% female participants were obese. And 14.4% male and 22% females were overweight. And 5% males and 1.1% females were severely thin. In pre-test control group, 22% male participants were obese and 31.7% female participants were obese. And 15.3% male and 7.6% females were severely thin. In post-test control group, 23.8% male
participants and 32% female participants were obese. And 8.1% male and 5.4% females were severely thin. And overall overweight and obesity is reduced in post-test intervention group as compared to pre-post-test group and even thinness is also reduced. While in both the control groups, the proportion of participants that are overweight and obese have increased in post-test group as compared to pre-test (Table 6). BMI of the participants is negatively correlated to academic performance (Table 7).
Table 1: Table showing the number of study subjects in the intervention and control group.
Group Number Percentage (%)
Intervention 598 50.9
Control 575 49.1
Total 1173 100.0
Table 2: Effect of intervention of different parameters in intervention group.
Parameters Group Mean SD t P value
Academic performance Pretest-intervention 80.64 11.162 -1.470 0.142
Postest-intervention 81.57 10.405
Calorie intake per day Pretest-intervention 1375.70 414.145 -3.599 0.000
Postest-intervention 1469.31 471.240
Duration of physical activity per week Pretest-intervention 41.81 47.135 -2.17 0.02
Postest-intervention 46.8 28.2
Table 3: Physical activity in the study subjects before and after intervention.
Group
Physical activity
Total
None 1 physical
activity
2 physical activity
3 and >3 physical activity
Pretest-intervention 252 248 51 47 598
42.1% 41.5% 8.5% 7.9% 100.0%
Posttest-intervention* 177 210 92 91 570
31.1% 36.8% 16.1% 16.0% 100.0%
Pretest-control 394 107 31 43 575
68.5% 18.6% 5.4% 7.5% 100.0%
Posttest-control** 362 94 11 91 558
64.9% 16.8% 2.0% 16.3% 100.0%
Total 1185 659 185 272 2301
51.5% 28.6% 8.0% 11.8% 100.0%
*P=0.004; **p=0.45.
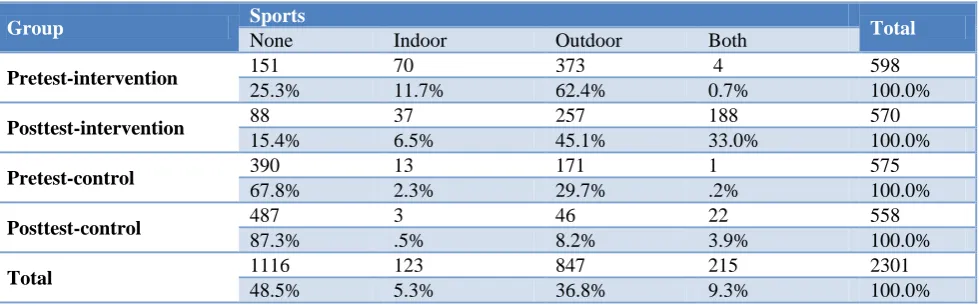
Table 4: Indoor and outdoor sports in the study subjects before and after intervention.
Group Sports Total
None Indoor Outdoor Both
Pretest-intervention 151 70 373 4 598
25.3% 11.7% 62.4% 0.7% 100.0%
Posttest-intervention 88 37 257 188 570
15.4% 6.5% 45.1% 33.0% 100.0%
Pretest-control 390 13 171 1 575
67.8% 2.3% 29.7% .2% 100.0%
Posttest-control 487 3 46 22 558
87.3% .5% 8.2% 3.9% 100.0%
Total 1116 123 847 215 2301
Table 5: Body mass index in the study subjects before and after intervention.
BMI classification (WHO classification of z scores) Total
Normal Overweight Obesity Thinness Severe thinness
Pretest-intervention 223 117 160 71 27 598
37.4% 19.6% 26.8% 11.8% 4.4% 100.0%
Posttest-intervention
259 102 132 58 19 570
45.7% 18.0% 23.1% 10.1% 3.2% 100.0%
Pretest-control 198 92 156 64 65 575
34.7% 15.9% 27.1% 11.0% 11.2% 100.0%
Posttest-control 206 110 160 45 37 558
37.0% 19.7% 28.7% 8.1% 6.5% 100.0%
Total 886 421 608 238 148 2301
38.7% 18.3% 26.4% 10.3% 6.3% 100.0%
Table 6: Body mass index in the different gender before and after intervention.
Group Gender BMI classification (WHO classification of z scores) Total
Normal Overweight Obesity Thinness Severe thinness
Pretest-intervention
Male 126 39 69 54 24 312
40.8% 12.3% 22.3% 17.2% 7.4% 100.0%
Female 97 79 90 17 3 286
33.8% 27.5% 31.7% 6.0% 1.1% 100.0%
Total 223 118 159 71 27 598
37.4% 19.6% 26.8% 11.8% 4.4% 100.0%
Posttest-intervention
Male 139 43 71 31 15 299
46.5% 14.4% 23.7% 10.4% 5.0% 100.0%
Female 120 59 60 26 3 268
44.8% 22.0% 22.4% 9.7% 1.1% 100.0%
Total 259 102 131 57 18 567
45.7% 18.0% 23.1% 10.1% 3.2% 100.0%
Pretest-control
Male 99 32 59 37 42 269
36.9% 11.9% 22.0% 13.8% 15.3% 100.0%
Female 99 59 97 26 25 306
32.7% 19.5% 31.7% 8.6% 7.6% 100.0%
Total 198 91 156 63 67 575
34.7% 15.9% 27.1% 11.0% 11.2% 100.0%
Posttest- control
Male 95 37 53 20 18 223
42.6% 16.6% 23.8% 9.0% 8.1% 100.0%
Female 111 73 107 25 18 334
33.2% 21.9% 32.0% 7.5% 5.4% 100.0%
Total 206 110 160 45 36 557
37.0% 19.7% 28.7% 8.1% 6.5% 100.0%
Table 7: Correlation between BMI and academic performance.
Academic performance
BMI class
r -0.025
p 0.224
DISCUSSION
The present study was conducted to promote healthy lifestyle, by implementing school based intervention program (physical activity and nutrition education) for
In the present study, the mean Academic performance in post-test intervention group was improved from pre-test (p=0.142). Physical activity & healthy nutritious diet enhances healthy growth and development, increases concentration and better academic scores. It improves social skills and brain development and helps children feel confident about themselves to do better in school.
Jessie-Lee et al, in a cross-sectional study showed that unhealthy lifestyle behaviors are positively associated with poor in elementary school students in a school board in Nova Scotia, Canada during 2014.18 The associations were statistically significant. Consumption of ≥1 sugar-sweetened beverage, breakfast skipping and not being physically active were the reasons for poor academic performance.
In this study, it was also found that duration of physical activity per week was found to be more in post-test intervention group when compared to pre-test. There was increase of about 35 hours of physical activity/week following intervention. This difference of physical activity after intervention was statistically found to be significant. When we compare different parameters between intervention and control group, the duration of physical activity/week is more in post-test intervention group as compared to post-test control group and is statistically significant.Similar finding was observed in a study by Russell et al those in the intervention schools engaged in significantly more among medium to vigorous physical activity than children in control schools.19 This difference remained significant.
In pre-test and post-test intervention group a good
proportion of participants (41.5% and 36.8%
respectively) are doing at least one physical activity. Three types of physical activities were found in 16% of the individuals in posttest intervention when compared to pretest intervention (7.9%). That means the intervention group subjects increased the number of physical activities from one to two and three. This could be the effect of training of peer educators & teachers monitoring of the students for physical activity by the teachers and project management team. But in pre-test and post-test control group, majority of participants (68.5% and 64.9% respectively) are not involved in any physical activity. In the control group there was not much change in the physical activity during posttest.
In the post test intervention group, both indoor & outdoor activities were increased from 0.7 to 33% of the subjects whereas in the post test control group there was a slight increase i.e., from 0.2 to 3.9%.
In the present study, the mean academic performance in post-test intervention group was improved from pre-test (p=0.142). Physical activity and healthy nutritious diet enhances healthy growth and development, increases concentration and better academic scores. It improves
social skills and brain development and helps children feel confident about themselves to do better in school.
A study conducted in Saudi Arabia, found that students who achieved >90% in the overall GPA (Grade Point Average) have a mean BMI mean±standard deviation= 22.75±5.4 and those who achieved <90% in the overall GPA have a BMI of mean±SD= 22.4±6.0, thus, showing that there is no significant differences between being overweight, obese, normal weight, or underweight. On the other hand, students who were obese achieved poor result in physics. Some studies have demonstrated that cognitive ability is influenced by obesity and the likelihood of being obese is influenced by the quality of nutrition.20 The obesity has also proven to lead to mental and emotional problems, such as anxiety and depression.21 There are some potential explanation for reveres association between student grades average and BMI: firstly, as proven in previous studies there is a significant correlation between high BMI and depression, that could strongly affect student performance.22,23 Noting that, a study in North Korea on 405 students confirmed that, psychological problems in overweight and obese student are the major cause of poor school performance rather than their body image.24 In addition, the obese students are mostly less physically activate which lead them to experience the lower school performance compared with normal BMI students.25-28
Numerous studies have been performed across the United States on whether or not physical fitness levels have a
significant positive correlation with academic
achievement.29-31 These studies have been performed on a wide range of ages, from as young as five to age eighteen. The results of these studies have been fairly conclusive that there is indeed a positive correlation, although the correlational coefficient varies from study to study, generally between 0.07-0.34.32
CONCLUSION
The life style changes such as physical activity, yoga & Meditation are the need of the hour among the schoolchildren. The study results showed that regular physical activities and yoga and meditation helps in maintenance of good health as well as prevents the cardiovascular diseases in the future life. Regular physical activity, yoga and meditation should be included and implemented strictly in the school curriculum. Nutrition education should start from the home and there should be continued nutritional education in the school curriculum.
Funding: This study was funded by Rajiv Gandhi university of Health sciences, Karnataka
Conflict of interest: None declared
REFERENCES
1. Karnik S, Kanekar A. Childhood obesity: a global public health crisis. Int J Prev Med. 2012;3(1):1. 2. Available at: http://www.searo.who.int/india/topics/
noncommunicable_diseases/ncd_situation_global_re port_ncds_2014.pdf?ua=1. Accessed on 6 January 2018.
3. Thakur JS, Jeet G, Pal A, Singh S, Singh A, Deepti
SS, et al. Profile of Risk Factors for Non-Communicable Diseases in Punjab, Northern India: Results of a State-Wide STEPS Survey. PLoS ONE. 2016;11(7):e0157705.
4. Donohoue PA. Obesity. In: Behrman RE, Kleigman
RM, Jenson HB, eds. Nelson textbook of pediatrics. 17th ed. Philadelphia: WB Saunders; 2004: 173– 177.
5. Raj M, Sundaram KR, Paul M, Deepa AS, Kumar
RK. Obesity in Indian children: time trends and relationship with hypertension. Natl Med J India. 2007;20:288–93.
6. Warren JM, Henry CJK, Lightowler HJ, Bredshew
SM, Porweiz S. Evaluation of pilot school programe aimed at the prevention of obesity in children. J Health Promotion International. 2203;18(4):287-96.
7. Calzada PJ, Anderson-Worts P. The obesity
epidemic: Are minority individuals equally
affected? Prim Care. 2009;36:307-17.
8. Aguirre-Pérez DM, Otero-Ojeda GA, Pliego-Rivero
FB, Ferreira-Martínez AA. Relationship of working memory and EEG to academic performance: A study among high school students. Int J Neurosci. 2007;117:869-82.
9. Kim JH, So WY. Association between
overweight/obesity and academic performance in South Korean adolescents. Cent Eur J Public Health. 2013;21:179-83.
10. Taras H, Potts-Datema W. Obesity and student
performance at school. J Sch Health.
2005;75(8):291–5.
11. Florin TA, Shults J, Stettler N. Perception of Overweight Is Associated With Poor Academic Performance in US Adolescents. J Sch Health. 2011;81(11):663–70.
12. Huang TTK, Goran MI, Spruijt Metz D:
Associations of Adiposity with Measured and Self
Reported Academic Performance in Early
Adolescence. Obesity. 2012;14(10):1839–45.
13. Ramaswamy R, Mirochna M, Perlmuter LC. The
negative association of BMI with classroom effort in elementary school children. J Child Health Care. 2010;14(2):161–9.
14. Abdelalim A, Ajaj N, Al-Tmimy A, Alyousefi M, Al-Rashaidan S, Hammoud MS, et al. Childhood Obesity and Academic Achievement among Male Students in Public Primary Schools in Kuwait. Med Princ Pract. 2012;21(1):14–9.
15. Baxter SD, Royer JA, Hardin JW, Guinn CH,
Devlin CM. The Relationship of School
Absenteeism With Body Mass Index, Academic
Achievement, and Socioeconomic Status Among
Fourth‐Grade Children. J Sch Health.
2011,81(7):417–23.
16. Leupker RV, Murrey DM, Jacobs DR Jr, Mittelmark
MB, Bracht N, Carlaw R, et al. Community education for Cardiovascular disease prevention; Risk factor changes in the Minnesto heart healthy
programme. Amercal J Public Health.
1994;84:1383-93.
17. Allensworh DD, Kolbe LJ. The comprehensive
school health programme: Exploring on expended concept. J School Health. 1987;57:409-12.
18. McIsaac JLD, Kirk SFL, Kuhle S. The Association
between Health Behaviours and Academic
Performance in Canadian Elementary School Students: A Cross-Sectional Study. Int J Environ Res Public Health. 2015;12:14857-871.
19. Russell R. An Intervention to Increase Physical Activity in Children: A Randomized Controlled Trial with 4-Year-Olds in Preschools. Am J Prevent Med. 2016;51:12-22.
20. Alswat KA, Al-shehri AD, Aljuaid TA, Alzaidi BA,
Alasmari HD. The association between body mass index and academic performance. Saudi Med J. 2017;38(2):186-91.
21. Pine DS, Goldstein RB, Wolk S, Weissman MM.
The association between childhood depression and
adulthood body mass index. Pediatrics.
2001:107(5):1049–56.
22. Wehigaldeniya WGDS, Oshani PAL, Kumara
IMNS. Height, Weight, Body Mass Index (BMI) and Academic Performance (AP) of University Students in Sri Lanka: With Special Reference to the University of Kelaniya. Int J Sci Res Publications. 2017;7(2):217-9.
23. Sjöberg RL, Nilsson KW, Leppert J. Obesity,
shame, and depression in school-aged children: a
population-based study. Pediatrics.
2005,116(3):389–92.
24. Kim B, Park MJ. The influence of weight and
height status on psychological problems of elementary schoolchildren through child behavior checklist analysis. Yonsei Med J. 2009;50(3):340–4.
25. Hernandez B, Gortmaker S, Colditz G, Peterson K,
Laird N, Parra-Cabrera S. Association of obesity with physical activity, television programs and other forms of video viewing among children in Mexico
city. Int J Obes Relat Metab Disord.
1999;23(8):845.
26. Freedman DS, Wang J, Maynard LM, Thornton JC,
Mei Z, Pierson R, et al. Relation of BMI to fat and fat-free mass among children and adolescents. Int J Obes (Lond). 2004;29(1):1–8.
27. Tremblay MS, Inman JW, Willms JD. The
relationship between physical activity, self-esteem, and academic achievement in 12-year-old children. Pediatr Exerc Sci. 2000;12(3):312–23.
28. Coe DP, Pivarnik JM, Womack CJ, Reeves MJ,
activity levels on academic achievement in children. Med Sci Sports Exerc. 2006;38(8):1515.
29. Fox CK, Barr-Anderson D, Neumark-Sztainer D,
Wall M. Physical activity and sports team participation: Associations with academic outcomes in middle school and high school students. J School Health. 2010;80(1):31-7.
30. Wittberg RA, Northrup KL, Cottrell LA. Children's
aerobic fitness and academic achievement: A longitudinal examination of students during their fifth and seventh grade years. Am J Public Health. 2012;102(12):2303-7.
31. Grissom JB. Physical fitness and academic
achievement. J Exercise Physiol. 2005;8(1):11-25. 32. Van D, Kelder SH, Kohl III HW, Ranjit N, Perry
CL. Associations of physical fitness and academic performance among schoolchildren. J School Health. 2011;81(12):733-40.