A Novel Approach for Iris Recognition using
DWT&PCA
Manjunath M1 , DR K B Raja2
1Assistant professor, Dept of ECE, Brindavan College of Engineering, Bangalore. 2 Professor, Dept of ECE, University Visvesvaraya College of Engineering(UVCE), Bangalore.
Visvesvaraya Technological University,
Dwarakanagar, Bagalur Main Road, Yelahanka, Bangalore-63 [email protected], [email protected]
---ABSTRACT--- The Iris pattern is an important biological feature of human body. The recognition of an individual based on iris pattern is gaining more popularity due to the uniqueness of the pattern among the people. In this paper PCA based iris recognition using DWT is proposed. The upper and lower portion of the iris which is occluded by the eyelids and eyelashes is removed using morphological process. According to Springer Analysis of CASIA data base, to get better recognition forty five pixels to left and right of the pupil boundary is considered as iris template for the proposed algorithm analysis. The image is enhanced using Histogram. Equalization to get high contrast. DWT is applied on histogram equalized iris template to get DWT coefficients. The features are extracted from the approximation band of the DWT coefficients using PCA. Multiple classifiers such as KNN, RF and SVM are used for matching. The proposed algorithm has better performance parameters compared to existing algorithm.
Keywords: Iris, Dilation, Erosion, Biometrics, DWT, PCA ,KNN, RF, SVM.
--- Date of Submission: May 3, 2013 Date of Acceptance: June 31,2013 ---
I. INTRODUCTION
Identification and authentication of any individual is becoming more important in recent days. In the modern world where computers and electronics devices are more extensively used and the population of the world is increasing, there is a need for highly accurate and secured practical authentication technology. Traditional techniques such as user name, passwords, keys, ID cards, hardware token based systems are not reliable and secure in many of the security zones. Thus there is an increasing need for automatic reliable authentication process in modern society. In the recent few years biometric identification has proven to be more reliable means of verifying the human identity. Biometric refers to a science of analyzing human physiological or behavioral characteristics for security purposes and the word is derived from the Greek words bios means life and metrikos means measure.
Thumwarin[1] have proposed a paper on iris recognition method based on dynamic radius matching of iris image. Experimental results were performed on CASIA V1.0[6] iris database having 756 iris image from 108 persons. The obtained accuracy was 94.8%.
Yun Zhang[2] have proposed a paper which presented a high speed recognition system based on DM6446 and put forward by a DSP and arm dual core embedded system. The system has integrated with the image acquisition, image processing and recognition. The test shows that iris image can be correctly identified by this system. Man Zhang[3] have proposed a paper which proposes a novel iris recognition method mainly deformable daisy matcher(DDM) for robust against intra class variation of
iris images. Then a set of iris key points are localized on the feature map. Finally deformation tolerant matching strategy is purposed to match corresponding key points of iris images. Hariprasath[4] proposed a paper in which a new iris recognition system based on wavelet packet analysis and morlet wavelet is described. Morlet wavelet calculations are easy compared to gabor wavelets. They have proposed a novel multi resolution approach based on wavelet packet transform (WPT) for iris texture analysis and recognition. Amol[5] have proposed a paper which represents a shift , scale and rotation invariant technique for iris feature representation and fused post classification at the decition level to improve the accuracy and speed of the iris recognition system. The proposed approach is capable of handling various artifacts particularly segmentation error, eyelid /eyelashes occlusion, shadow of eyelids, head tilt, specular reflections during iris verification. Fatma [6] have proposed a paper which presented graphic processing unit(GPU) which originally was used exclusively for visualization purposes, and has evolved into an extremely powerful coprocessor offering an alternative to increase speed and potentially enhance the resulting system performance. Nor’aini[7] have proposed a paper which presents a comparison of iris localization techniques namely circular hough transform(CHT), daugman’s integro differencial operator (DIDO) and circular boundary detector(CBD) for localization of iris region .the result show the CBD is able to localize the iris region for all tested iris images while using DIDO and CHT not all iris images can be localized precisely
Experimental results show that iris recognition when using the proposed restoration method were greatly reduced as compared to those results achieved without restoration or those achieved using previous iris restoration method. Sunpreeet[9] have proposed a paper related on matching iris images captured before and after alcohol consumption. Due to alcohol consumption the pupil dialates/constricts which causes deformation in iris pattern affecting iris recognition performance. Raja Sekar [10] have proposed a system in which novel efficient and very accurate iris segmentation is carried out .the equation the circle is used to detect the pupil boundary. The Euclidean and Manhattan distance measures are used for similarity measurement to find the best match. In this work Manhattan distance measures gives the best accuracy of 90.4%.
Motivation: Traditional methods of identifying a person are PIN, password etc. However these methods can be stolen or faked, but biometric parameters are more secure and reliable in personal identification. Several biometric traits have been used till date for authentication. However most biometric parameters have several drawbacks thus iris is chosen as the best amongst all. Iris pattern has unique, i.e., stable throughout one’s life time and are not similar even for twins.
Organization: The paper is organized into following sections. It involves an overview of related work. The proposed model is described in section 2. Section 3 discusses the algorithm of iris recognition based on DWT and PCA. Performance analysis is discussed in section 4 and Conclusion is given in section 5.
Contribution: In this paper, IRDWT & PCA is proposed. The dilation and erosion operations are used to generate iris template. The DWT and PCA are applied on iris template to derive iris features, and different classifiers are used for matching.
II Proposed Model
The definitions and block diagram of IRDWT & PCA are discussed in this section.
2.1. Definitions
2.1.1. False Acceptance Rate (FAR): The probability that a biometric system will incorrectly identify an individual or will fail to reject an imposter using Match Count (MC) and is designed as ratio of Match Count (MC) to the total imposter persons (IP) as given in the Equation 1.
MC
FAR% = ――― *100 (1) P C
2.1.2. False Rejection Rate (FRR): The probability that biometric system will fail to identify an enrollee using Miss Match Count (MMC) and Total Number of Persons (NP) as given in the Equation 2. MMC
FRR% = ――― *100 (2) NP
2.1.3. Morphology: The technique of analyzing images based on geometrical structures and topology.
2.1.4. Threshold: The acceptance or rejection of biometric data is dependent on the match score falling above or below the threshold. The threshold is adjustable so that the biometric systems can be more or less strict, depending on the requirements of any given biometric application.
2.1.5. Equal Error Rate (EER): The rates at which both accept and reject errors are equal. The smaller the EER, the more precise is the biometric system.
2.2. Block Diagram
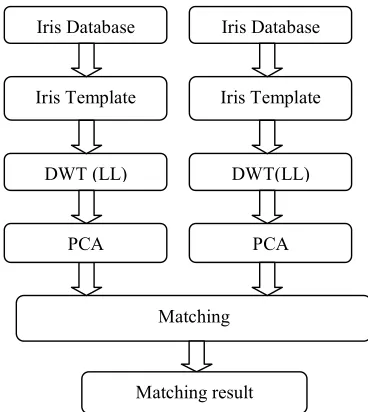
The block diagram of the proposed IRDWT & PCA model is shown in Figure 1:
Figure 1: Iris Recognition Flow Diagram.
2.2.1. Iris database
The iris is an annular region between the sclera and the pupil which is rich in unique textural information. The image of an eye is captured using the appropriate set up with good contrast and resolution, avoiding aberrations and reflections. The acquired image must initially be converted to grayscale format. The Chinese Academy of Sciences Institute of Automation (CASIA V1.0) iris database is considered to test the algorithm which consists of 756 eye images from 108 persons i.e., 7 eye images per individual. Each eye image is a grayscale image of size 280×320. The database images were collected using close-up iris camera in two sessions i.e., first three images in the first session and the next four images in the second session. The pupil regions of all the iris images in the CASIA V1.0 database were initially detected and replaced by a circular region of constant intensity masking out the reflections. This makes the iris recognition system much simpler and has minimal or no effects on the feature extraction and matching algorithms. The first six out of seven images per person are considered to create the iris
Iris Database Iris Database
Iris Template Iris Template
DWT (LL) DWT(LL)
Matching
PCA PCA
database i.e., total number of images in the database is 108×6=648. The seventh image of each person is used as test image to compare with six images in the database. One image sample of CASIA is shown in the Figure 2.
Figure 2: Sample Iris image from CASIA V1.0 database. 2.2.2 Iris Template
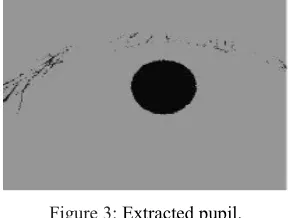
An iris region between the pupil and the sclera from an eye is obtained by iris localization. The iris region can be approximated by two circles viz., one for the iris/sclera boundary and another for the iris/pupil boundary. The upper and lower parts of an iris region nearer to sclera are not considered as it is occupied by eyelids and eyelashes. The initial stage begins with locating the center and radius of the pupil in order to separate the iris image. The estimation efficiency of the pupil depends on computational speed rather than accuracy since it is simple in shape and is the darkest region in an eye image and can be extracted using a suitable threshold. The Morphological process is used to remove the eyelashes and to obtain the center and radius of the pupil and is shown in Figure 3.
Figure 3: Extracted pupil.
The basic morphological operations are which use the structuring element to process the image. The structuring element with required dimension is used to remove the eyelashes. A structuring element is a matrix consisting of 1's and 0's which can have arbitrary shape and size and is typically smaller than the image being processed. The centre pixel of the structuring element is called the origin which identifies the pixel of interest in an image and the neighboring elements are used to dilate or erode the image. Dilation adds pixels to the bound an image, while erosion removes pixels on object boundaries. The number of pixels added or removed from the objects in an image depends on the size and shape of the structuring element. In dilation and erosion operations, a rule is applied to the pixel of interest and it’s an image. The rules are:
i) The origin of the structuring element identifies the pixel of interest in the input eye image and the minimum value of all the pixels in its neighborhood is assigned to the corresponding pixel in the output image. In a binary image, if any of the pixels is set to 0, the output pixel is also set to 0 in erosion as shown in Figure 4.
0 1 0 0 0 1 0 0 0 0 0 0 0 0 0 0 0 0 0 1 0 0 0 0 0 0 0 0 0 0 0 0 0 0 0 1 1 0 0 0 dilation 0 0 0 0 0 0 0 0 0 0 1 1 1 1 0 0 0 0 0 1 1 0 0 0 0 0 1 1 1 1 0 0 0 0 0 1 1 0 0 0 0 0 0 1 1 0 0 0 0 0 0 0 0 0 0 0 0 0 0 0 0 0 1 0 0 0 0 0 0 0 0 0 0 0 0 0 0 0 0 1 0 0 0 0 0 0 0 0
Figure 4: Eroded image
ii) The origin of the structuring element identifies the pixel of interest in the input eye image and the maximum value of all the pixels in its neighborhood is assigned to the corresponding pixel in the output image. In a binary image, if any of the pixels is set to the value 1, the output pixel is also set to 1 in dilation as shown in the Figure 5.
0 0 0 0 0 0 0 0 0 0 0 0 0 0 0 0 0 0 0 0 0 0 0 0 0 0 0 0 0 0 0 0 0 0 0 0 0 0 0 0 dilation 0 0 0 1 1 0 0 0 0 0 0 1 1 0 0 0 0 0 1 1 1 1 0 0 0 0 0 1 1 0 0 0 0 0 1 1 1 1 0 0 0 0 0 0 0 0 0 0 0 0 0 1 1 0 0 0 0 0 0 0 0 0 0 0 0 0 0 0 0 0 0 0 0 0 0 0 0 0 0 0 0 0 0 0 0 0 0 0
2.2.3 Pupil Detection:
Connected components labeling scans an image and groups its pixels into components based on pixel connectivity. All pixels in a connected component share similar pixel intensity values and are in some way connected with each other. Once all groups have been determined, each pixel in that group is labeled. The center and the diameter of all the groups are determined and the one with the largest diameter is the pupil. Now the upper and lower portions of the iris, occluded by eyelashes and eyelids are removed by setting all the pixels above and below the diameter of the pupil as Not a Number (NaN) as shown in Figure 6.
Figure 6: After removing upper and lower iris regions. According to the Springer analysis of the CASIA database the lowest and highest iris radius is found to be 90 and 125. Based on this, 45 pixels to the left and right of the pupil boundary is considered as iris region for the proposed algorithm analysis as shown as shown in Figure 7.
Figure7: Localized image.
Conventional iris recognition systems use edge detection techniques for localization like Hough circle for iris and pupil boundary detection and line detecting algorithms for eyelids. From the localized image, the iris regions to the left and right of the pupil are selected and a template is created by mapping the selected pixels on a 60×80 matrix as shown in Figure 8.
Figure 8: Iris template.
Histogram equalization is done on each iris template to generate an image whose intensity levels are uniform and it also covers the entire range of intensity levels. The resulting image has high contrast as shown in figure 9.
Figure 9: Histogram equalized Iris template. 2.2.4. DWT
Discrete Wavelet Transform (DWT) is applied on the Histogram equalized iris template to determine DWT co-efficient by passing the signal through low pass filter to derive approximation coefficients and high pass filter to get detail coefficients. The coiflet wavelet is used to generate four bands of coefficients viz., approximation, horizontal, vertical and diagonal as shown in Figure 10.
Figure 10: Results of DWT transform. 2 3 1 = 11 (3) 2 1 3 5
2 3 3 = 12 = 4 3
2 1 2 8 2 (4)
The steps involved in PCA include:
1) The mean of each vector is given in Equation 5
(5) Where N=648.
2) The mean is subtracted from all of the vectors to produce a set of zero mean vectors given in Equation 6. Xz=Xi – Xm (6) Where
Xz is the zero mean vectors,
Xi is each element of the column vector, Xm is the mean of each column vector.
3)The Covariance matrix is computed using an Equation 7 C= [XzT × Xz] (7) 4)The Eigen Vectors and Eigen values are computed using Equation 8.
[C – λI]e = 0 (8) Where
λ’s are the Eigen value and e’s are the Eigen vectors.
This gives us N Eigen Vectors (e1, e2,…,eN).
5)Each of an Eigen vectors is multiplied with zero mean vectors Xz to form the feature vector. The feature vector is given in Equation 9.
fi = [Xz] Vi (9) 6)The signature of each image is found by multiplying the transpose of zero mean vectors with feature vectors given in Equation 10.
Si = [Xz]fi (10) 2.2.5. Matching
The features of the test image are compared with the features of images in the database for match or non-match using classifiers such as:
i) K-Nearest Neighbors (KNN): It involves
(a) Training phase in which the feature vectors are stored and the class labels are assigned to the training samples. (b) Classification phase in which the test sample is classified by assigning the label which is most frequently occurring among the k training samples closest to the test sample. Cityblock distance parameter in KNN is used for matching and is given in Equation 11
(11)
ii) Random forest (RF):
The training set consisting of N cases is sampled at random to form a new training set, which is used for growing the decision trees. If there are M variables, then m<<M variables are selected which are used to split the node. The tree is grown without pruning. For a given input vector each tree gives its classification, this is called as voting. The forest chooses the class which has maximum number of votes. The error is calculated during the
training. The feature vectors are sampled and a few vectors are left out and are called OOB (out-of-bag) data. The size of OOB data is about N/3. The classification error is estimated by using this OOB data. The classification error is calculated as follows:
• A prediction is obtained for each vector which is OOB relative to the ith tree.
• The class winner (one with majority votes) is found from the vectors which are OOB and compared to ground-truth response.
• The ratio of misclassified OOB vectors to all vectors in the original data is equal to the classification error. The forest error depends on two things such as:
a) The correlation between any two trees in the forest. Increasing the correlation increases the error.
b) The strength of each individual tree in the forest. Increasing the strength decreases the error.
iii) Support Vector Machine (SVM) classifier:
It takes a set of input data and predicts which of the possible classes the input belongs to. The input data is treated as an x-dimensional vector. It builds a model by constructing a set of hyper planes in a high dimensional space. For an x-dimensional vector, (x-1) hyper planes are created. A good separation is achieved by the hyper plane that has the largest distance to the nearest training data points of any class and is the functional margin. The larger the margin, the better is the classification
III. Algorithm
Problem Definition: The iris is used to authenticate a person. The objectives are:
i) Reducing the complexity of the algorithm by eliminating edge detection and normalization.
ii) To improve accuracy of recognition The algorithm of IRDWT to recognize a person using iris localization DWT, PCA and multi classifiers is given in Table 1
Table 1: Algorithm of PIRDWT Input: Eye image
Output: Recognition of a person Step 1: Read the eye image. Step 2: Iris template creation.
Step 3: Histogram equalization on the iris template. Step 4: The coiflet wavelet is applied and the
approximation band is considered . Step 5: PCA is applied on approximation band to form feature vector.
Step 7: Form the signature of each image. Step 8: Perform steps 1 to 7 for test image.
IV. Performance Analysis
The CASIA version 1.0 database is used for the performance analysis. The database consists of iris images of 108 individuals. It has seven samples for each person out of which six samples are used to create the database of 648images and one sample per person is used for the test image. The seven iris samples of a person are shown in figure 11.
Figure 11:Iris samples of one person from CASIA.
The recognition rate i.e., Success Rate (SR) using an Equation 12.
(12) The SR for different number of features with KNN, RF and SVM are tabulated in the Table 2. It is observed that the SR improves as the number of features increases from 10 to 50. KNN classifier gives better SR compared to RF and SVM.
Table 2:Accuracy of recognition for different number of frs.
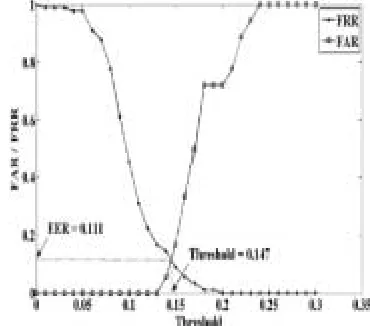
The performance parameters such as FAR, FRR and EER are evaluated by splitting total database of 108 persons
into 90 and 18 persons. The database is created for 90 persons with 6 images per person i.e., total number of images in the database are 540. FRR is calculated by comparing seventh image of every individual with 540 images in the database of 90 persons. FAR is calculated by considering 18 individuals as imposters and are compared with 540 images in the database. The variations of FAR and FRR with threshold is shown in the Figure 12. It is noticed that for lower values of threshold, there is a possibility of genuine samples being rejected and hence the FRR is high and for higher values of threshold, invalid samples could also be accepted as a valid match, hence the FAR is high. The value of n EER is 0.111.
Fig.12. Plot of FAR and FRR vs. threshold. The efficiency of the existing algorithm, Iris Recognition using Discrete Wavelet Transform (IRDWT) is compared with the our proposed novel approach IRDWT & PCA is given in Table 3. The efficiency of the proposed algorithm is improved by increasing the number of features and using morphological localization with reduced region of interest in the iris portion compared to the existing algorithm.
Table 3: Comparison of efficiency between existing and proposed algorithm.
V. Conclusion
Iris pattern recognition is one of the most reliable, secure and promising approaches for individual authentication. In this paper IRDWT and PCA algorithm based on DWT and PCA is proposed. The basic morphological operations such as dilation and erosion are used to remove the eyelashes and eyelids. Histogram equalization is applied to get the high contrast iris image. As per the Springer Analysis of CASIA data base maximum features will be Number of
features per image
Success Rate(%)
KNN RF SVM
50 99.07 98.15 97.22
40 99.07 98.15 97.22
30 94.45 98.15 97.22
20 90.75 97.22 97.22
10 78.70 89.81 87.96
Algorithms Number of Features
Efficiency Existing
IRDWT [27]
24 98.98
Proposed IRDWT & PCA
found in iris image at the radius of 90 to 125 pixels on left and right of the pupil boundary. In our algorithm 45 pixels portions of the iris to the left and right of the pupil is considered to get the template. Using DWT and PCA the feature vector is generated. The matching of test iris and data base iris is performed using KN, RF and SVM Classifiers. It is found that the success rate is better in the case of KNN classifier compared to RF and SVM. In future the features are generated by different techniques and are fused with multiple classifiers.
References
[1] P.Thumwarin,N.Chitanot,T.Matsuura“Iris recognition based on dynamic radius matching of iris image” IEEE International conference,vol 978.1.4577.2,pp 1-4,2012. [2] Yun Zhang,Zheng Ma,Yufeng He“A High speed iris recognition system based on DM6446”IEEE International conference on digital object identifier,vol 978.1.4577.3,pp 1518-1522,2012.
[3] Man Zhang,Zhenan Sun,Tieniu Tan“Deformable daisy matcher for robust iris recognition ”18th IEEE International conference on Image processing,vol 978.1.4577.1303.3,pp 3189-3192,2011.
[4] S.Hariprasath, V.Mohan “Biometric personal identification based on a iris pattern recognition using wavelet packet transform”second international conference on computing,communication and networking technologies,vol 978.1.4244.6589,pp 1-5,2010
[5] Amol.D.Rahulkar,Raghunath.S.Holambe,“Half iris feature extraction and recognition using a new class of biorthogonal triplet half -band filter bank and flexible k-out-of-n:A post classifiers”,IEEE tansactions on information forensics and security,vol.7,pp 230-240,feb 2012.
[6]FatmaZakySakr,MohammedTaher,Ayma.M.Wahba,“Hi gh performance iris recognition system on GPU”,IEEE international conference on digital object identifier,vol 978.1.4577.0128.3,pp 237-242,2011
[7] Nor’aini Abdul Jalil,Rohilah Sahak, Azilah Saparon,“A comparision of iris localization techniques for pattern recognition analysis”Sixth Asia conference,vol 978.0.7695.4730.5,pp 75-80,2012.
[8] Byung Jun Kang ,Kang Ryoung Park,“Real Time Image Restortion for Iris Recognition Systems”IEEE transactions on Systems, MAN and Cybernetics,vol 37,pp 1555-1566,2007
[9] Sunpreet. S.Arora, Mayank Vatsa, Richa singh,Anil Jain,“Iris Recognition under Alcohol Infulence:A Peliminary Study”,5th IAPR International conferenece ,vol 978.1.4673.0397.2,pp 336-341,2012.
[10] J.Raja Sekar,S.Arivazhagan, R.Anandha Murugan,“Methodology for iris segmentation and recognition
Using multi-resolution transform”,3rd IEEE International conference, vol 978.1.4673.3,pp 82-87,2011.
Authors Profile
Manjunath.M is currently working as Assistant Professor, Department of Electronics and Communication Engineering, Brindavan College of Engineering, Bangalore. He obtained his B.E., in Electronics and Communication Engineering from S.J.C. Institute of Technology, Chickballapur, Karnataka, in the year 2010 and also obtained his Postgraduation, M.Tech (Signal Processing) from S.J.C. Institute of Technology, Chickballapur, Karnataka, India, in the year 2012. His research interests include Signal Processing, Image processing, Biometrics, Pattern Recognition etc.