Brain Tumor MRI Using Gradient Profile
Sharpness
R. Pradeep Kumar Reddy
Research Scholar, Department of Computer Science and Engineering, YSREC of YVU, Proddatur-516360 Email: [email protected]
Dr. C. Nagaraju
Associate Professor, Department of Computer Science and Engineering, YSREC of YVU, Proddatur-516360 Email:[email protected]
---ABSTRACT--- The most precious field in digital image processing is diagnosing the internal activities of human body. Brain is one of the critical part in human body. In the current era cancer is a challenging in medical field. Identification of tumor in brain is very difficult. Segmentation is a kind of method in digital image processing used to divide the image into number of parts with specific regions. It is important to notice that resolution is the key factor in identification of tumors. In this paper we proposed efficient modified K-mean clustering along with triangular model for detection of brain tumor. Modified K-mean clustering includes image enhancement for clear detection of tumor using gradient profile sharpness. Further tumor is detected using triangular model.
Keywords -Image segmentation, K-Means clustering, MRI images, Triangle model, Tumor detection.
--- --- Date of Submission: Feb 10, 2018 Date of Acceptance: March 07, 2018 --- ---
1
INTRODUCTIONP
reprocessing is a practice to form a digital output of an image. To recognize object easier many number of image processing methods are available. Digital and Analog are two methods which are used to process the image. To produce photographs and printouts Analog technique is used. To digitize the input image digitization method is applied in image processing.Medical imaging techniques such as Magnetic Resonance Imaging (MRI) and CT scan which is mostly depended on computer technology is used to find out interior parts of human. Due to the usage of radio pulses in MRI instead of X-rays which is used in case of CT scan, MRI is less harmful to human body when compared to CT scan. To view the third dimension of human body CT and Ultra MRI techniques are used in today's environment. 1.1.BRAIN TUMOR:
An unusual and unrestrained cell division is the main reason for creation of tumor in any part of the human body. A brain tumor[4]causes for growth of abnormal cells in the brain or close to the brain. There are different types of brain tumors: some of them are noncancerous known as benign which has no regular shape, and some of the brain tumors are cancerous known as malignant which has regular shape. Tumors can begin in the brain or it can begin in other parts of the body and spread to the brain. The tumor that begins in the brain are called major brain tumors and the tumors that spreads from other parts of the body are known as inferior or metastatic brain tumors. The growth of brain tumor varies greatly from one person to other. The effect of tumor on the functioning of the nervous system depends on the growth rate of the tumor
and its location. According to that, the treatment options of brain tumor depend on type of the brain tumor, its size and location.
Nearly 3000 children are identified with brain tumor in US. Almost half will die below five years, making it the most serious cancer among the children. Symptoms of brain tumor varies depending on the tumor location within the brain and tumor size. Sternness of symptoms does not depend on size of the tumor. A small tumor can cause severe symptoms. The common symptom of brain tumors is headache, but usually accompanied by another symptom. This paper deals about detection of malignant form of brain tumor.
2.
E
XISTINGM
ETHODClustering technique playing key role in detection of tumors in MRI images[9], certain group of pixels represented as group with similar relationship called a cluster. Clustering[5] comes under unsupervised classification technique. It is named as unsupervised classification, because the code automatically classifies objects based on the given criteria of the user. In this method, segmentation[6][2] is done by K-Means clustering algorithm and morphological operations[11] are applied on that image to detect brain tumor from the MRI. The block diagram for existing method is as follows:
The output of MRI scan is taken as input in this method. To avoid the noise if any, present in the image will be removed in the preprocessing stage by using median filters. Then K-means clustering algorithm is applied on the preprocessed image for the segmentation of an image. After applying K-Means clustering there is a possibility of occurrence of mis-clusters, to avoid them morphological filtering is applied to detect position and extent of the tumor[10].
2.1.Existing Algorithm
The existing algorithm is as follows:
1. Let us consider the input image is divided into x1,…, xM are N data points.
2. Choose cluster centres from no.of clusters that is c1...ck.
3. Calculate aloofness between each pixel and each cluster centre.
4. J=|
x − c
| is distance function where i=1,…,N and j=1,…,k, where |x − c
|, denotes absolute distancebetweenx
andc
from the respective clusters and data points.5. The relation x
C
if |x-c
|<|x-c
| where i=1,2,…,k, and i≠j,6. The cluster centre is calculated and updated using
c =
i
∑
x cix
, where i=1,…,k, andm
refers number of objects in the dataset ,𝐶
𝑖 refers the centre of cluster .7. From Step 5 to Step 8 repeat the statements until convergence is met.
8. There may be miss-clustered regions after segmentation to improve the performance in tumour detection morphological filter is applied. 2.2.Limitations of existing method
Due to low resolution in images[7] there is a possibility of missing the exact location of tumor part. So improve the quality of image the low resolution image has to be converted into high resolution image.
3.
PROPOSED METHOD
Super resolution based gradient profile sharpness is introduced in proposed method for single image. High resolution is achieved from low resolution images with super resolution. The high resolution images place a classical role in crucial situations such as remote sensing, medical imaging etc.. Down sampling is a procedure which produces high resolution to low resolution in super resolution[12] method. The super resolution techniques are classified into three types:
Interpolation based approach.
Learning based approach.
Reconstruction based approach.
Interpolation based approach: It is a basic approach in super resolution method. By interpolation and by cubic are very popular approaches in practice with this approaches it is able to achieve fast computation speed.
Learning based approach: This approach identifies details of loss of lofty frequency details in low resolution images and loss can be retrieved by using dictionary of image patch pairs.
Reconstruction based approach: It enforces a constraint for down sampled version of high resolution images to be smoothed with respect to consistency of low resolution images.
Sharp edges are always constructed with the help of large gradient magnitude while smooth edges are constructed with group of scattered pixels by using week magnitudes. The gradient profile[8] sharpness is represented in traditional method by using gcd model. It is a symmetric model with most of the edges even they are in complicated shapes.
Existing K-mean cluster algorithm is considered to cluster the image for clear detection of tumor rather than other clustering algorithms i.e., c-mean, fuzzy etc., but it is also possible to consider other clustering algorithms for detection of tumor.
3.1.Gradient Profile
Gradient profiles are characterized centre pixels in image. In gradient field Zero-Crossing pixel is identified with local maximum by its gradient direction.
I = δxI, δyI = m. N
⃗⃗
(1)= √ δxI + δyI
(2)⃗⃗ = arctan δxI δyI
⁄
(3)Image is convolve by discrete gradient operator to obtain
δxI
andδyI
.
3.2.Gradient Profile Sharpness
After finding the gradient profile for image Gradient Profile Sharpness is applied. Sharpness of the gradient profile is estimated by square root of the variance of gradient profile.
𝜎(
) = √∑
𝑝 (4)Where
= ∑
𝑝 andare the lengths of Gradient Profile Curve. Global optimization is applied to enforce better profile sharpness with this consistency is attained for gradient profiles.
3.3.Profile Sharpness Distribution
blurred automatically. To avoid this values of gradient profiles distributed among smaller values of natural images which implies to achieve better appearance to find the sharpness distribution density function is applied on natural images.
𝑔 𝜎 = 𝜎
−(
⁄ )
𝜃
⁄
𝜃
(5)3.4.Gradient Field Transformation
The main aim of Gradient Field Transformation is that to estimate gradient field of the target image. Before transformation it is essential to study about gradient profile ps in the field of gradient profile pg. The target gradient profile is estimated through multiplying ps. The transformation ratio is calculated by using.
= 𝑔 ; 𝜎 , 𝜆 𝑔 ; 𝜎 , 𝜆
⁄
= .
{− 𝛼 𝜆 . |
;
| 𝜎
⁄
𝜆+
𝛼 𝜆 . |
;
| 𝜎
⁄
𝜆}
(6)In this c, x and x0 are the pixel and edge pixel of gradient profile r is the transform.
3.5.K-Mean Clustering
It is a unsupervised algorithm. The aim of this algorithm is to find groups in data. The no. of groups is represented with variable K. Depending on the features of Image. Algorithm assigns each pixel to the K groups iteratively. Depending on the similarity pixels are clustered. Each cluster is labelled with new group of pixels.
Each centroid of cluster represents the features values. Basically this algorithm is implemented with following steps.
Data Assignment Step
Centroid Update Step
Data Assignment Step: Each cluster is defined with a centroid. In this step, each data pixel is assigned to its near centroid depending on Squared Euclidean distance. For example ci is the collection of Centroid set C, then each data pixel is assigned to cluster based on Euclidean distance.
Centroid Update Step: Centroids are recomputed by taking mean of all data pixels that are assigned to centroids cluster.
3.6.Triangle Model
The purpose of collinear implementation is to optimize number of contours[1] and eliminating contours that are very nearer to actual boundary. It is achieved by using centroid equation which is shown as below
𝑖 𝐶 = {∑𝑛𝑘= 𝑘,∑𝑛𝑘= 𝑘} (7)
The collinear equation is carried out from centre of the boundary and each contour is determine with the help of slope and intercept. Equation for slope and intercept are shown below
= + (8)
= ∑∑ −∑ ∑− ∑ (9)
𝑖 = ̅ − ̅ (10)
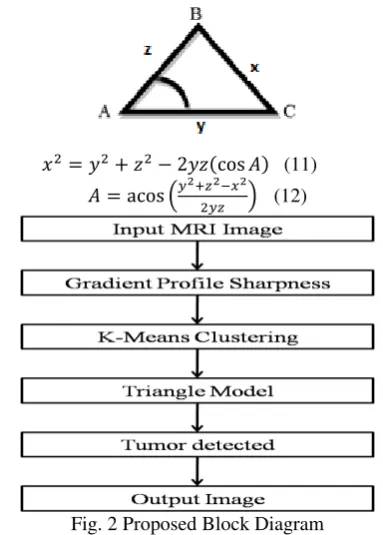
The following figure shows a single triangle where distances are measures by using lower case alphabets to estimate distance between any two disconnected points the following equation are proposed in triangle model.
= + − cos 𝐴 (11)
𝐴 = acos + − (12)
Fig. 2 Proposed Block Diagram
The output of MRI scan is taken as input in this process, to avoid noise pre-processing techniques such as median filter is used. Then the image is undergone through triangle mode land to avoid mis-clusers k-means clustering[3] algorithm is used. 3.7.Proposed Algorithm
The proposed algorithm is as follows:
1. The gradient profile pixels
x , x , x , … … … . . x are considered
and then store that pixel values into a matrix m[i,j]= x , x , x , … … … . . x .
2. Then preprocessing technique is applied on that image gradient profile pixels,then m[i,j] = min(x , x , x , … … … . . x ) 3. The mean of all gradient profile pixels is
calculated as ,m =
+ + +⋯……….+ 𝑛then is calculated,
which is difference between mid pixel value and the mean, h is calculated by finding and storing the difference between each pixel value and the mean value in a matrix and applying maximum function on that matrix. 4. The gradient magnitude of a pixel x is
mT x =
{k ∗ dx+ h if mean value > otherwise } and the slope is fitted by using k =
min ∑x p mT x − k ∗ dx− h
5. Let y ,...…, yM are N data points in the input image, let k be the number of clusters which is given by the user.
6. Choose cluster centres from no.of clusters that is c1...ck.
7. Calculate aloofness between each pixel and each cluster centre.
8. J=|x − c| is distance function where
i=1,…,N and j=1,…,k, where |x − c|, denotes absolute distancebetween xand c from the respective clusters and data points. 9. The relation x C if |x- c |<|x-c| where
i=1,2,…,k, and i≠j, then distribute data points
10. The cluster centre is calculated and updated using c =
i∑x cix, where i=1,…,k, and
m refers no.of objects in the dataset , 𝐶𝑖 refers the centre of cluster .
11. From Step 9 to Step 11 repeat the statements until convergence is met.
12. Apply the triangular model for tumour
detection = + − cos 𝐴
𝐴 = acos + −
4.
RESULTS
Fig. 3 (a) original MRI image (b) Existing Method (c) Proposed Method
Fig. 4 (a) original MRI image (b) Existing Method (c) Proposed Method
Fig. 5 (a) original MRI image (b) Existing Method (c) Proposed Method
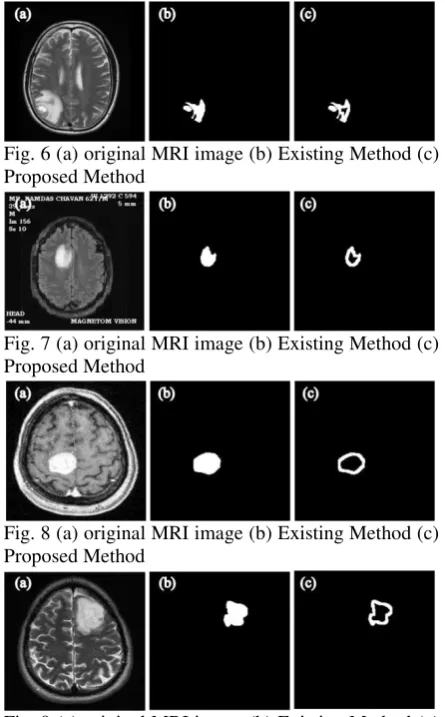
Fig. 6 (a) original MRI image (b) Existing Method (c) Proposed Method
Fig. 7 (a) original MRI image (b) Existing Method (c) Proposed Method
Fig. 8 (a) original MRI image (b) Existing Method (c) Proposed Method
Fig. 9 (a) original MRI image (b) Existing Method (c) Proposed Method
4.1. Mean Square Error (MSE) and Peak Signal to Noise Ratio (PSNR), Root Mean Square Error(RMSE) The MSE and the PSNR are the two error measurements used to compare image compression quality. The MSE represents the cumulative squared error between the compressed and the original image, whereas PSNR represents a measure of the peak error. To compute the PSNR, the block first calculates the mean-squared error using the following equation:
𝐸 = ∑ [𝐼, , ∗− 𝐼 , ]
In the previous equation, M and N are the number of rows and columns in the input images, respectively. Then the block computes the PSNR using the following equation:
𝑃 = 𝑔 𝐸
RMSE is estimated by applying the sqrt() to the MSE. The equation follows as:
𝐸 = √∑ [𝐼, , ∗− 𝐼 , ]
Fig. 10 Comparison between existing and proposed method of PSNR
Fig. 11 Comparison between existing and proposed method of SNR
Fig. 12 Comparison between existing and proposed method of MSE
Fig. 13 Comparison between existing and proposed method of RMSE
5. CONCLUSION
The highly challenging field in image processing is medical image processing. The Brain Tumor is a serious issue, where several methods had developed to detect the tumor. The surgical planning and treatment planning has been done with segmentation of brain in medical field. There exists different kinds of systems available for brain MR image segmentation for detection of tumor location. But because of low resolution images, detection correct location of tumor is difficult. The proposed system converts the low resolution image into high resolution image by using efficient modified K-mean clustering for clear detection of tumor using gradient profile sharpness.
Further tumor is detected using triangular model. By this, the exact location and extent to which the tumor has spread can be determined. Also it can be extended for color images and random fields
REFERENCES
[1] V. Caselles, F. Catte , T. coll, and F. Dibos, “A
geometric model of active
contours,”NumerMath.,vol. 66, pp 1-31, 1993. [2] Matalas, S. Roberts and H. Hatzakis, "A set of
multiresolution texture features suitable for unsupervised image segmentation," European Signal Processing Conference, 1996. EUSIPCO 1996. 8th, Trieste, Italy, 1996, pp. 1-4.
[3] M. Masroor Ahmed, Dzulkifli Bin Mohamad, “Segmentation of Brain MR Images for Tumor Extraction by Combining Kmeans Clustering and Perona-Malik Anisotropic Diffusion Model”, International Journal of Image Processing, vol. 2 , no. 1, pp 27-34,2008.
[4] T. Logeswari and M. Karnan, "An Improved Implementation of Brain Tumor Detection Using Soft Computing," Communication Software and Networks, 2010. ICCSN '10. Second International Conference on, Singapore, 2010, pp. 147-151. [5] Dancea O, Tsatos O, Gordan M, et al. ”Adaptive
fuzzy c-means through support vector regression for segmentation of calcite deposits on concrete dam walls”, Automation Quality and Testing Robotics, 2010, 3: 1-6.
[6] AkanshaSingh , Krishna Kant Singh, “A Study Of Image Segmentation Algorithms For Different Types Of Images”, International Journal of Computer Science Issues, vol. 7,Issue 5, pp 414-417,2010.
[7] G. Freedman and R. Fattal, “Image and video up scaling from local self examples,” ACM Trans. Graph., vol. 30, no. 2, pp. 1–12, Apr. 2011. [8] J. Sun, J. Sun, Z. Xu, and H.-Y. Shum, “Gradient
profile prior and its applications in image super-resolution and enhancement,” IEEE Trans. Image Process., vol. 20, no. 6, pp. 1529–1542, Jun. 2011.
[9] Ahmed Faisal, SharminParveen, ShahriarBadsha and Hasan Sarwar, “An Improved Image Denoising and Segmentation Approach for Detecting Tumor from 2-D MRI Brain Images”, International Conference on Advanced Computer Science Applications and Technologies, pp. 452-457, 2012.
[10]Pratibha Sharma, ManojDiwakar, SangamChoudhary, "Application of Edge Detection for Brain Tumor Detection", International Journal of ComputerApplications, vol.58, no.16, pp 21-25, 2012.
Geographical Information System Applications and Remote Sensing, Vol. 4, No. 1, 2013.
[12]T. Peleg and M. Elad, “A statistical prediction model based on sparse representations for single image super-resolution,” IEEE Trans. Image Process, vol. 23, no. 6, pp. 2569–2582, Jun. 2014. Biographies and Photographs
R. Pradeep Kumar Reddy received his B.Tech. Degree in Computer Science and Engineering from Bellary Engineering College, Bellary (VTU)., M.Tech. Degree in Computer Science and Engineering at S.R.M University,
Chennai and currently pursing PhD. from Yogi Vemana University under the esteemed supervision of Dr. C. Naga Raju. Currently He is working as Assistant Professor in the Department of CSE at YSR Engineering College of Yogi Vemana University, Proddatur. He has got 12 years of teaching experience. He has published 10 research papers in various National and International Journals and about 8 research papers in various National and International Conferences. He has attended 10 workshops. He is a member of ISTE.