Original Research Article
Nutritional status and cognitive impairment in elderly population in a
rural area of Thrissur district, Kerala
Remya Ramachandran, Jenyz M. Mundodan*, C. R. Saju, Vidhu M. Joshy
INTRODUCTION
Population ageing is a global phenomenon. It is estimated that between 2015 and 2050, the proportion of the world's population over 60 years will nearly double from 12% to 22%. The people aged 60 years and older are expected to outnumber children younger than 5 years by 2020.1 Old age dependency ratio is expected to be more than 35 per 100 persons aged 15-64 by 2050, as a result of which the total dependency ratio will likely show an upward trend.2 In India, the size of elderly population is increasing over time. From 5.6% in 1961, the proportion has increased to 8.6% in 2011. State-wise data reveal that Kerala has
maximum proportion of elderly people in its population (12.6%).3
Age-related cognitive decline is a main predictor of disability among elderly people. Several studies suggest that nutritional status, as well as health behaviours, frailty, disability, functionality status and chronic diseases (e.g. hypertension, cardiovascular disease, diabetes mellitus and metabolic syndrome) are associated with cognitive impairment and dementia.4 Cognitive impairment, being the most consistent and characteristic symptom of Alzheimer’s disease, can be considered a proxy for the disease in population based studies.5
ABSTRACT
Background: The past decade has witnessed a marked increase in elderly population of India. This rapid ageing will substantially increase the number of elderly individuals, who are affected by cognitive impairment. Recent studies suggest the association between malnutrition and cognitive impairment in elderly. This study aims to describe the nutritional status and cognitive impairment in elderly population in a rural area of Thrissur district, Kerala.
Methods: A community based cross-sectional study was conducted in 100 elderly residents of Adat Panchayat, Thrissur, from January to April 2016. Data was collected using a pre-tested structured questionnaire, which included socio-demographic variables, self-reported physical morbidities, mini mental state examination (MMSE) scale and mini nutritional assessment (MNA) scale.
Results: The prevalence of cognitive impairment and malnutrition in elderly was noted to be 55% and 12% respectively. Factors showing significant association with MMSE score included older age groups, female gender, elderly belonging to BPL families, financial dependence, single/widowed status and sleep difficulties. The association between cognitive impairment and nutritional status was found to be statistically significant with a p value of <0.001. A moderate to strong correlation was observed between MNA score and MMSE score (r=0.623).
Conclusions: There is an association between cognitive impairment and nutritional deficit. Therefore it is essential to screen elderly for nutritional status while assessing cognitive impairment.
Keywords: Cognitive impairment, Elderly, MMSE, MNA, Nutrition
Department ofCommunity Medicine, Amala Institute of Medical Sciences, Thrissur, Kerala, India
Received: 21 January 2018
Accepted: 10 February 2018
*Correspondence:
Dr. Jenyz M. Mundodan, E-mail: [email protected]
Copyright: © the author(s), publisher and licensee Medip Academy. This is an open-access article distributed under the terms of the Creative Commons Attribution Non-Commercial License, which permits unrestricted non-commercial use, distribution, and reproduction in any medium, provided the original work is properly cited.
Nutrition is known to be a key factor that modulates ageing. Association between nutritional status of elderly and their cognitive status, particularly in those who are malnourished and at risk of malnutrition, have been found both in hospital and community based research.6-8 These findings reflect the need to study the cognitive impairment and its association with nutritional status amongst elderly in rural areas of a state like Kerala with a significant proportion of the population in the elderly age group. This study aims to describe the nutritional status and cognitive impairment in elderly population in a rural area of Thrissur district, Kerala.
METHODS
A cross sectional survey was conducted among elderly residing in Adat Panchayat of Thrissur district, Kerala over a period of 4 months from 1st January to 30th April 2016. One hundred elderly individuals were selected from the study area by systematic random sampling from the electoral roll available with the Panchayat.
Data was collected from selected participants using questionnaires, which were administered by the interviewer after explaining the study purpose and taking the written informed consent. The questionnaire included the following parts: socio-demographic data, use of habit forming substances, physical morbidities as per history given by the study subjects, cognitive assessment by Mini Mental State Examination (MMSE), and nutritional assessment by Mini Nutritional Assessment (MNA). The MMSE scale consists of seven parts: temporal orientation, spatial orientation, learning, calculation, short-term memory, communication and constructive apraxia.9 The maximum score is 30. Those with MMSE scores ≤25 were considered “cognitively impaired” in the present study. These cognitively impaired individuals were further classified as severe (MMSE score ≤10), moderate (MMSE score 11-21) or mild (MMSE score 22-25).10
The MNA scale is used to assess nutritional status of elderly. It is a questionnaire of 18 items which include anthropometry measures, global evaluation, evaluation of dietary habits, and subjective assessment. A score of less than 17 points (out of a maximum of 30) is regarded as an indication of malnutrition, 17-23.5 points indicate a risk for malnutrition and >23.5 points indicate that the person is well nourished.11
Ethical Clearance was obtained from Institutional Ethics Committee of Amala Institute of Medical Sciences, Thrissur prior to commencement. Data were entered and analysed using the statistical software SPSS (Statistical Package for Social Sciences) version 23. A p value of <0.05 was considered significant. Pearson’s Chi-square
Student's t-test and ANOVA were used for comparison of quantitative variables between two groups and more than two groups, respectively. Pearson’s correlation was used to study the relation between two quantitative variables, i.e. MMSE and MNA scores.
RESULTS
Of the 100 participants, more than half (55%) were in the age group of 60-70 years. The median age of the sample was 69 years (IQR=64-76). The median age of males (70 years) was higher than females (69 years), though the difference was not statistically significant. A comparable BMI was found in both the sexes.
Figure 1: Cognitive impairment according to MMSE.
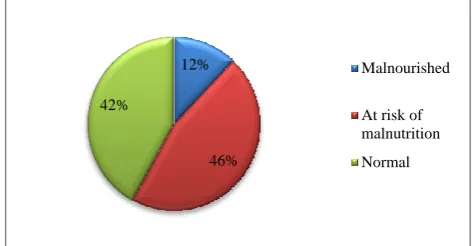
Figure 2: Nutritional status according to MNA score.
The mean MMSE score was 23.13±5.54. Cognitive impairment was noted to be severe in 7%, moderate in 58% and mild in 35% (Figure 1). The mean MNA score was 22.275±4.763; malnutrition was noted in 12%, 46% were at risk of malnutrition and 42% of normal nutritional status (Figure 2).
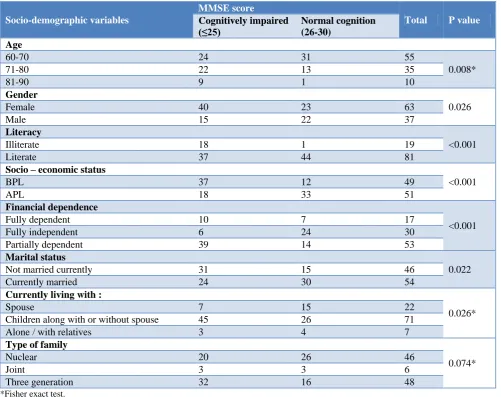
Among the various demographic characteristics, elderly in the age group of 81-90 years (p=0.008), female gender (p=0.026) and elderly belonging to BPL families (p<0.001) were found to have significantly lower MMSE scores. MMSE presented a significant difference in relation to financial dependence and literacy status (p<0.001) (Table 1). There was no significant association
35%
58% 7%
Mild Moderate Severe
12%
46% 42%
Malnourished
Table 1: Socio-demographic characteristics and MMSE Score.
Socio-demographic variables
MMSE score
Total P value
Cognitively impaired (≤25)
Normal cognition (26-30)
Age
60-70 24 31 55
0.008*
71-80 22 13 35
81-90 9 1 10
Gender
0.026
Female 40 23 63
Male 15 22 37
Literacy
<0.001
Illiterate 18 1 19
Literate 37 44 81
Socio – economic status
<0.001
BPL 37 12 49
APL 18 33 51
Financial dependence
<0.001
Fully dependent 10 7 17
Fully independent 6 24 30
Partially dependent 39 14 53
Marital status
0.022
Not married currently 31 15 46
Currently married 24 30 54
Currently living with :
0.026*
Spouse 7 15 22
Children along with or without spouse 45 26 71
Alone / with relatives 3 4 7
Type of family
0.074*
Nuclear 20 26 46
Joint 3 3 6
Three generation 32 16 48
*Fisher exact test.
Table 2: Factors associated with cognitive impairment.
MMSE Score
Total P value
Cognitively impaired (≤25)
Normal cognition (26-30)
Addictions
Tobacco chewing 13 4 17 0.051
Alcohol 7 10 17 0.209
Smoking 4 5 9 0.505*
Snuff 0 1 1 0.267*
Physical morbidities
Diabetes Mellitus 20 11 31 0.2
Hypertension 30 23 53 0.732
Dyslipidemia 12 10 22 0.961
Sleep abnormalities 18 7 25 0.049
Cardiac disease 10 6 16 0.511
Table 3: Association between cognitive impairment and nutritional status.
MMSE Score MNA Score Total P value Correlation
coefficient (r)
<17 (%) 17-23.5 (%) 24-30 (%)
≤10 2 (50) 2 (50) 0 4
<0.001 0.623
11-21 8 (25) 20 (62) 4 (13) 32
22-25 1 (5) 11 (58) 7 (37) 19
26-30 1 (2) 13 (29) 31 (69) 45
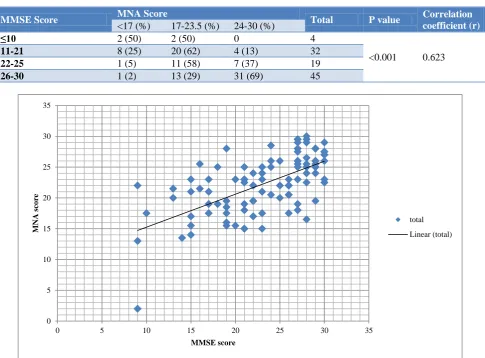
Figure 3: Correlation between MMSE Score and MNA score.
Significant association was observed between cognitive impairment and sleep difficulties (p=0.049) in the subjects. No association was observed between cognitive impairment and other morbidities. No significant association was seen between cognitive status and habit forming substances (Table 2).
MMSE score was significantly different between the age classes, with the mean score decreasing with increasing age (F=7.037, p=0.001). There was a negative correlation between MMSE Score and age, and this was found to be statistically significant (r= -0.394; p<0.001). Mean MNA score was also observed to decrease with increasing age (F=2.812, p=0.065). The direction of correlation between age and MNA score was negative (r = -0.279; p=0.005). Relation between cognitive impairment and nutritional status
Out of four subjects who had severe cognitive impairment, two were found to be malnourished. 25% of
45 subjects with normal cognition, 69% were well nourished. The association between cognitive impairment and nutritional status was found to be statistically significant with a p<0.001. A moderate to strong correlation was observed between MNA score and MMSE score (r=0.623) (Table 3) (Figure 3), A stronger correlation between MMSE and MNA scores was observed among males (r=0.792; p<0.001) than females (r=0.514; p<0.001).
DISCUSSION
To our knowledge, this is the first study in South India which examines the association between nutritional status and cognitive function of community residing elderly. Cognitive impairment and nutritional deficit among elderly have been studied separately; however, literatures studying the relation between the two are not common. The results of this study are similar to other research studies on cognitive function and nutritional status. 0
5 10 15 20 25 30 35
0 5 10 15 20 25 30 35
M
NA
sco
re
MMSE score
performance was independently associated with older age, female sex and illiteracy.12 In a study done among inmates of an old age home in Telengana, cognitive impairment was significantly associated with age (p=0.024) and lower education (p=0.04). Other factors associated with cognitive impairment in this study were female gender (p=0.426), marital status (p=0.627), low socioeconomic status (p=0.469) and nuclear family (p=0.06).13 Our study did not find a significant association between diabetes and cognitive impairment (p=0.2). This was in contrast to many studies including one in which Ojo et al reviewed the association between diabetes mellitus, cognitive decline and dementia, of various primary research articles. It showed that diabetes is a risk factor in the development of dementia. They further noted that a cognitive impaired diabetic individual is at risk of poor self-management, leading to further complications including inadequate control of diabetes, hypoglycaemia and hyperglycaemia.14
A study done using MNA scale for nutritional assessment in West Bengal found nearly 29% of the elderly to be malnourished and 60% to be at risk of malnutrition, which is much higher than the current study. Similar to our finding, females were significantly more malnourished than males.15
Similar findings to our study were noted in other published articles with regard to association between nutritional status and cognitive impairment. A study done in Brazil found underweight to be positively associated with altered cognitive function (OR: 3.52).16 A Lebanese institution-based cross-sectional study found a significant associationbetween the MMSE score and the MNA score (r=0.208; p=0.028).6 A recent study in Italy points towards the same conclusion (r=0.39; p=0.001).7
This relationship can be explained by the effect of dietary factors on multiple brain processes by regulating neurotransmitter pathways, synaptic transmission, membrane fluidity and signal-transduction pathways. Particularly to note is the effect of oxidative damage on the brain, wherein lies the importance of vitamins C, E and β-carotene.17
Many studies also throw light on the importance of dietary omega-3 fatty acids and vitamin B6, B12 and folate in the prevention of cognitive deterioration.18-20
This study has a few limitations. Our study was done on community dwelling elderly. Since the elderly residing in institutions were not studied, it may have led to an altered estimation of the prevalence of nutritional and cognitive impairment. Secondly, MMSE cut-off of 23 for those educated up to high school and 25 for those who underwent higher education are commonly used to indicate significant impairment. A cut-off of 25 has been used in this study considering the higher literacy status in Kerala. Hence, the prevalence of cognitive impairment in our study may be slightly higher than those studies which used 23 as MMSE cut-off.
CONCLUSION
Among the study subjects, there was significant association between nutritional status and cognitive impairment. However, the relationship between the two is complex and it is difficult to conclude whether malnutrition contributes to cognitive impairment or vice versa. Further studies are required to know whether prevention and treatment of malnutrition in elderly can limit the progression of cognitive impairment in them.
Funding: No funding sources Conflict of interest: None declared
Ethical approval: The study was approved by the Institutional Ethics Committee of Amala Institute of Medical Sciences, Thrissur, Kerala
REFERENCES
1. Suzman R, Beard J. Global Health and Aging. NIH Publ no 117737. 2011;1(4):273–7.
2. United Nations. World Economic and Social Survey 2007 ; Development in an Ageing World. 2007. 3. Elderly in India. 2016;26–8. Available at:
http://mospi.nic.in/mospi_new/upload/ElderlyinIndi a_2016.pdf. Accessed on 5 November 2017. 4. Ogawa S. Nutritional management of older adults
with cognitive decline and dementia. Geriatr Gerontol Int. 2014;14 Suppl 2:17–22. Available at: http://www.ncbi.nlm.nih.gov/pubmed/ 24650061. Accessed on 5 November 2017.
5. Sengupta P, Benjamin AI, Singh Y, Grover A. Prevalence and correlates of cognitive impairment in a north Indian elderly population. WHO South-East Asia J Public Heal. 2014;3(2):135–43.
6. El Zoghbi M, Boulos C, Amal AH, Saleh N, Awada S, Rachidi S, et al. Association between cognitive function and nutritional status in elderly: A cross-sectional study in three institutions of Beirut-Lebanon. Geriatr Ment Heal Care. 2013;1(4):73–81 7. Malara A, Sgrò G, Caruso C, Ceravolo F, Curinga
G, Renda GF, et al. Relationship between cognitive impairment and nutritional assessment on functional status in Calabrian long-term-care. Clin Interv Aging. 2014;9:105.
8. Magri F, Borza A, del Vecchio S, Chytiris S, Cuzzoni G, Busconi L, et al. Nutritional assessment of demented patients: A descriptive study. Aging Clin Exp Res. 2003;15(2):148–53.
9. Folstein MF, Folstein SE, McHugh PR. “Mini-Mental State” A practical method for grading the cogntive state of patients for the clinician. J Psychiatr Res. 1975;12(3):189–98.
10. van der Flier WM, Scheltens P. Use of laboratory and imaging investigations in dementia. J Neurol Neurosurg Psychiatry. 2005;76(Suppl 5):v45–52. 11. Guigoz Y, Lauque S, Vellas BJ. Identifying the
12. Ferdous T, Cederholm T, Kabir ZN, Hamadani JD, Wahlin Å. Nutritional Status and Cognitive Function in Community-Living Rural Bangladeshi Older Adults: Data from the Poverty and Health in Ageing Project. J Am Geriatr Soc. 2010;58(5):919– 24.
13. Rao S, Kumar S. A Cross-Sectional Study of Cognitive Impairment and Morbidity Profile of Inmates of Old Age Home. 2014;2:1506–13. 14. Ojo O, Brooke J. Evaluating the association
between diabetes, cognitive decline and dementia. Int J Environ Res Public Health. 2015;12(7):8281– 94.
15. Lahiri S, Biswas A, Santra S, Lahiri S. Assessment of nutritional status among elderly population in a rural area of West Bengal, India. Int J Med Sci Public Heal. 2015;4(4):569.
16. Caroline Boscatto E, da Silva Duarte M de F, Silva Coqueiro R da, Rodrigues Barbosa A. Nutritional status in the oldest elderly and associated factors. Rev da Assoc Médica Bras (English Ed). 2013;59(1):40–7.
17. Gonzalez-Gross M, Marcos A, Pietrzik K. Nutrition and cognitive impairment in the elderly. Br J Nutr. 2001;86(3):313–21.
18. Barberger-Gateau P, Letenneur L, Deschamps V, Pérès K, Dartigues J-F, Renaud S. Fish, meat, and risk of dementia: cohort study. BMJ Br Med J. 2002;325(7370):932–3.
19. Agnew-Blais JC, Wassertheil-Smoller S, Kang JH, Hogan PE, Coker LH, Snetselaar LG, et al. Folate, Vitamin B6 and Vitamin B12 Intake and Mild Cognitive Impairment and Probable Dementia in the Women’s Health Initiative Memory Study. J Acad Nutr Diet. 2015;115(2):231–41.
20. Shen L. Associations between B Vitamins and Parkinson’s disease. Nutrients. 2015;7(9):7197–208.