Original Research Article
A community based cross sectional study to assess the prevalence and
pattern of co- morbidities among known type 2 diabetic patients of
urban slum of North Karnataka, India
Tanuja P. Pattankar
1*, Shailaja S. Patil
2INTRODUCTION
Diabetes mellitus (DM) is one of the oldest disease known by man.1 In 1988, type 2 DM was described as a element of metabolic syndrome.2 Type 2 DM (formerly known as non-insulin dependent DM) is the most common type of DM characterized by body’s ineffective use of insulin. It is an outcome of interaction between environmental, genetic, and behavioral risk factors.3 People living with type 2 DM are exposed to various forms of short- term and long-term complications, which
frequently lead to early onset death. This increased tendency of morbidity and mortality is because of uniqueness of type of DM which is ice berg phenomenon, characterized by insidious onset and late recognition, especially in resource-poor developing countries like India.4
Prevalence of diabetes mellitus has dramatically increased since last decade. The World Health Organization (WHO) had estimated that 9% of the world's population was diabetics in 2014, and around
ABSTRACT
Background: India is the second largest home for type 2 diabetes mellitus patients. The chronic nature of disease along with high prevalence of “co morbidities” make its management tricky. Hence this multiple health conditions lead to faster decline in quality of health, which poses a great concern on the health-care delivery system as well as on patients’ pocket. The objective of the study was to assess the prevalence of co-morbidities among known type 2 diabetic patients residing in urban slums of the field practice area of a Medical College in North Karnataka.
Methods: It was a cross-sectional study done in urban slums among type 2 diabetics, sample size was calculated to be 155. Semi-structured questionnaire was used to collect information regarding socio-demographic data and history of co-morbidities; height, weight and blood-pressure were measured using standard criteria. HbA1C level was checked using single use HbA1C Now+ kit by BHR diagnostics.
Results: Out of 158 type 2 diabetics in our study, 86.7% had presence of one or the other co-morbidity. 61.9% and 51.5% of male and female participants had HbA1c levels >7.0 respectively, this was statistically significant. HbA1c level and BMI were significantly associated with presence of co-morbidities in our study population.
Conclusions: Results show high prevalence of co-morbidities among type 2 diabetics. Hypertension, obesity, depression and neuropathy are the commonest co-morbidities. So, prevention of such co-existing diseases improves the quality of life of the sufferers.
Keywords: Type 2 diabetic mellitus, Co-morbidities, Hypertension, HbA1c
Department of Community Medicine, 1S. Nijlingappa Medical College, Navanagar, Bagalkot, 2BLDEU's Shri B M Patil Medical College, Vijayapura, Karnataka, India
Received: 14 February 2019
Revised: 25 March 2019
Accepted: 29 March 2019
*Correspondence:
Dr. Tanuja P. Pattankar,
E-mail: [email protected]
Copyright: © the author(s), publisher and licensee Medip Academy. This is an open-access article distributed under the terms of the Creative Commons Attribution Non-Commercial License, which permits unrestricted non-commercial use, distribution, and reproduction in any medium, provided the original work is properly cited.
90% of them were having type 2 diabetes mellitus. It is estimated that, type 2 diabetes leads to 5 million deaths every year, usually from cardiovascular diseases (CVD). It is expected to rise to 7th cause of death globally by 2030.5 Type 2 DM is the disease associated with life style changes; therefore its load is raising in low and middle income countries, as a result of influence of recent urbanization and industrialization.
India is the epicenter for diabetes mellitus epidemic in the world.6 It has second highest number of population with diabetes mellitus i.e., ~69 million individuals as of 2015.6 India has topped the world with the highest number of people living with type 2 diabetes mellitus in 2000, followed by China and United States in second and third place respectively.7 Hence it is called Capital of diabetes mellitus. Apart from being a chronic debilitating disease the high prevalence of co-existing chronic medical conditions or “co morbidities” make diabetes management a grueling task for the patient as well as for treating physicians.8 Preceding studies have established that most adults with diabetes have at least one co morbid state and 40% have three or more co morbid states, but still the perspective of the physicians and treatment strategies are more focused on management of diabetes alone.9,10 For best health care delivery and for developing strategies that support self-management among the diabetes patients, we need to realize how the number, type, and severity of co morbidities influence these patients’ management. In an overburdened health care system like India co morbid conditions may transform the providers’ attention away from diabetes.8 Co morbidities
may also serve as competing demands on patients’ resources, and possibly reduce the amount of time and energy left for diabetes self-care. Even conditions not straight away related to diabetes, such as pain and depression, are more prevalent in diabetics, thus stressing the need to take into account both diabetes-related and non-diabetes related co morbidities. Prior studies done in various parts of India have mostly concentrated on single co morbidities like either hypertension or depression or retinopathy etc. So, we conducted this study in the urban slum to emphasize on all the important co-morbidities that may be present in the type 2 diabetic patients.
Objectives
The objective of the study was to assess the prevalence of co-morbidities among known type 2 diabetic patients residing in the Urban slums of the field practice area of a Medical College in North Karnataka.
METHODS
It was a community based cross sectional study, conducted in the urban field practice area (Slum population) of BLDEU’s Sri B M Patil Medical College, Vijayapur which is situated in North Karnataka. The study was conducted between January 2016 and December 2016. The study population was known type 2
diabetic patients, they were identified by house to house survey of the area. The sample size was obtained by taking prevalence of self-reported type 2 diabetes mellitus as 10.22%, in Karnataka at 95% confidence interval and 5% absolute allowable error.11 The formula used for calculation was n=4pq/l2, sample size came to be 141, after taking 10% of non-compliance rate, final sample size calculated was around 155. People with known history of type 2 diabetes mellitus aged between 30-65 years were included in the study and diabetics patients aged <30 years and >65 years; people with gestational DM and type -1 diabetes mellitus patients and those who are not willing to participate in study were excluded from the study.
After obtaining ethical clearance from the Institutional ethical committee, the study was carried out. The purpose and nature of the study and confidentiality of the data were explained to the participants and their consent was taken, total 1260 houses were included for house to house survey covering the population of 10000, and enumeration of all the known type 2 diabetics in the age group of 30–65 yrs residing in the area was done. Participants who fulfilled the inclusion criteria were then interviewed using semi structured questionnaire to assess the socio-demographic characters and history of diabetic complications and co-morbidities, PHQ-9 was used to assess the depression.
Height was measured by using non stretchable measuring tape to the nearest of 0.1 cm. Weight was recorded using a standardized Bathroom weighing scale to the nearest of 0.1kg. Body mass index was then calculated. Two readings of blood pressure was recorded 5 minutes apart using a mercury sphygmomanometer on right arm in sitting posture. Average of two readings was used for analysis. Blood HbA1c levels were measured by using HbA1c Now+ Single use Kit.
Statistical analysis
The data was compiled in Microsoft (MS) Excel sheet and analyzed using SPSS (Statistical Package for Social Sciences) software version 16.0. All characteristics were summarized descriptively as numbers, percentage, and graphs wherever necessary. Chi square test (χ2
) was employed to determine the significance of associations between C-morbidities and socio-demographic data.
RESULTS
belonged to Muslim religion. Distribution of study population as per their education showed that, majority of 36.7% never had any formal schooling. More than ≈ 66% of the study participants were in Class IV and V of
modified B. G. Prasad classification. In our study 45% of the participants resided in nuclear family, followed by 34.8% in joint family and 20.3% in three generation family.
Table 1: Socio - demographic profile of study population.
Background variables N %
Age (in years)
30-40 58 36.7
41-50 36 22.8
51-60 42 26.6
>60 22 13.9
Sex Male 63 39.9
Female 95 60.1
Marital status
Married 142 89.9
Unmarried 2 1.3
Widow/widower/ separated 14 8.9
Religion Hindu 105 66.5
Muslim 53 33.5
Education
No formal education 58 36.7
Primary school 56 35.4
High school 34 21.5
Pre university 10 6.3
Occupation
Government 50 31.6
Private 51 32.3
Self employed 36 22.8
Home maker 21 13.3
SES
I (>6528) 2 1.3
II (3264 - 6527) 17 10.8
III (1959 - 3263) 35 22.2
IV (979 - 1958) 56 35.4
V (<978) 48 30.4
Type of family
Nuclear 71 44.9
Joint 55 34.8
Extended 32 20.3
Total 158 100
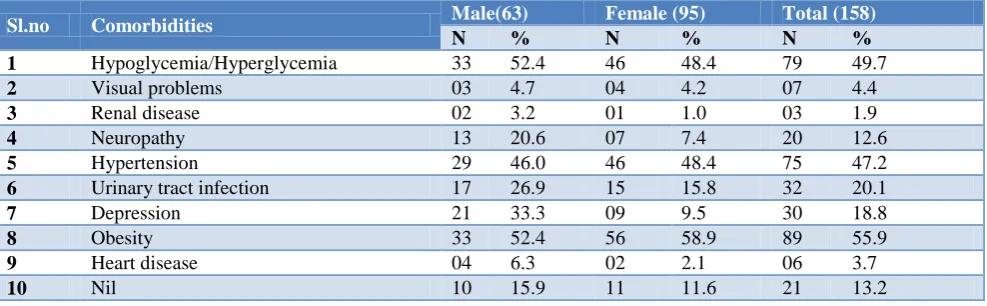
Table 2: Prevalence of comorbidities among the known type 2 diabetic patients.
Sl.no Comorbidities Male(63) Female (95) Total (158)
N % N % N %
1 Hypoglycemia/Hyperglycemia 33 52.4 46 48.4 79 49.7
2 Visual problems 03 4.7 04 4.2 07 4.4
3 Renal disease 02 3.2 01 1.0 03 1.9
4 Neuropathy 13 20.6 07 7.4 20 12.6
5 Hypertension 29 46.0 46 48.4 75 47.2
6 Urinary tract infection 17 26.9 15 15.8 32 20.1
7 Depression 21 33.3 09 9.5 30 18.8
8 Obesity 33 52.4 56 58.9 89 55.9
9 Heart disease 04 6.3 02 2.1 06 3.7
10 Nil 10 15.9 11 11.6 21 13.2
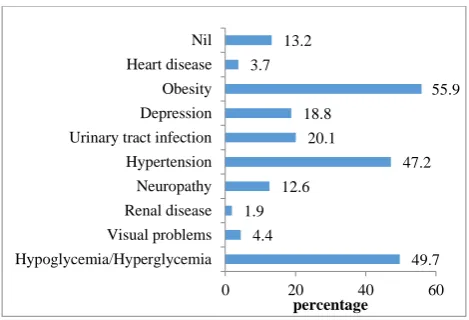
Distribution of pattern of co-morbidities among diabetics showed that 86.8% of the participants had either one or more co-morbidities along with type 2 diabetes mellitus. Obesity was most commonest with 55.9% of patients suffering, followed by hyper/hypoglycemia (49.7%),
was seen among 52.4% of males and 48.4% females. Co -morbidities like depression and heart disease was seen most commonly in males than in female participants
whereas glycemic control was poor in both male and females with 61.9% and 51.5% respectively having HbA1c levels >7.0.
Table 3: Distribution of glycemic control (HbA1C levels) among male and female participants.
HBA1C levels
Excellent (4.5-6.4) (n=13)
Good (6.5-7.0) (n=57)
Acceptable (7.1-8.0) (n=69)
Poor (>8.0) (n=19)
Total
(n=158) P value
N % N % N % N % N
Gender Male 5 7.9 19 30.1 26 41.3 13 20.7 63 0.037* Female 8 8.4 38 40.0 43 45.3 6 6.3 95
Table 4: Distribution of socio-demographic characteristics of type 2 diabetes patients by presence of comorbidity status.
Sl. No. Characteristics
Total (n=158)
Comorbidity present (n=137)
Comorbidity absent
(n=21) Chi square
test
N % N % N %
1
HbA1C levels
χ2=59.45
p<0.0001 Excellent (4.5-6.4) 13 8.2 2 1.5 11 52.4
Good (6.5-7.0) 57 36.1 52 37.9 5 23.8
Acceptable (7.1-8.0) 69 43.6 65 47.4 4 19.0
Poor (>8.0) 19 12.1 18 13.2 1 4.8
2
Age in yrs
χ2=1.756
p=0.624
30-40 58 36.7 49 35.7 9 42.8
41-50 36 22.8 31 22.6 5 23.8
51-60 42 26.6 36 26.3 6 28.6
>60 22 13.9 21 15.4 1 4.8
3
Gender
χ2=3.0127
p=0.082
Male 63 39.9 51 37.2 12 57.1
Female 95 60.1 86 62.8 9 42.9
4
Marital status
χ2=2.397
p=0.3016
Married 142 89.9 124 90.5 18 85.7
Unmarried 2 1.3 1 0.7 1 4.8
Widow/widower 14 8.9 12 8.8 2 9.5
5
Religion
χ2
=0.225 p=0.635
Hindu 105 66.5 92 67.1 13 61.9
Muslim 53 33.5 45 32.9 8 38.1
6
Socio economic status
χ2
=2.585 p=0.629
Class I 2 1.3 1 0.7 1 4.8
Class II 17 10.8 15 10.9 2 9.5
Class III 35 22.2 31 22.6 4 19.0
Class IV 56 35.4 49 35.7 7 33.3
Class V 48 30.4 41 29.9 7 33.3
7
Family h/o diabetes
χ2=0.0132
p=0.905
Yes 14 8.8 12 8.7 2 9.5
No 144 91.2 125 91.3 19 90.5
8
BMI
χ2=26.77
p<0.0001
Underweight 11 6.9 4 2.9 7 33.3
Normal 28 17.7 24 17.5 4 19.0
Overweight 89 56.4 82 59.8 7 33.3
obese 30 19.0 27 19.7 3 14.3
Table showing effect of socio demographic characteristics over the presence of co-morbidities revealed that only BMI and HbA1c levels had statistical significant effect over presence of co-morbidities, while
Figure 1: Distribution of comorbidities among known type 2 diabetic patients.
DISCUSSION
Our study highlights the widespread co-existence of chronic medical conditions or “co morbidities” along with presence type 2 diabetes mellitus in the study population. 86.7% of the patients either had one or more co-morbidities along with type 2 diabetes mellitus in our study. This finding is similar to the findings from the study conducted in Bhubaneswar which reported presence of co-morbidities in 84% of type 2 diabetics.8 The co-morbidities assessed were both either directly related to diabetes like neurapathy, renal disease (nephropathy), visual impairment (retinopathy), heart disease (cardiovascular disease) and hypo/hyperglycemia; or not directly related to diabetes mellitus like obesity, hypertension, depression and urinary tract infection. This was an open ended, multiple answer question and after assessing the reply from the participants, these chronic co-morbid conditions were selected. The most frequent co morbid chronic conditions were hypertension, obesity, hypo/hyperglycemia, urinary tract infection and depression. The prevalence of co morbid conditions was higher among males than females, whereas the number of co morbid conditions was higher among females than males. The number of co morbidities was highest in the age group 30-40 yrs. This finding is different from the similar study done by Pati et al where the number of co morbidities was highest in the age group >60 yrs and increased age was found to be a strong predictor for diabetes co morbidity.8 Where as in our study HbA1c level >7.0 and BMI was found to be strong indicator of co-morbidities among diabetic patients with 60.6% of the participants with HbA1c levels >7.0 had co-morbidities and 79.5% of the participants with overweight and obesity had presence of co-morbidities.
Obesity in our study was found to be most common co morbid condition with 55.9% of the participants suffering from it, another study done by Akholkar et al also reported high prevalence of obesity of 71% among diabetic patients.12 This finding propose that incidence of obesity is on momentum and it may be independent of
diabetic status, although data do suggest tendency of diabetics towards obesity.12 But small set of population in our study was major drawback.
We found the prevalence of hypertension among diabetics was as high as 47.2%, which was similar in studies done by Yadav et al, Patel et al and Pati et al.8,13,14 Hence our study findings are in line with prior studies that found a strong association between diabetes and hypertension. Depression among diabetics was found to be 18.8% in our study, which is much low compared to other study done by Das et al.15
Limitations
There are several limitations to this study. Our study population consisted only of diagnosed type 2 diabetics, the absence of undiagnosed diabetics is a limitation, as diabetes is an ice berg disease almost half of the diabetes cases remain undiagnosed till there is manifestation of some complication. Prevalence rates of co morbidity among the undiagnosed diabetes patients will therefore be lower. Secondly, self-reported co morbidity status can be subjected to self-declaration bias.
CONCLUSION
The presence of these co morbidities poses an extra burden on the health care system as well as on the deteriorating health of the diabetic patients as they can lead to various life-threatening complications. This results in extra out of pocket expenditure on the patients. Hence, comorbidities should be taken care of, as and when they develop and their treatment should not be delayed.
Funding: No funding sources Conflict of interest: None declared
Ethical approval: The study was approved by the Institutional Ethics Committee
REFERENCES
1. Ahmed AM. History of diabetes mellitus. Saudi Med J. 2002;23(4):373-8.
2. Patlak M. New weapons to combat an ancient disease: treating diabetes. FASEB J. 2002;16(14):1853.
3. Genetic basis of type 1 and type 2 diabetes, obesity, and their complications. Advances and emerging opportunities in diabetes research: a Strategic Planning report of the DMICC. Available at: www2.niddk.nih.gov/NR. Accessed on 22 December 2011.
4. Azevedo M, Alla S. Diabetes in sub-saharan Africa: kenya, mali, mozambique, Nigeria, South Africa and zambia. Int J Diabetes Dev Ctries. 2008;28(4):101-8.
5. GeilNijpels. Epidemiology of type 2 diabetes Type 2 diabetes mellitus ¬Diapedia, The Living Textbook
49.7 4.4
1.9 12.6
47.2 20.1
18.8
55.9 3.7
13.2
0 20 40 60
Hypoglycemia/Hyperglycemia Visual problems Renal disease Neuropathy Hypertension Urinary tract infection Depression Obesity Heart disease Nil
of Diabetes. Diapedia. 1-4. Available at: https://www.diapedia.org/type-2-diabetes-mellitus/ 3104287123/epidemiology-of-type-2-diabetes. Accessed on 25 June 2017.
6. International Diabetes Federation. IDF Diabetes Atlas, seventh edition 2015. Available at: http://www.idf.org/idf-diabetes-atlas-seventh-edition (2015). Accessed on 25 June 2016.
7. Kaveeshwar SA, Cornwall J. The current state of diabetes mellitus in India. AMJ. 2014:7(1):45-8. 8. Pati S, Schellevis FG. Prevalence and pattern of co
morbidity among type2 diabetics attending urban primary healthcare centers at Bhubaneswar (India). PLoS One. 2017;12(8):e0181661.
9. Kerr EA, Heisler M, Krein SL, Kabeto M, Langa KM, Weir D, et al. Beyond comorbidity counts: how do comorbidity type and severity influence diabetes patients’ treatment priorities and self-management? J General Internal Med. 2007;22:1635–40.
10. Tinetti ME, Bogardus ST Jr, Agostini JV. Potential pitfalls of disease-specific guidelines for patients with multiple conditions. N Engl J Med 2004;351:2870–4.
11. Somappa HK, Venkatesh M, Prasad R. Quality of life assessment among type 2 diabetic patients in rural tertiary center. Int J Med Sci Public Health. 2014;3(4):415-7.
12. Akholkar PJ, Gandhi AA. Prevalence of obesity in diabetic and non-diabetic population. Int J Res Med Sci. 2015;3(8):2114-7.
13. Yadav D, Mishra M, Tiwari A, Bisen PS, Goswamy HM, Prasad GB. Prevalence of dyslipidemia and hypertension in Indian type 2 diabetic patients with metabolic syndrome and its clinical significance. Osong Public Health Res Perspectives. 2014;5:169– 75.
14. Patel M, Patel IM, Patel YM, Shah P, Rathi SK. Profile of the subjects with Diabetes: A hospital-based observational study from Ahmedabad, Western India. Electronic Physician. 2011: 3. 15. Das R, Singh O, Thakurta RG, Khandakar MR, Ali
SN, Mallick AK, et al. Prevalence of depression in patients with type ii diabetes mellitus and its impact on quality of life. Indian J Psychol Med. 2013;35:284-9.