Original Research Article
Prevalence and pattern of risk factors for non-communicable diseases in
urban population of Jaipur, Rajasthan
Chhabil Kumar
1, Priyanka Dobhal
2*, Amita Kashyap
3INTRODUCTION
Increase in life expectancy with growing economy, globalization, rapid industrialization and urbanization, is transforming lifestyle in India in an unhealthy way. Behaviours like tobacco use, harmful use of alcohol, physical inactivity and unhealthy diet, becoming more and more prevalent leading to overweight, obesity, raised
blood pressure, raised blood glucose and dyslipidaemia- all important biological risk factors for NCDs.1
Globally NCDs are rising and projected to account for 60% of disease burden and 73% of death by 2020. Majority (80%) of these deaths occur in low and middle income countries.2,3 At the present stage of India‟s health transition, chronic diseases contribute to an estimated 53% of deaths and 44% of disability adjusted life years
ABSTRACT
Background: Majority of the risk factors for NCDs are measurable and modifiable thus continuous surveillance of the levels and pattern of these risk factors is of fundamental importance. Taking cognizance of Jaipur city rapidly adopting to metropolitan culture; this study may mark an important milestone in surveillance activities and setting preventive priorities for NCDs in the state of Rajasthan. Aim of the study is to measure prevalence and associated variables of major risk factors for NCDs in the age group of 25-64 years.
Methods: It is a cross sectional, descriptive study, conducted on 1454 person aged 25 to 64 years, residing in Jaipur city, from 1st June 2012 to 31st December 2013, using two steps of „standard WHO STEPS structured instrument‟. Categorical data were expressed in form of percentage. Chi-square test was used to analyse difference in proportions. Continuous data were summarized in form of mean and SD. The differences in means were analysed by student‟s t test.
Results: At least one risk factor was present in all persons moreover 35% had multiple risk factors. Multiple risk factors were present even in 20% of relatively young adults (25-34 years). Tobacco and alcohol consumption was seen in 28% and 29% respectively. Standard of living index was associated with obesity, hypertension and low physical activity but not with alcohol use, smoking and daily consumption of fruit & vegetable. Male consumed more alcohol, indulged in less physical activity and smoked more than twelve times than females.
Conclusions: Educating younger population for healthy lifestyle adoption and focused educational intervention with strict enforcement of existing laws will be helpful in controlling this epidemic of NCD.
Keywords: Risk factor, Non-communicable disease, Urban, Jaipur, Smoking, Alcohol, Hypertension, Overweight
1
Department of Medical and Health Chief Medical and Health Office, Alwar, Rajasthan, India
Department of Community Medicine, 2Government Doon Medical College, Dehradun, Uttarakhand, 3SMS Medical College, Jaipur, Rajasthan, India
Received: 02 May 2019
Accepted: 13 June 2019
*Correspondence:
Dr. Priyanka Dobhal,
E-mail: [email protected]
Copyright: © the author(s), publisher and licensee Medip Academy. This is an open-access article distributed under the terms of the Creative Commons Attribution Non-Commercial License, which permits unrestricted non-commercial use, distribution, and reproduction in any medium, provided the original work is properly cited.
lost, many of these deaths occur at relatively early age causing projected economic loss to be USD 237 billion in 2006-15.4,5
These risk factors being measurable and largely modifiable allows continuous surveillance of the levels and pattern of the risk factors which is fundamental in planning and evaluating preventive activities for control of NCDs.6
Taking cognizance of Jaipur city rapidly adopting to metropolitan culture; this study may mark an important milestone in surveillance activities and setting preventive priorities for NCDs in the Jaipur city and the state of Rajasthan, and may stimulate further analysis and research in the area. Objectives is to measure prevalence of major risk factors for NCDs in the age group of 25-64 years in both the sexes in people of Jaipur city, Rajasthan and to find out the association of socio-demographic characteristics with risk factors.
METHODS
This cross sectional; descriptive type of study was conducted from 1st June 2012 to 31st December 2013 of Jaipur city in area covered under Municipal Corporation. The age group included was 25 to 64 years.
As per the WHO-STEP wise methodology, sample size was calculated using “n=Z2×p(1-P)/e2” equation. Sample size was calculated at 95% confidence interval, taking maximum variance (50%) for prevalence of risk factors and 10% absolute margin of error. Final Sample size was 1454 after adjusting the design effect, no. of age-sex groups (4 age groups×2 sex), and 20% non-response. Fifty census enumerating blocks were selected. At first step, two out of eight zones of Jaipur city were selected by simple random sampling (SRS), then five wards from each zone followed by five census enumeration blocks (CEBs) per ward. Twenty nine eligible subjects were selected from each CEB. One individual per household in the age group 25-54 years was selected through „KISH‟ method.7 Non respondent house was replaced by just next house and rest serial of houses remained same. Informed written consent was obtained from all the respondents.
Age, sex, education, house hold amenities, smoking, alcohol consumption, physical activities, consumption of fruits and vegetables, and history of diabetes and hypertension were taken as study variable. Six major risk factors i.e., obesity/overweight, low physical activity, low consumption of fruits and vegetables, hypertension, smoking and alcohol consumption were studied. The study used standard definitions used in IDSP survey of NCD risk factors.8 The NFHS standard of living index was used to know socio economic status of study respondents. The standard WHO STEPS structured instrument for assessing risk factors of NCDs was used; it was suitably modified by IDSP for Indian context. It is a semi-open ended interview based tool to be administered
to one person at a time. Omron BP instrument, measuring tape, stethoscope, weighing machine, and height measuring tape were used. Categorical data were expressed in form of percentage. Chi-square test was used to analyse difference in proportions. Continuous data were summarized in form of mean and SD. The differences in means were analysed by student‟s t test.
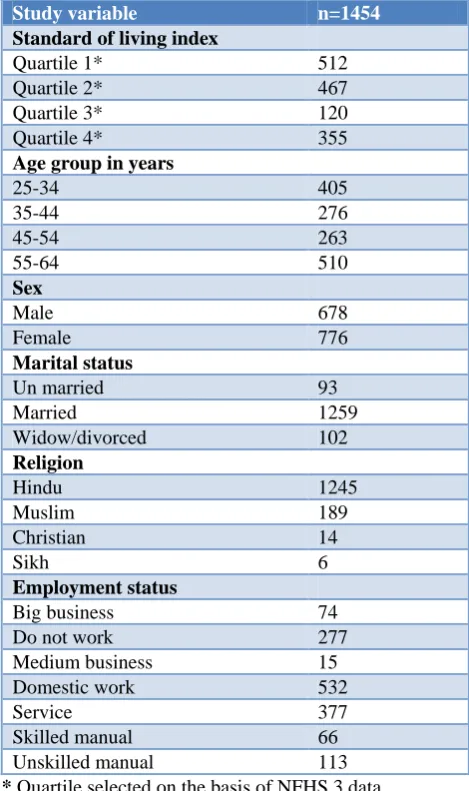
Table 1: Demographic characteristics of study population.
Study variable n=1454
Standard of living index
Quartile 1* 512
Quartile 2* 467
Quartile 3* 120
Quartile 4* 355
Age group in years
25-34 405
35-44 276
45-54 263
55-64 510
Sex
Male 678
Female 776
Marital status
Un married 93
Married 1259
Widow/divorced 102
Religion
Hindu 1245
Muslim 189
Christian 14
Sikh 6
Employment status
Big business 74
Do not work 277
Medium business 15
Domestic work 532
Service 377
Skilled manual 66
Unskilled manual 113
* Quartile selected on the basis of NFHS 3 data.
RESULTS
unemployed. Sixty eight percent women were house wife (Table 1). All respondents had at least one or other Risk Factor, 35% had ≥3 Risk Factors. Proportion of ≥3 risk factors increased with age and was more in males (Table 2 and 3). Very few (<1%) consumes recommended ≥5 servings of fruits/vegetables per day. Approximately 20% people in age group 25 to 34 had ≥3 risk factors. Proportion of people smoking &/ or consuming tobacco was 28%. Every third male participants had harmful use of alcohol. Half had BMI ≥25 Kg/m2
and 8% had low
physical activity. Self-reported diabetes and hypertension was 9% and 39% respectively. Standard of living index was significantly associated with obesity, hypertension and low Physical Activity but not with alcohol use, smoking and consumption of fruit and vegetable. Age had no role in low level of physical activity, or harmful alcohol use or consumption of fruit and vegetable but obesity/overweight, smoking and hypertension increased with age.
Table 2: Association of demographic characteristic and risk factors in the study population. Standard of living
index profile n=1454
Obesity/ overweight n=707 (%)
Hypertension n=571 (%)
Low physical activity n=97 (%)
5 Fruits and vegetable n=1451 (%)
Smoking n=216 (%)
Alcohol n=178 (%)
Quartile 1* (512) 202 (39.45) 160 (31.25) 15 (2.93) 509 (99.41) 76 (14.84) 65 (12.70)
Quartile 2* (467) 206 (44.11) 183 (39.19) 39 (8.35) 467 (100.00) 76 (16.27) 51 (10.92)
Quartile 3* (120) 77 (64.17) 55 (45.83) 14 (11.67) 120 (100.00) 17 (14.17) 14 (11.67)
Quartile 4* (355) 222 (62.54) 173 (48.73) 29 (8.17) 355 (100.00) 47 (13.24) 48 (13.52)
² value 60.150 29.30 19.717 5.531 1.521 1.434
P value 0.000 0.000 0.000 0.181 0.927 0.955
Age in years
25-34 (405) 120 (29.63) 45 (11.11) 27 (6.67) 402 (99.26) 25 (6.17) 56 (13.83)
35-44 (276) 138 ( 50.00) 71 (25.72) 17 (6.16) 276 (100.00) 31 (11.23) 39 (14.13)
45-54 (263) 161 (61.22) 132 (50.19) 12 (4.56) 263 (100.00) 59 (22.43) 30 (11.41)
55-64 (510) 288 (56.47) 323 (63.33) 41 (8.04) 510 (100.00) 101 (19.80) 53 (10.39)
² value 87.965 292.864 3.527 7.786 48.817 3.659
P value 0.000 0.000 0.428 0.066 0.000 0.406
Sex
Male (678) 306 (45.13) 265 (39.09) 82 (12.09) 677 (99.85) 192 (28.32) 174 (25.66)
Female (776) 401 (51.68) 306 (39.43) 15 (1.93) 774 (99.74) 24 (3.09) 4 (0.52)
² value 5.94 0.01 58.38 0.14 180.05 210.68
P value 0.015 0.935 0.00 0.937 0.00
OR 12.574 0.00
* Quartile selected on the basis of NFHS 3 data.
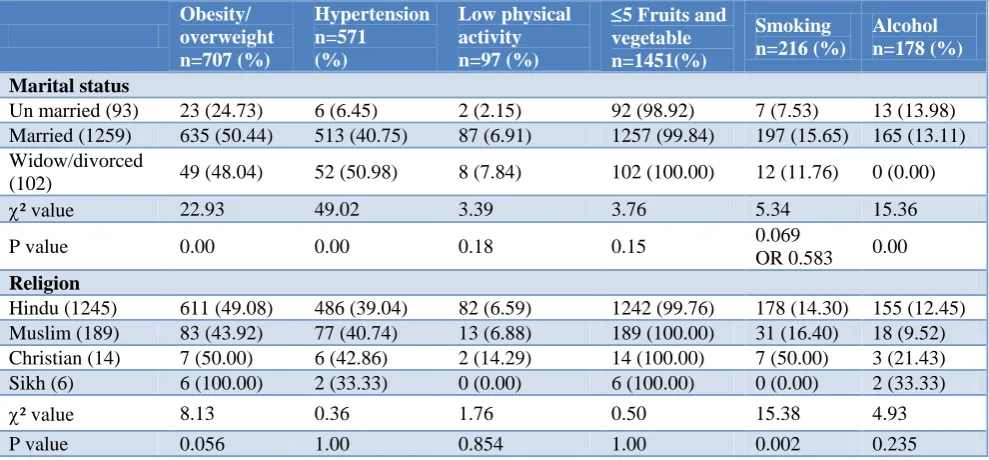
Table 3: Association of demographic characteristic and risk factors in the study population. Obesity/
overweight n=707 (%)
Hypertension n=571 (%)
Low physical activity n=97 (%)
5 Fruits and vegetable n=1451(%)
Smoking n=216 (%)
Alcohol n=178 (%)
Marital status
Un married (93) 23 (24.73) 6 (6.45) 2 (2.15) 92 (98.92) 7 (7.53) 13 (13.98)
Married (1259) 635 (50.44) 513 (40.75) 87 (6.91) 1257 (99.84) 197 (15.65) 165 (13.11)
Widow/divorced
(102) 49 (48.04) 52 (50.98) 8 (7.84) 102 (100.00) 12 (11.76) 0 (0.00)
² value 22.93 49.02 3.39 3.76 5.34 15.36
P value 0.00 0.00 0.18 0.15 0.069
OR 0.583 0.00
Religion
Hindu (1245) 611 (49.08) 486 (39.04) 82 (6.59) 1242 (99.76) 178 (14.30) 155 (12.45)
Muslim (189) 83 (43.92) 77 (40.74) 13 (6.88) 189 (100.00) 31 (16.40) 18 (9.52)
Christian (14) 7 (50.00) 6 (42.86) 2 (14.29) 14 (100.00) 7 (50.00) 3 (21.43)
Sikh (6) 6 (100.00) 2 (33.33) 0 (0.00) 6 (100.00) 0 (0.00) 2 (33.33)
² value 8.13 0.36 1.76 0.50 15.38 4.93
P value 0.056 1.00 0.854 1.00 0.002 0.235
Obesity/ overweight n=707 (%)
Hypertension n=571 (%)
Low physical activity n=97 (%)
5 Fruits and vegetable n=1451(%)
Smoking n=216 (%)
Alcohol n=178 (%)
Employment status
Big business (74) 43 (58.11) 28 (37.84) 23 (31.08) 74 (100.00) 21 (28.38) 22 (29.73)
Do not work
(277) 141 (50.90) 151 (54.51) 23 (8.30) 277 (100.00) 43 (15.52) 36 (13.00)
Medium business
(15) 6 (40.00) 8 (53.33) 0 (0.00) 15 (100.00) 7 (46.67) 6 (40.00)
Domestic work
(532) 269 (50.56) 187 (35.15) 2 (0.38) 530 (99.62) 7 (1.32) 2 (0.38)
Service (377) 204 (54.11) 146 (38.73) 40 (10.61) 376 (99.73) 86 (22.81) 82 (21.75)
Skilled manual
(66) 23 (34.85) 21 (31.82) 5 (7.58) 66 (100.00) 24 (36.36) 17 (25.76)
Unskilled manual
(113) 21 (18.58) 30 (26.55) 4 (3.54) 113 (100.00) 28 (24.78) 13 (11.50)
² value 54.86 41.33 118.19 1.93 151.70 144.70
P value 0.00 0.00 0.00 0.93 0.00 0.00
* Quartile selected on the basis of NFHS 3 data.
Male consumed more alcohol, indulged in less physical activity and smoked more than twelve times than females who were significantly more obese/ overweight than males. Married people were significantly more obese/ overweight and hypertensive, no significant association was found with other risk factors. All risk factors except consumption of fruits and vegetables were significantly associated with employment status of the person.
DISCUSSION
Response rate in the present study was 93.7% which was lower than Andhra Pradesh (98.1%) and Madhya Pradesh (99.9%) and higher than Kerala (88.8%) reported during IDSP survey (2007-08).8 The religion and SES profile of study participants was comparable to NFHS III data.9 Literacy rate (81.7%) was comparable to census 2011 data (75.51%) for Jaipur.10
The prevalence of smoking in the present study (16.51%) was comparable to that of NFHS 3 (18.4%), Rani et al (16%) and Nath et al (18.4%).11,12 Though Gupta et al have reported higher overall prevalence of smoking (32%) in urban population of Rajasthan, the difference may be accounted to the fact that the past and current smoking has been combined for reporting the smoking prevalence while we used only current smoking.13 Little lower prevalence was reported by Gupta but they had also included younger age (15-25) group and prevalence of smoking in younger age group was comparatively lower.13-15
This study observed a significant association of smoking status with sex, age and religion but not with SES. These result were supported by observations of Subramanian et al and Narayan et al.16,17 Overall prevalence of current alcohol use was 13.96% in the present study, similar prevalence was reported by NFHS 3 (13.4%), and Girish et al (13%), the current alcohol use increased about 40%
from NFHS 2 to NFHS 3 in a decade.18 This may be due
to the fact that pattern of drinking in India has undergone a change from occasional use to being a social event. Today, the common purpose of consuming alcohol is to get drunken.19
Gupta et al reported a prevalence of 15% in male in an urban study in Rajasthan which was about half of the present study (29.06%).20 This may be due to difference in definition of current drinker used by them. Alcohol use was not significantly associated with age group, marital status and religion, and these result were supported by Singh et al and Gupta et al.21,22 Similar to results of previous studies in different part of the country.8,12,23,24 Alcohol use was significantly associated with type of occupation and sex in present study also. The prevalence of low physical activity in the present study was 8.05% (12.09% in male and 4.12 % in females); which was lower than Anand et al.25
2007-08.8 The prevalence of obesity/overweight
(BMI≥25 kg/m2
) in the present study was found to be 48% comparable to Deepa et al in urban populations of Chennai (45%).27 Gupta et al reported lower prevalence (17%) than present study because they considered obesity as BMI≥27 kg/m2.28 Same author reported higher obesity (57%) in Jaipur city in 2007 considering BMI≥25 kg/m2.28 About 39% had high blood pressure (SBP≥140 and/or DBP≥90 mmHg) comparable to Gupta et al observation of 34% in middle class adults of Jaipur in 2012.12,13,28 Prevalence of self-reported diabetes was 9% in the present study. Gupta et al in urban population of Jaipur reported higher (12%) prevalence of diabetes as they relied on positive history as well as on fasting glucose of ≥126 mg/dl rather than history alone.28
Same author finds the overall prevalence to be 8.6% in western India.29 At the state level prevalence of self-reported diabetes was for Rajasthan was 0.3% that was much lower than present study.30 It was considered important to assess the burden of risk factors in the community. Risk factor ≥3 was present in 47% of participants, which was higher than reported by Syed Masud Ahmed et al in their study in Vadu (India).31
CONCLUSION
There is high burden of risk factors of NCDs among the resident of Jaipur city; no respondents had „0‟ risk factor. About 65% respondent had 1-2 risk factors and 35% had three or more of risk factors. Tobacco users were more in low standard living of index while alcohol consumption was more in high socioeconomic strata more so in males. Obesity, hypertension and sedentary lifestyle was more prevalent in high standard of living index indicating younger people of higher socioeconomic strata were at highest risk of developing NCDs. Approximately 20% relatively young people (25 to 34years) had ≥3 Risk Factors is a pointer to the fact that the burden of NCDs is going to increase in near future. Therefore it is important to recommend effective and sound measures for prevention and control of risk factors in the given community.
Recommendations
a) Educate younger population in school-colleges, young parents for healthy lifestyle adoption. b) Media glorification of alcohol and tobacco consumption, fast food can be nullified through mass awareness generating camps, focused educational intervention at institutional level and personal communication through counselling and behaviour therapy. c) Strict enforcement of existing laws (e.g., COPTA) is required. The government should impose a comprehensive ban on all forms of promotion including advertising and sponsorship of tobacco products.
Funding: No funding sources Conflict of interest: None declared
Ethical approval: The study was approved by the Institutional Ethics Committee
REFERENCES
1. Li Y, Wang L, Jiang Y, Zhang M, Wang L. Risk factors for non-communicable chronic diseases in women in China: surveillance efforts, Bull World Health Organ. 2013;91(9):650–60.
2. World health organization - Global strategy on Diet,
Physical activity. www.who.int/
strategy_english_web.pd.
3. Strong K, Mathers C, Leeder S, Beaglehole R.
Preventing chronic diseases: How many lives can we save? Lancet. 2005;366:1578-82.
4. Reddy KS, Shah B, Varghese C, Ramadoss A.
Responding to the threat of chronic diseases in India. Lancet. 2005;366:1744-49.
5. Upadhyay RP. An overview of the burden of non-communicable diseases in India. Iranian J Publ Health. 2012;41(3):1-8.
6. Epping-Jordan JE, Galea G, Tukuitonga C,
Beaglehole R. Preventing chronic diseases: taking stepwise action. Lancet. 2005;366:1667-71.
7. The WHO STEPS wise approach, surveillance of
risk factors for non-communicable disease,
Framework (draft) 2002; WHO, Geneva.
8. Integrated Disease Surveillance Project (IDSP).
Non-Communicable Disease Risk Factors Survey, 2007-2008.
9. Gupta R, Gupta KD. Coronary heart disease in low
socioeconomic status subjects in India: “An Evolving Epidemic". Indian Heart J. 2009;61:358-67.
10. Indian institute of population sciences and macro international, 2007.
11. Rani M, Bonu S, Jha P, Nguyen SN, Jamjoum L. Tobacco use in India: Prevalence and predictors of smoking and chewing in a national cross sectional household survey. Tob Control. 2003;12:e4. 12. Nath A, Garg S, Deb S, Ray A, Kaur R. Profile of
behavioural risk factors of non-communicable diseases in an urban setting in New Delhi. Indian J Public Health. 2009;53(1):28-30.
13. Gupta R, Prakash H, Majumdar S, Sharma S, Gupta
VP. Prevalence of coronary heart disease and coronary risk factors in an urban population of Rajasthan. Indian Heart J. 1995;47(4):331-8.
14. Gupta R, Sharma KK, Gupta A, Agrawal A, Mohan
I, Gupta VP, et al. Persistent high prevalence of cardiovascular risk factors in the urban middle class in India: Jaipur Heart Watch-5. J Assoc Physicians India. 2012;60:11-6.
15. Gupta R, Gupta VP, Prakash H, Sarna M, Sharma AK. Hindu-Muslim differences in the prevalence of coronary heart disease and risk factors. J Indian Med Assoc. 2002;100(4):227-30.
16. Subramaniam SV, Nandy S, Kelly M, Gordon D,
17. Narayanan KMV, Chadha SL, Hanson RL, Tandon R, Sekhawat S, Fernandes RJ, et al. Prevelence and patteren of smoking in delhi: cross sectional study. BMJ. 1996;312:1576-9.
18. Girish N, Kavita R, Gururaj G, Benegal V. Alcohol
use and implications for public health: patterns of use in four communities. Indian J Community Med. 2010;35(2):238–44.
19. Mohan D, Chopra A, Ray R, Sethi H. Alcohol
consumption in India: a cross sectional study. In: Room R, Demers A, Bourgault C (eds). Surveys of
Drinking Patterns and Problems in Seven
Developing Countries. Geneva: World Health Organization; 2001: 103-114.
20. Gupta R. Lifestyle risk factors and coronary heart disease prevalence in Indian men. J Assoc Physicians India. 1996;44(10):689-93.
21. Singh J, Mohan V, Padda AS. A comparative study
of prevalence of regular alcohol users among the male individuals in an urban and rural were of district Amritsar, Punjab. Indian J Community Med. 2000;25:73–8.
22. Gupta PC, Saxena S, Pednekar MS, Maulik PK.
Alcohol consumption among middle aged and elderly men: a community based study from western India. Alcohol Alcohol. 2003;38(4):327-31.
23. Chadha SL, Gopinath N, Sekhawat S. Urban rural difference in the prevalence of coronary heart disease and risk factors in Delhi. WHO bulletin. 1997;75:31-8.
24. Gupta R, Sharma S, Gupta VP, Gupta KD. Smoking
and alcohol intake in a rural Indian population and correlation with hypertension and coronary heart disease prevalence. J Assoc physicians India. 1995;43(4):253-8
25. Anand K, Shah B, Gupta V, Khaparde K, Pau E, Menon GR, et al. Risk factors for non-communicable disease in urban Haryana: a study
using the STEPS approach. Indian Heart J. 2008;60(1):9-18.
26. Sugathan TN, Soman CR, Sankaranarayanan K.
Behavioural risk factors for non-communicable diseases among adults in Kerala, India. Indian J Med Res. 2008;127:555-63.
27. Deepa M, Farooq S, Deepa R, Manjula D, Mohan
V. Prevalence and significance of generalized and central body obesity in an urban Asian Indian population in Chennai, India (CURES: 47). Eur J Clin Nutr. 2009;63(2):259–67.
28. Gupta R, Gupta VP, Sarna M, Bhatnagar S, Thanvi
J, Sharma V, et al. Prevalence of coronary heart disease and risk factors in an urban Indian population: Jaipur Heart Watch-2. Indian Heart J. 2002;54:59-66.
29. Gupta A, Gupta R, Sarna M, Rastogi S, Gupta VP,
Kothari K. Prevalence of diabetes, impaired fasting glucose and insulin resistance syndrome in an urban Indian population. Diabetes Res Clin Pract. 2003;61(1):69–76.
30. Corsi DJ, Subramanian SV. Association between
socioeconomic status and self-reported diabetes in India: a cross-sectional multilevel analysis. BMJ Open. 2012;2(4):e000895.
31. Ahmed SM, Hadi A, Razzaque A, Ashraf A,
Juvekar S, Ng N, et al. Clustering of chronic non- communicable disease risk factors among selected Asian populations: levels and determinants. Glob Health Action. 2009;2:10.
Cite this article as: Kumar C, Dobhal P, Kashyap A. Prevalence and pattern of risk factors for