Classification of Students in a Web based Learning
Environment
Mohit Shroff
Dept. of Computer Engineering, VESIT, Mumbai. India.
Prashant Kanade
Asst. Professor, Dept. of Computer Engineering,VESIT, Mumbai. India.
Prashant Zaware
Dept. of Computer Engineering,VESIT, Mumbai. India.
ABSTRACT
Predicting academic performance and monitoring the progress of students in a web based learning environment is a critical issue. In this paper, K-means Clustering algorithm is implemented to predict student performance at the end of the semester. The results can be used to enhance the understanding of the course instructor to reform the syllabus, thereby increasing the chances of a higher score by lagging students. Higher education institutes offering distance learning courses through web can use this model to identify which area of their course can be improved by data mining technology to achieve higher student marks.
General Terms
Pattern Recognition, Data Mining, Algorithms.
Keywords
Web based learning, performance measures, k means.
1.
INTRODUCTION
The proliferation of use of data in many application areas such as banking, fraud detection, insurance and medicine is due to the result of powerful, affordable and sustainable database systems which can be easily scaled to collect and generate millions of datasets over a period of time.
Nowadays, a promising frontier of database applications [1] and analytics is Data Mining. Data Mining is the process of extracting useful knowledge and information including patterns, associations, clusters and anomalies from a great deal of data stored in data warehouses or other information repositories. The capability of data mining in predicting behavior [2] and thus to classify students in a web based learning environment is the crux of this paper.
In this paper, data mining techniques have been highlighted for classifying students [3] in a web based environment to predict the final scores of the students depending on previous academic history. The prediction will help the course instructor to enhance/ modify/ remodel their syllabus to improve the scores of the students in the final exams.
A clustering algorithm [4,7] has been used to customize the behavior for predicting student’s performance. One of the main goals in applying the clustering method was to group students in clusters with dissimilar behavior; the student within the same cluster embraces the closest behavior and the ones in different clusters have the most dissimilar behavior.
Five performance measures were devised which were unique to this model and normalized scores were obtained for each performance measure by assigning weightages to them.
2.
PERFORMANCE INDICATORS
The ideal course time for the course as prescribed by the instructor was 45 hours or 2700 minutes during the course of the semester.
Cluster analysis was used in our model to predict and identify patterns from the data warehouse. The data warehouse consists of 100 records i.e. 100 student’s data was used to extract definitive patterns.
The different entities and attributes of each entity are listed below:
Student (Sid, sex, age, disabled, birthplace, curr_city, total_time, courses_count)
Where, total_time indicates the time spent by the student in one particular course.
Assignments (sid, assgn_given, assgn_completed, total_time_allocated, total_time_taken)
Where, assgn_given indicates the total number of assignments which the student was expected to complete and assgn_completed is the number of assignments students actually managed to submit.
total_time_allocated is the based on the number of assignments the students submitted. Students were encouraged to utilize all the days allocated for completion of assignments. Each assignment was assigned to be completed over a period of three days and not to cram the work in a few hours. A penalty of 2 points was assigned to the student for every incomplete or late assignment.
Quiz (Sid, total_quizzes, quizzes_passed, time_allocated, time_taken)
Where, total_quizzes are the total number of quizzes which the student attempted. Every student had to attempt a total of 10 quizzes during the course of the semester. Each quiz had equal weightage.
Sem_marks (Sid, sem_marks)
Where, sem_marks indicates the final score obtained by the student in the previous semester.
Each of the five performance measures are described in detail below.
2.1
Course Time Spent
Tables 1 and 2 describe the student’s personal data and general course information:
Table 1. General Student Information
sid sex age (yrs) disabled(y/n) birthplace
S01 M 21 No Mumbai
S02 M 22 No Delhi
S03 M 19 No Nagpur
S04 F 18 No Mumbai
S05 M 21 No Bangalore
S06 M 21 No Delhi
S07 F 21 No Mumbai
S08 M 20 No Delhi
S09 M 23 Yes Mumbai
S10 M 22 No Nagpur
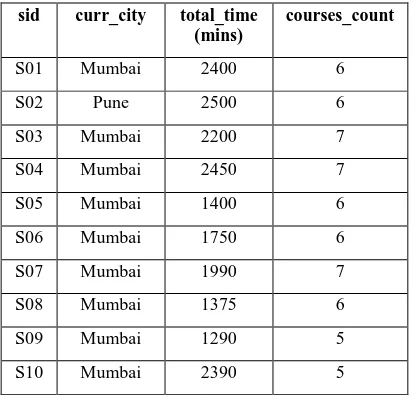
Table 2. General course information sid curr_city total_time
(mins)
courses_count
S01 Mumbai 2400 6
S02 Pune 2500 6
S03 Mumbai 2200 7
S04 Mumbai 2450 7
S05 Mumbai 1400 6
S06 Mumbai 1750 6
S07 Mumbai 1990 7
S08 Mumbai 1375 6
S09 Mumbai 1290 5
S10 Mumbai 2390 5
Following inference was drawn from the above set of data
Total amount of time required by the student to spend on the course, as suggested by the course instructor was 45 hours or 2700 minutes in the duration of the course.
The parameter course_time_spent was calculated as follows
The equation was normalized and graded for a maximum score of 10.
2.2
Assignment Score
Table 3 describes the student’s information based on number of assignments given and completed
Table 3. Information about Assignments sid assgn_
given
assgn_com pleted
total_time_all ocated
total_time_ taken
S01 4 3 9 7
S02 2 1 3 2
S03 4 4 12 12
S04 5 3 9 8
S05 3 2 6 6
S06 5 4 12 11
S07 5 5 15 14
S08 5 4 12 9
S09 4 3 9 9
S10 3 2 6 6
Every assignment was allocated 3 days for completion. This time was deemed as sufficient to complete the assignments as prescribed by the course instructor.
The total_time_allocated attribute was calculated on the basis of number of assignments successfully completed by the student rather than on the number of assignments assigned.
A penalty of 2 points was assigned to the student for every incomplete or late assignment.
The parameter assgn_score was calculated as follows:
The equation was normalized and graded for a maximum score of 10.
Students were encouraged to utilize all the days allocated for completion of assignments. Each assignment was assigned to be completed over a period of three days and not to cram the work in a few hours.
2.3
Assignment Time Taken
The parameter assgn_time_taken was calculated as follows:
2.4
Quiz Scores
Following table describes the student’s information based on number of quizzes attempted:
Table 4. Information about quizzes
Sid total_qui zzes
quizzes_ passed
time_allocated time_ taken
S01 10 2 120 120
S02 10 1 60 45
S03 10 8 480 300
S04 10 6 360 240
S05 10 5 300 270
S06 10 5 300 300
S07 10 7 420 410
S08 10 5 300 270
S09 10 4 240 190
S10 10 3 180 180
The parameter quiz_scores was calculated based on one of the following six conditions:
1. If number of quizzes passed is greater than 8 and total_quiz_time is less than 8, then a score of 10 is awarded.
2. If number of quizzes passed is greater than 8 and total_quiz_time is between 8 and 10, then a score of 8 is awarded.
3. If number of quizzes passed is between 6 and 8 and total_quiz_time is less than 8, then a score of 7 is awarded.
4. If number of quizzes passed is between 6 and 8 and total_quiz_time is between 8 and 10, then a score of 6 is awarded.
5. If number of quizzes passed is between 4 and 6, then a score of 5 is awarded.
6. If number of quizzes passed is less than 4, then a score of 4 is awarded.
This parameter was normalized and graded for a maximum score of 10.
2.5
Semester Marks
The last parameter was the total semester score (or aggregate) which was scored by the students in the previous semester at a beginner level course compared to the current course.
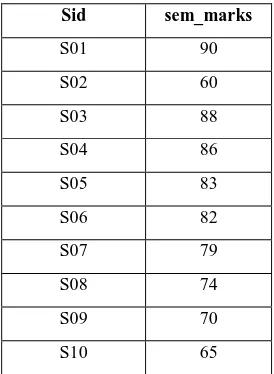
Table 5. Information about previous semester marks Sid sem_marks
S01 90
S02 60
S03 88
S04 86
S05 83
S06 82
S07 79
S08 74
S09 70
S10 65
The total score obtained by the student at the end of the course based on the above parameters was calculated as follows:
Thus the total score was graded out of 140. These scores out of 140 were normalized and calculated on a scale of 0-100 to convert them into percentages.
3.
METHODOLOGY
The k-means method [6,8] has been shown to be effective in producing good clustering results for many practical applications.
Following are the steps in K-means clustering algorithm:
Step 0: determine the number of clusters required to group the data in, as input value.
Step 1: Randomize K elements where K is the number of clusters
Step 2: Calculate arithmetic mean value of each cluster formed in the dataset
Step 3: The algorithm will now assign every new entry to the nearest cluster among a set of K clusters using Euclidean distance method.
Step 4: The algorithm now reassigns every entry into the nearest cluster and recalculates the arithmetic mean of all the clusters in the dataset.
Step 5: Go back to step 4 until all entries have been assigned to a particular cluster.
3.1
Clustering Student Data
for gifted learners. Clustering does not simply fill a classroom with a fraction of the student body representing all the highest performers in the grade.
Student clusters consist of groups of students who demonstrate similar learning curves throughout the whole course. These clusters are helpful to identify key activities that differentiate successful students from those who fail the course. We applied the Simple K-Means from Weka to the test dataset and found 4 students who were classified as outliers in the excellent category.
The methods for selecting children for cluster groups usually mirror those for other gifted and talented services. Within a cluster, several instructional options are typically used, including: enrichment and extensions, higher-order thinking skills, pretesting and differentiation, compacting, an accelerated pace, and more complexity in content.
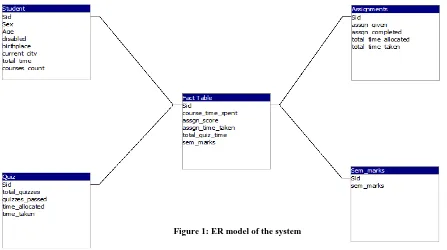
Figure 1 represents the Entity Relationship model of the system.
Figure 2 represents the state transition diagram of the system. The figure clearly describes the steps mentioned in the working of K means algorithm above.
f0 is the first step of the transition which is described in detail in the algorithm in section 3 above.
The algorithm continues until all the records are placed in a cluster and when each dataset is entered in a cluster, the mean values of the clusters change and the datasets are rearranged accordingly.
4.
RESULTS AND ANALYSIS
The K means algorithm was executed for 3,4 and 5 clusters and multiple iterations were performed for each cluster to eliminate outlier behavior. Even though the number of clusters was varied, the dataset wasn’t changed.
Table 6 represents the performance of the students when the cluster size was 3. Ten iterations were performed and the results are displayed as a graph in Figure 3. It was observed that the aggregate performance of students in cluster 1 was 41 out of 100. Also, 9 students failed to score above the passing percentage i.e. 40 out of 100. As expected, almost half the number of students were in the average category.
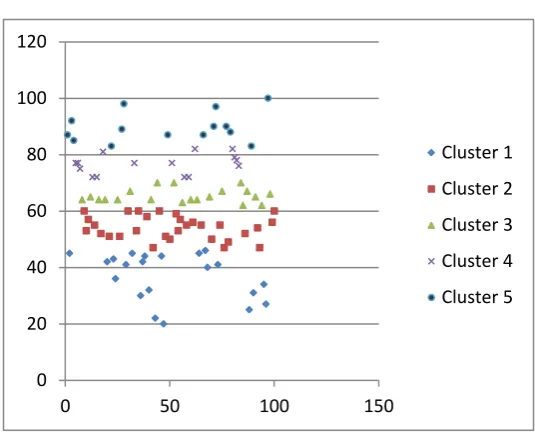
Table 7 represents the performance of students when the cluster size is 5.
Cluster # Cluster size Mean value
Aggregate Performance
1 32 50 41
2 43 65 62
3 25 80 85
Figure 1: ER model of the system
Figure 2, State transition diagram
0 20 40 60 80 100 120
0 20 40 60 80 100 120
M
a
r
k
s
Student ID
Cluster 1
Cluster 2
Cluster 3
0 20 40 60 80 100 120
0 50 100 150
Cluster 1
Cluster 2
Cluster 3
Cluster 4
Cluster 5
0 20 40 60 80 100 120
0 50 100 150
Cluster 1
Cluster 2
Cluster 3
Cluster 4
Table 7, Performance in K=5
Figure 4, Marks v/s Students when K=5
Table 8, Performance when K=4
Cluster #
Cluster size Mean Value Performance
1 27 45 38
2 24 55 54
3 20 65 66
4 29 75 85
Figure 4 represents the graphical information of table 7. As we can see from the graph, Cluster 1 is placed at the bottom of the graph in light blue circles. Cluster is distinctly seen as red squares and indicates the 2nd lowest scores of students in that cluster. Cluster 2 and 3 consist of average performers in the dataset. Cluster 3 is denoted by green triangles. Cluster 4 and 5 represent students who can be considered as “High Performers”. They are represented by purple crosses and dark blue circles respectively.
Figure 5, Marks v/s Students graph when K=4
Table 8 indicates the performance of students when K=4 i.e. when number of clusters are 4. The last column of each table highlights the average score of each student in that cluster while the Mean Value column highlights the value of K in that cluster.
The data in table 8 is explained graphically in figure 5. As mentioned before, Cluster 1 is occupied by students considered as “Below Average” for this course and are represented in blue circles. Cluster 2 and 3 consist of average students. Cluster 2 is represented in red squares and Cluster 3 in green triangles. Cluster 4 is made up of “High Performers” and is indicated by purple circles.
Cluster # Cluster size Mean Value Performance
1 27 45 37
2 24 55 54
3 20 65 65
4 12 75 77
5 17 85 90
5.
CONCLUSION
This paper has been an effort in providing the motivation toward advancing the traditional educational process via data mining technology. We demonstrated our technique using K means algorithm and combined with a deterministic model, which was used on a dataset of 100 students and produced the numerical interpretation of performance evaluation. The clustering technique displayed above can serve as a good benchmark to monitor the progress of students and evaluate their progression in future semesters.
6.
REFERENCES
[1] Cristóbal Romero, Sebastián Ventura, Pedro G. Espejo and César Hervás, Computer Science Department, Córdoba University, Spain “Data Mining Algorithms to Classify Students”. 1st International Conference on
Educational Data Mining, Montréal, Québec, Canada, June 20-21, 2008.
[2] Naeimeh D., Mohammad S. “A New Model for Using Data Mining Technology in Higher Educational Systems” Faculty of Information Technology, Multimedia University (MMU), Cyberjaya, Malaysia. 2004 IEEE.
[3] Naeimeh D., Somnuk P. ” Data Mining Application in Higher Learning Institutions” Faculty of Information
Technology, Multimedia University Jalan Multimedia, 63100 Cyberjaya, Selangor, Malaysia. Informatics in Education International Journal 7, No. 1 (2008). [4] Muslihah W., Yuhanim Y., Norshahriah W., Mohd R.,
Nor F., Hoo Y., Department of Computer Science, Faculty of Science and Defence Technology, National Defence University of Malaysia, Malaysia. “Predicting NDUM Student’s Academic Performance Using Data Mining Techniques”. 2009 Second International Conference on Computer and Electrical Engineering.
[5] “Predicting student performance: An Application of Data Mining methods with an Educational Web based system” 33rd ASEEIIEEE Frontiers in Education Conference, November 2008.
[6] Alsabti, Khaled; Ranka, Sanjay; and Singh, Vineet, "An efficient k-means clustering algorithm" (1997). Electrical Engineering and Computer Science. Paper no. 43.
[7] JiaweiHan, MichelineKamber Data Mining Concepts and Techniques [M]Beijing: Mechanical Industry Press, 2005 185-218.