© 2017 IJSRSET | Volume 3 | Issue 1 | Print ISSN: 2395-1990 | Online ISSN : 2394-4099 Themed Section: Engineering and Technology
Design and Implementation of a Standalone Graphical User Interface
for Wind Speed and Wind Electric Energy Density Computations
Abdulraheem T.
1, Abam P.
2, Ganiyu H. O.
3, Adebowale G.S.
4and Seidu S.A.
5Power Equipment and Electrical Machinery Development Institute,P.M.B 1029, Okene, Kogi State, Nigeria1, 2,3,4,5
ABSTRACT
This work designs and implements a standalone graphical user interface (GUI) for calculating wind speed at different heights and for computing annual wind electric energy density of any location. The standalone GUI was implemented using MATLAB and it is divided into two sections. One section calculates the wind speed at a specified height while the other computes the annual wind electric energy density. The GUI requires a specified input after which an output is returned. The test result shows that the developed GUI worked as expected with high degree of accuracy and precision. This was validated using result from manual calculations. Hence, making it suitable for wind energy analysis and eliminates the laborious analytical calculations.
Keywords
:
Energy Density, MATLAB, standalone GUI, Wind SpeedI.
INTRODUCTION
Energy is one of the crucial inputs for socio-economic development. The rate at which energy is being consumed by a nation often reflects the level of prosperity that it could achieve. Growing energy demand and environmental consciousness have re-evoked human interest in wind energy. As a result, wind is the fastest growing energy source in the world today. The quantum of energy, associated with the wind is enormous. With today’s technology, wind is an environmentally friendly and economically viable source of energy, which can be tapped in a commercial scale [1]. Wind is among the cheapest renewable sources per unit of electricity produced [2]. Expanding the use of renewable resources such as wind will reduce carbon dioxide emissions which contribute to global warming and lower long-term overdependence on fossil fuels. Furthermore, wind energy like other power technologies based on renewable energy resources is widely available, thereby ensuring security of supply. Prior to construction of any wind farm, a detailed verification of the specific on-site wind conditions is necessary to come up with a suitable wind map in other to identify those areas which have favorable wind regimes [2].
lack of version compatibility option. To solve this hindrance, and to make the GUI an executable file, MATLAB standalone project development tools can be used [4].
1.1 MATLAB Graphical User Interface
The principal elements required to create a MATLAB Graphical User Interface are components, figures and callbacks. Each item on a MATLAB GUI (pushbuttons, labels, edit boxes, etc.) is a graphical component. The types of components include graphical controls (push buttons, edit boxes, lists, sliders, etc.), static elements (frames and text strings), menus, and axes. The components of a GUI must be arranged within a figure, which is a window on the computer screen. Finally, there must be some way to perform an action if a user clicks a mouse on a button or types information on a keyboard. A mouse click or a key press is an event, and the MATLAB program must respond to each event if the program is to perform its function. For example, if a user clicks on a button, that event must cause the MATLAB code that implements the function of the button to be executed. The code executed in response to an event is known as a callback. There must be a callback to implement the function of each graphical component on the GUI [5]. MATLAB GUI can be built using GUIDE (GUI Development Environment) or coding from MATLAB editor. GUIDE is a set of MATLAB tools designed to make building GUIs easier and faster. Just as writing math in MATLAB is much like writing it on paper, building a GUI with Guide is much like drawing one on paper. As a result, complex graphical tool can be laid out in minutes. Once the buttons and plots are in place, the Guide Callback Editor allows one set up the MATLAB code that gets executed when a particular button is pressed [6].
1.2 Wind speed at varying heights
Wind speed measurements for wind resource assessment are generally measured at a reference height (ref. height) of 10 m above the ground. Depending on the type and capacity of the turbine, it is usually installed at a height above 10m. Wind speed tends to increase with height in most locations, a phenomenon known as wind shear. The degree of wind shear depends mainly on two factors, atmospheric mixing and the roughness of the terrain. Atmospheric mixing typically follows a daily cycle driven by solar heating. At the hub
height of a wind turbine, this cycle often causes wind speeds to increase in the daytime and decrease at night. However, the range of variation between night and day typically diminishes as hub height increases. At a height of approximately 50 meters, it weakens or may even disappear in some cases [7] .Wind speed closer to the ground changes with height due to resistance and roughness of the terrain, trees, hills, and houses [8]. Under normal conditions, a wind speed is greater at higher distance above ground [9]. Wind shear may be greatly reduced or eliminated where there is an abrupt change in terrain height such as a sea cliff or mountain ridge [7]. The wind speeds at a height can be estimated using the power law relationship, as given in equation (1) [10]:
V=
Where;
V= calculated wind speed
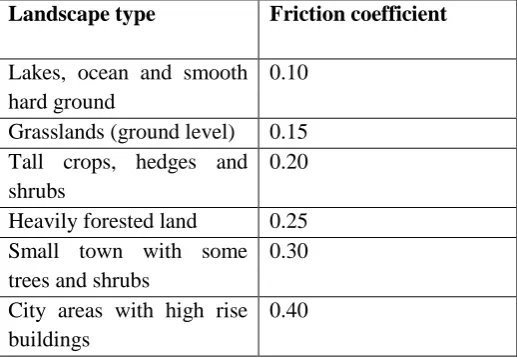
The friction coefficient is a function of topography. The friction coefficient of different landscape is shown in Table 1[11].
Table 1 : Friction Coefficient Of Different Landscapes
Landscape type Friction coefficient
Lakes, ocean and smooth hard ground
0.10
Grasslands (ground level) 0.15 Tall crops, hedges and shrubs
0.20
Heavily forested land 0.25 Small town with some trees and shrubs
0.30
City areas with high rise buildings
0.40
1.3 Wind Energy Density
different rates. Different surfaces such as land, water, desert and forest areas absorb or reflect sun at different rates and most notably during the day and night [12] .This air in motion possesses kinetic energy, which can be converted to either mechanical or electrical energy depending on its application. In the case of windmill, the kinetic energy is converted to mechanical energy for the grinding of grains. But for a wind turbine, it is a case of conversion from kinetic to electrical energy. Not all the power available in wind can be converted to electric power because air is continuously moving. According to Albert Betz, the maximum fraction of achievable electric power from wind is 0.59. This is called the power coefficient [13] Therefore, the electric wind power density, P is given by equation (2) [11].
P = Cp
(2)
Where
P = wind power density in W/m2
= air density in kg/m3 (taking as 1.225kg/m3)
V =wind speed in m/s
Cp= power coefficient, taking as 0.59
Wind energy density, E in kWh/m2 can be calculated using equation (3)
Wind energy density,
E (kWh/m2) = ( ) ( )
(3)
Where
Time = duration of flow of the energy in hours.
For annual wind energy density, Time = 365 days (1year)
Time = 365 x 24 hours Time = 8760 hours
Therefore, annual wind electric energy =
(4)
Annual wind electric energy density = 3.1657 (5)
II.
METHODS AND MATERIAL
The design and implementation of computing software which calculates wind speed at different heights and also computes annual wind electric energy density was realized using MATLAB software. The MATLAB graphical user interface (GUI) was used to achieve these objectives. The process is divided into three stages. They include Laying out the GUI, Programming of the GUI and deployment
2.1 Laying out the GUI
The design of the software was done using GUI Development Environment (GUIDE) window. In this window, layout of different GUI components such as push button, edit text and static text were made. After completion of the design, the GUI was saved with a name which automatically carries an extension of “.fig”.
2.2 Programming of the GUI
After saving the designed GUI, the m-file was programmed by writing codes under various functions. During this coding, the necessary formulas were added. After coding was completed, the GUI was test run by clicking the run button.
2.2.1 Program Algorithm
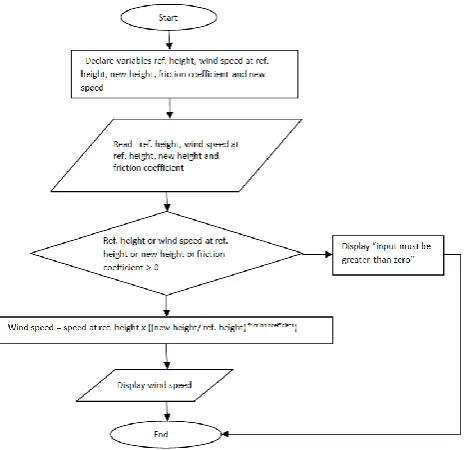
The Algorithms for computing wind speed at different heights are as follows:
Step 1: Start.
Step 2: Declare variables ref. height, wind speed at ref. height, new height, friction coefficient and new speed. Step 3: Read input variables ref. height, wind speed at ref. height, new height and friction coefficient.
Step 4: If any of the input variables is less than zero, display “input most be greater than zero” else go to step 5
Step 5: calculate new wind speed = wind speed at ref.
height x(
)
Step 6: Display new wind speed. Step 7: End.
The Algorithms for computing annual wind electric energy density are as follows:
Step 2: Declare variables wind speed and annual energy density.
Step 3: Read input variable wind speed
Step 4: if the input variables is less than zero, display “input most be greater than zero” else go to step 5
Step 5: calculate annual energy density = 3.1657 x (wind speed)3
Step 6: Display annual energy density Step 7: Stop.
2.2.2 Flow chart
The program flow charts for calculating wind speed at varying heights and computation of wind electric energy density are shown in figure 1 and figure 2 respectively.
Figure 1: flow chart for computing wind speed at
varying heights
Figure 2 : Flow chart for computing annual wind electric energy density.
2.3 Deployment
This last stage is to make the GUI a standalone project and an executable file. This was accomplished with the use of MATLAB’s “deploytool”. In the “deploytool” window a project was created using a name. The m-file and the “.fig” file created earlier were added to the project. The project was then built for compilation.
III.
RESULTS AND DISCUSSION
Figure 3. Developed graphical user interface for wind speed and wind electric energy density computation.
supplied, after which a result is given with the clicking of the calculate button. All inputs and outputs can be referenced to zero by clicking the reset button.
IV.
CONCLUSION
Design and implementation of standalone MATLAB based GUI that computes wind speed at different heights and also calculates annual wind energy density has been successfully carried out. The implementation has been successful because the GUI is working accurately. This GUI will improve wind energy analysis by elimination of laborious manual calculations
.
V.
REFERENCES
[1]. Mathew, S. (2006) “Wind Energy Fundamentals, Resource Analysis and Economics” Springer-Verlag Berlin
Heidelberg 2006 pp2.
[2]. Idris, N. A., Lamin, H. S., Ladan, M. J. & Yusuf, B. H. (2012) “Nigeria’s Wind Energy Potentials: the Path to a Diversified Electricity Generation-Mix” International Journal of Modern Engineering Research, vol.2., No.4.
[3]. Ogbeide, K.O & Okoli, C.O. (2015) “Graphical user Interface(GUI) for HATA Model Path Loss computation” Journal of Electrical and Electronic Engineering, Vol. 12, No. 2, pp 93. [4]. Nasiruzzaman, A. B. M. “Using MATLAB to
develop standalone graphical user interface (GUI) software packages for educational purposes” Department of Electrical & Electronic Engineering, Rajshahi University of Engineering & Technology, Bangladesh. [5]. Refaat, Y. A. & Ahmed, A. “Introduction to
Graphical User Interface (GUI) MATLAB 6.5” UAE University College Of Engineering Electrical Engineering Department IEEE
UAEU Student Branch.
[6]. Building GUIs with MATLAB (1996), Math Works, Inc.
[7]. Qamar, Z. C. “An Investigation on Wind Power Potential of Gharo-Sindh, Pakistan” Pakistan Journal of Meteorology, Vol. 6, Issue 11. [8]. Kalekirstos, G. G. (2013) “Feasibility Study of
Small Scale Standalone Wind Turbine for Urban Area” KTH Industrial Engineering and Management , pp. 7-35
[9]. Kane, M. M. (2005) “Analysis of Wind Data and Wind Energy Potential along the Northern Coast of Senegal” Rev. Energ. Ren. ,Vol. 8. Standford H. M. P.(2010) “ Hill Wind Energy Development” Partnerships for Renewable Development Co. Ltd.
[10]. Francisco, B.R., César, A.C. and Sebastián R. M. (2011). “ Methodologies Used in the Extrapolation of Wind Speed Data at Different Heights and Its Impact in the Wind Energy Resource Assessment in a Region” Wind Farm - Technical Regulations, Potential Estimation and Siting Assessment, pp100.
[11]. Sanusi, Y.K. and Adedokun O “Determination of Energy Production Potential of Wind Resources In Lautech Ogbomosho, Nigeria” Journal of Engineering and Applied Sciences, vol. 4.