Bank Risks and Total Productivity Changes in
Malaysian Banks
Zuriawati Zakaria
Department of Finance, Faculty of Business and Finance, Universiti Tunku Abdul Rahman, Malaysia.
Noorfaiz Purhanudin
Department of Finance, Faculty of Business and Finance, Universiti Tunku Abdul Rahman, Malaysia.
Abstract
This study employs non-parametric Data Envelopment Analysis (DEA) to obtain the Malmquist total factor productivity index (MPI). The analysis is based on 19 Malaysian banks (domestic and foreign) and the period of study is from 2010 to 2014. The results indicate that the progress or retrogress of 14 Malaysian banks’ efficiency were largely due to scale rather than pure technical efficiency with 64.29% and 35.71%, respectively. The remaining five banks recorded stagnant stage, namely Affin Bank, Alliance Bank, Bank of China, J.P. Morgan Chase Bank Berhad and United Overseas Bank (Malaysia). The 7.7% progress in productivity among Malaysian banks could be attributed to the 9.85% increase in technological change. The findings regarding the relationship between bank risk and total productivity change are reported based on panel random effect regression model. Banks with higher liquidity risk and which are heavily diversified face declines in total productivity change. The positive effects of total productivity change could be seen in capital risk and bank loan to assets ratio.
Keywords: Total Productivity Change, Capital Risk, Credit Risk, Liquidity Risk
1. INTRODUCTION
The landscape of the Malaysian banking system has undergone major changes over the last three decades. The rise in global competition, consolidation, increase in deregulation (especially after Asian Financial crisis 1997/98), new innovative products and delivery channels have an impact on the role of banks as financial intermediaries. In the dynamic new banking environment, as Batchelor (2005) stated, the banks’ overall efficiency not only depends on the competitiveness of a particular banking system but also on the ability of the banks to undertake financial innovation in response to rapid changes in technology.
Efficiency and productivity change evaluations, especially of the banking sector have been extensively undertaken. The company management and institutions mainly focus on these evaluations to further improve their operational performance, competitiveness and sustainability (Siegel, 1981). A large number of researchers have discussed bank efficiency and productivity (e.g. Sufian, 2007; Rezitis, 2006; Othman, Kari and Hamdan, 2013) but only a few examined the issue of bank risk and productivity change. Bank risks affect bank productivity due to high costs involved in managing risks (Das, 2002). To achieve a given level of output, the risky banks would require more inputs compared to banks with lower risks. As financial intermediaries, credit risk is one of the oldest and most significant of the risks faced by banks (Chen & Pan, 2012). The forces of globalization, financial deregulation and innovation have yet to reduce the devastating effects of credit risk on the financial institutions (Paradi, Asmild, & Simak, 2004). Therefore, this study examines the relationship between bank risks (namely capital risk, credit risk and liquidity risk) and changes in bank productivity. The findings of this study would contribute towards improving the overall operational efficiency of banks and ensuring policymakers observe banking safety.
2. LITERATURE REVIEW 2.1 Total Productivity changes
On average, for the period 2000 to 2004, Public Bank recorded the highest growth in Total Factor Productivity changes (TFP) while the lowest was by Bank Muamalat with 15% and -13.5%, respectively (Omar, Rahman, Yusof, Majid & Rasid, 2006). The major factors affecting commercial bank’s TFP (1.3%) are efficiency change (1.6%) and decrease in technical change of -0.3%. The authors revealed that the size of the banks does matter since the scale efficiency of banks is largely attributed to efficiency growth. The improvement in Malaysian commercial banks’ TFP is mainly due to innovation rather than technical change. However, during the period 2006 to 2010, Othman, Kari and Hamdan (2013) reported that scale inefficiency among 14 Malaysian banks was greater than pure technical inefficiency. It shows that given their scale of operations, banks are inefficient in exploiting their economies of scale.
(MPI), the authors reported that the NBFIs technological change (TC) was largely attributed to productivity with -5.9%, followed by technical efficiency (TE) with 5.1%. The NBFIs Pure Technical Efficiency (PTE) was the major contributor to technical efficiency. Based on PTE (SE) results, 12 (11) NBFIs showed improvement during the years 2000-2004, while 3 (8) NBFIs showed a decline and 5 (1) NBFIs remained stagnant. The results are consistent with the findings of the earlier study by Krishnasmy, Ridzwa and Perumal (2004). It is evident that the main determinant of Malaysian bank TFP is technological change and not technical efficiency change. Most banks highly invest in retail banking technologies such as ATMs, internet banking, smart cards and wireless banking.
Technical inefficiency is by nature instead of allocative (Aly, Grabowski, Pasurka & Rangan, 1990). However, Pasiouras (2008) reported that banks that expand their operations abroad are more efficient compared to banks that only focus on the national level. Bank efficiency tends to increase as their capitalization level, loan activity and market power expand.
Rezitis (2006) revealed that the loss of efficiency of the Greek banking sector during the period 1993-1997 was due to improper scale of operations. The pure efficiency of the bank is higher since there is increased competition between banks and internationalization of the Greek banking system (accelerated liberalization and deregulation of the financial system). In addition, the adoption of information technology brought about major structural changes which moved the banks away from optimal scale of operations.
The Total Factor Productivity changes (TFP) in the Hong Kong and Macao banks are not completely immune from the volatilities of external economies (Fu & Vong, 2011). The Macao banks experienced higher volatility in terms of TFP compared to Hong Kong banks during the period 1995 to 2009. The 17 Hong Kong banks and 12 Macao banks were affected by the Asian Financial Crisis 1997 that led to declines in TFP. Compared to banks in Hong Kong, the banks in Macao suffered greater negative impacts during the global economic downturn years of 2001/02. This is because Macao is an open economy and its main industry is tourism. The TFP for Hong Kong (Macao) decreased by 3.5% (15.4%) from 1997 to 1998 and by 3.4% (8.4%) from 2001 to 2003. Due to transition in year 1999, Macao banks operated under more favorable environment and recorded TFP growth of 22.3%. Hong Kong banks underwent large declines in TFP between 2007 and 2008 due to the global financial crisis and the complex innovative structural products offered to customers.
2.2 Bank Risk 2.2.1 Capital Risk
Using productive efficiency, total factor productivity growth and net interest margin as measure of bank performance, Brissimis, Delis, and Papanikolaou (2008) reported that bank’s capital risk positively influences efficiency and productivity. Lower levels of bank capital (higher capital risk) expose banks to adverse development and consequently impact their performance. The authors suggested that the balance sheets of banks in the ten newly acceded EU countries (Bulgaria, Czech Republic, Estonia, Hungary, Latvia, Lithuania, Poland, Romania, Slovakia, & Slovenia) should be restructured by raising their capital base. According to Das (2002), capital, risk and productivity change are intertwined, each reinforce and to a degree, complement the other. Banks with insufficient capital have lower productivity and are subject to a higher degree of regulatory pressure.
2.2.2 Credit Risk
The credit risk of 34 Taiwanese commercial banks had a serious impact on productivity (Chen & Kao, 2011). Banks that have good credit risk management and positive changes in productivity gain higher competitive advantage and show continuous improvement. However, banks with negative productivity should adopt new strategies on credit risk management to obtain competitive advantage and have productivity gains. The quality of risk management activities in banks is affected by the credit risks and the way they absorb potential financial losses (Van Hoose, 2010). Chen and Pan (2012) revealed that when the bank’s credit risk increase, an increase in the ratio of total loans to total assets is unable to improve technical efficiency (TE) and pure technical efficiency (PTE) at the decision making units (DMUs). Pasiouras (2008) proved that the loan loss provision (as a measure of credit risk) is able to increase technical efficiency by almost 1.5%.
High productivity indicates a decline in Net Non Performing Loans to Net Advances (NPA), especially for small banks and supports the mutual reinforcing relationship between credit risk and financial leverage (Das, 2002). It suggests that banks are able to achieve the main objective of maximizing their profits. In addition, the authors reported that the greater the bank capitalization, the lower the credit risk for medium sized banks. A limited scale effects is derived from small banks operations.
2.2.3 Liquidity Risk
Traditionally, banks hold large amounts of cash and substantial amount of short term-term government securities as a way to address their liquidity problem. However, it was observed that the efficiency and productivity of banks in the ten newly acceded EU countries during the period 1994-2005 reduced when the banks held higher level of liquid assets (Brissimis, Delis, & Papanikolaou, 2008). Loans are illiquid assets to banks (Daimond & Rajan, 2001) and specific collection skills are required to recollect them. The banks specialized personnel often encounter difficulties in recollecting the loans, resulting in selling them at a discount or becoming poor collaterals. This would eventually have an impact on the productivity of the banks. Ahmad (2006) reported a positive relationship between liquidity risk and the efficiency of commercial banks in Pakistan in the years 1991 to 2002. Better management of liquidity risk would help increase the efficiency of banks. Given the ability to operate more productively, the efficiency of the banks increase, hence they enjoy lower production costs. This would enable banks to offer more reasonable loan terms and eventually expand their market share compared to inefficient banks.
3. METHODOLOGY
3.1 Malmquist Productivity Index (MPI)
Theoretically, productivity change is derived from the change in the level of output produced for a given change in the level of input. The two principal methods used in evaluating productivity change are the nonparametric and the parametric approaches. The nonparametric approaches include Data Envelopment Analysis (DEA) and Free Disposal Hull (FDH), while the parametric approaches consists of Stochastic Frontier Approach (SFA), Thick Frontier Approach (TFA) and Distribution Free Approach (DFA) (Krishnasamy, Ridzwa & Perumal, 2004).
According to Fare, Gross, Norris and Zhang (1994), this methodology is able to provide a decomposition of productivity change (PC) into technical change (TC) (shifts in the best-practice frontier) and efficiency change (EC) (individual observations shifting relative to the best-practice frontier). The results from MPI indicate the sources of efficiency change, that is, improvements in management practices (pure technical efficiency change) or improvements in optimal size (scale efficiency change) (Sufian, 2007). Parametric approach involve deterministic trend in the stochastic frontier to capture the impact of technical change with the strong assumption that on average the progress is at a constant rate across banks. However, MPI is based on period-to-period comparisons that permit technical progress to speed up, slow down and reverse (Casu, Girardone, & Molyneux, 2004).
Based on Färe, Grosskopf, Norris, & Zhang, Z. (1994) and Sueyoshi and Goto (2011), this research employs the nonparametric method DEA to compute Malmquist Productivity Index (MPI). The MPI measures TFP change between two data points between period t and t +1, and is defined as:
) 1 ( 2 / 1 ) , ( 1 ) 1 , 1 ( 1 ) , ( ) 1 , 1 ( ) , , 1 , 1 ( 1 t x t y t j D t x t y t j D t x t y t j D t x t y t j D t x t y t x t y t j M
Where the notation M0 represents the productivity from period t to t +1 with D’s being output distance
functions. A value of M0 greater than one indicates a positive TFP growth between the two periods, while a value
less than one indicates a decline in TFP. An equivalent way of writing Equation (1) is:
) 2 ( 2 / 1 ) , ( 1 ) 1 , 1 ( 1 ) , ( ) 1 , 1 ( ) , ( ) 1 , 1 ( 1 ) , , 1 , 1 ( 1 t x t y t j D t x t y t j D t x t y t j D t x t y t j D t x t y t j D t x t y t j D t x t y t x t y t j M
The efficiency change (EFFCH) is further decomposed into pure efficiency change (PECH) and scale efficiency change (SECH) that impact the company’s scale of operations as follows;
) 4 ( )
( )
, , 1 , 1 (
1 yt xt yt xt TFPCH PECH SECH TECHCH t
j M
PECH SECH
EFFCH
3.2 Sample and Variables
The dataset includes observations from 19 banks (domestic and foreign banks) that operated in Malaysia during the period 2010 to 2014 (shown in Table 3.1). The data is gathered from the annual reports of the banks. This research followed the intermediation approach as suggested by Sealey and Lindley (1977) to determine the components of inputs and outputs of banks. By employing three inputs (Total Assets, Total Deposits and Personal Expenses) this research model of the Malaysian banks produced three outputs namely, Total Loans, Interest Income and Non Interest Income. Using these output and input data, the MPI was computed to obtain the TFP.
Table 3.1: The List of Banks used in this Study.
No Bank Abbreviation Used
1 Affin Bank AFB
2 Alliance Bank ALB
3 Ambank AMB
4 Bangkok Bank BGB
5 Bank of China BOF
6 Commerce International Merchant Bankers CIMB
7 Citibank CTB
8 Deutsche Bank DTB
9 Hong Kong and Shanghai Banking Corporation HSBC
10 Hong Leong Bank Berhad HLB
11 J.P. Morgan Chase Bank Berhad JPMC
12 Malayan Banking Berhad MBB
13 OCBC Bank (Malaysia) Berhad OCBC
14 Public Bank Berhad PBB
15 RHB Bank Berhad RHB
16 Standard Chartered Bank Malaysia Berhad SCBB
17 The Bank of Nova Scotia Berhad BNSB
18 The Royal Bank of Scotland Berhad RBSB
19 United Overseas Bank (Malaysia) UOB
This research further examines the impact of bank risks towards the TFP using balance panel data regression. The three bank risks used are capital risk, credit risk and liquidity risk. In addition, loan to assets ratio, bank diversification and bank size were also used to analyze the influence on the bank’s TFP. Hence the equation is:
) 5 ( *
6 *
5 *
4 *
3 *
2 *
1
CAPRISK CRRISK LIQRISK LNASSET BDIVER SIZE
TFP
Where α = constant term; TPF = Total Productivity Change; CAPRISK = Capital Risk; CRRISK = Credit Risk; LIQRISK= Liquidity Risk; LNASSET = Loan to Asset Ratio; BDIVER = Bank Diversification; SIZE = Bank Size; ε = error term.
Table 3.2: Description of Variables
Variables Measurement Dependent variable
Total Productivity Changes (TFP) Derived from MPI
Independent variables
Capital Risk (CAPRISK) Ratio of Equity Capital to Total Assets
Credit Risk (CRRISK) Ratio of Total Loans to Total Deposits
Liquidity Risk (LIQRISK) Ratio of Deposit Placements to Total Assets
Loan to Asset Ratio (LNASSET) Ratio of Total Loans to Total Assets
Bank Diversification (BDIVER) Ratio of Non Interest Income to Total Assets
4. FINDINGS 4.1 Descriptive statistics
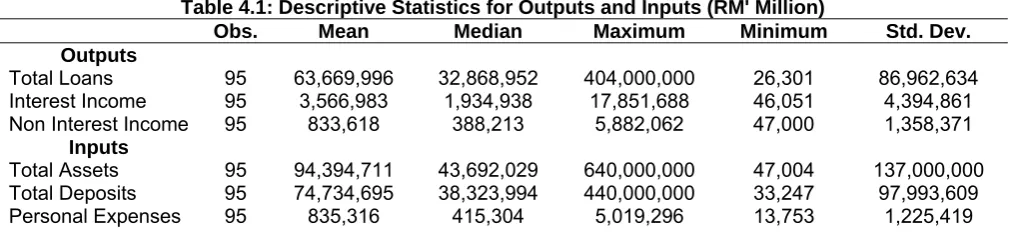
Table 4.1: Descriptive Statistics for Outputs and Inputs (RM' Million)
Obs. Mean Median Maximum Minimum Std. Dev.
Outputs
Total Loans 95 63,669,996 32,868,952 404,000,000 26,301 86,962,634
Interest Income 95 3,566,983 1,934,938 17,851,688 46,051 4,394,861
Non Interest Income 95 833,618 388,213 5,882,062 47,000 1,358,371
Inputs
Total Assets 95 94,394,711 43,692,029 640,000,000 47,004 137,000,000
Total Deposits 95 74,734,695 38,323,994 440,000,000 33,247 97,993,609
Personal Expenses 95 835,316 415,304 5,019,296 13,753 1,225,419
Table 4.1 presents the summary statistics of the variables used to construct the productivity frontiers which are measured in Malaysian Ringgit (RM). It includes descriptive statistics pertaining to the outputs; total loans (includes total loans, advances and financing), interest income (includes interest earned on loans, advances, financing and investments), non-interest income (includes service charges and fee income, investment income, gross dividends and foreign exchange gains) and inputs; total assets (defined as anything that a business owns, has value, and could be converted into cash, which among others consists of cash, loans, derivative assets property, plant and equipment etc.); total deposits (includes deposits from customers); personnel expenses (inclusive of total expenditures on employees such as salaries, employee benefits and reserves for retirement payment).
The statistics reveal that on average, banks operating in Malaysia (both local and foreign) had extended loans totaling RM63.67 million during the period 2010 to 2014. This implies that these banks have greater intensity towards interest-bearing assets. These activities contributed to the bank’s interest earningsreaching a maximum of RM17.85 million. On average (median), the bank’s income generated from non-interest income such as service charges and fees, commissions and foreign exchange gains amounted to RM0.83362 million (RM0.38821 million). The minimum total assets during the period of study was RM47,004 and the maximum was RM640 million. Furthermore, the highest amount of total deposits placed by customers with the banks was RM440 million with the lowest being RM33,247. In terms of personnel expenses, it is interesting to note that on average (median) the banks expenditure towards its employees totaled RM0.83532 million (RM0.4153 million).
4.2 Empirical Results
4.2.1 Production and Efficiency changes
Table 4.2: Malmquist Productivity Index (MPI) Summary of Annual Means
Year Effch Techch Pech Sech TFPch
2010 - - -
2010-2011 0.966 0.340 0.948 1.018 0.329
2011-2012 1.017 2.208 1.011 1.005 2.244
2012-2013 1.065 0.389 1.060 1.004 0.414
2013-2014 0.909 1.457 0.976 0.931 1.324
Notes: Effch = Efficiency Change; Techch = Technological Change; Pech = Pure Technical Efficiency Change; Sech = Scale Efficiency Change; TFPch = Productivity Change. Banks are categorized according to the following. (1) Productivity Progress: TFPch> 1, (2) Productivity Regress TFPch<1, (3) Productivity Stagnation: TFPch = 1.
Malaysian banks’ productivity improved only in the years 2011 and 2013, while in 2010 and 2012 there was a decline in productivity of the banks. Table 4.2 clearly reveals that the change in overall productivity was due to a shift in technology which leads to both productivity growth and its decline. On the whole, the 7.7% progress in productivity among Malaysian banks during the period 2010 to 2014 could be described mainly by the 9.85% increase in technological change.
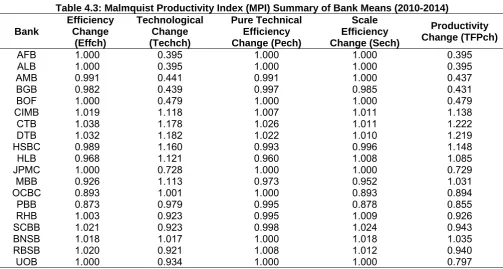
Table 4.3: Malmquist Productivity Index (MPI) Summary of Bank Means (2010-2014)
Bank
Efficiency Change
(Effch)
Technological Change (Techch)
Pure Technical Efficiency Change (Pech)
Scale Efficiency Change (Sech)
Productivity Change (TFPch)
AFB 1.000 0.395 1.000 1.000 0.395
ALB 1.000 0.395 1.000 1.000 0.395
AMB 0.991 0.441 0.991 1.000 0.437
BGB 0.982 0.439 0.997 0.985 0.431
BOF 1.000 0.479 1.000 1.000 0.479
CIMB 1.019 1.118 1.007 1.011 1.138
CTB 1.038 1.178 1.026 1.011 1.222
DTB 1.032 1.182 1.022 1.010 1.219
HSBC 0.989 1.160 0.993 0.996 1.148
HLB 0.968 1.121 0.960 1.008 1.085
JPMC 1.000 0.728 1.000 1.000 0.729
MBB 0.926 1.113 0.973 0.952 1.031
OCBC 0.893 1.001 1.000 0.893 0.894
PBB 0.873 0.979 0.995 0.878 0.855
RHB 1.003 0.923 0.995 1.009 0.926
SCBB 1.021 0.923 0.998 1.024 0.943
BNSB 1.018 1.017 1.000 1.018 1.035
RBSB 1.020 0.921 1.008 1.012 0.940
UOB 1.000 0.934 1.000 1.000 0.797
Note: Banks are categorized according to the following. (1) Productivity Progress: TFPch> 1, (2) Productivity Regress TFPch<1, (3) Productivity Stagnation: TFPch = 1
This section discusses productivity change of selected banks operating in Malaysia as measured by the Malmquist Productivity Index (MPI) method. Productivity change (TFPch) constitutes efficiency change (Effch) and technological change (Techch) components. The Malmquist summary of bank means of TFPch, Effch, Techch, Pech and Sech for the years 2010 to 2014 are presented in Table 4.3. The components of the productivity change index present interesting results.
Pure technical efficiency change (Pech) and scale efficiency change (Sech) are the components of total efficiency change (Effch). The findings reflected that there were changes in the efficiency levels of 7 (seven) banks. The source of the changes (increase and decrease) in Malaysian banks’ efficiency levels was largely scale (64.29%) rather than pure technical efficiency (35.71%). Another five banks, namely Affin Bank, Alliance Bank, Bank of China, J.P. Morgan Chase Bank Berhad and United Overseas Bank (Malaysia) were stagnant. The statistics also revealed that Ambank experienced 100% decline in total efficiency due to pure technical inefficiency. Meanwhile, the 1.8% increase in efficiency of The Bank of Nova Scotia Berhad is 100% influenced by its scale efficiency. Furthermore, a total of 11 banks in Malaysia showed a regress in technological change, which ranged from as low as 2.1% (Public Bank) to the highest being 60.5% (Affin Bank and Alliance Bank). At the same time, 8 banks reported a growth in terms of technology. OCBC Bank (Malaysia) Berhad demonstrated a marginal expansion of only 0.1% whilst Deutsche Bank was leading at 18.2%.
4.2.2 Regression results
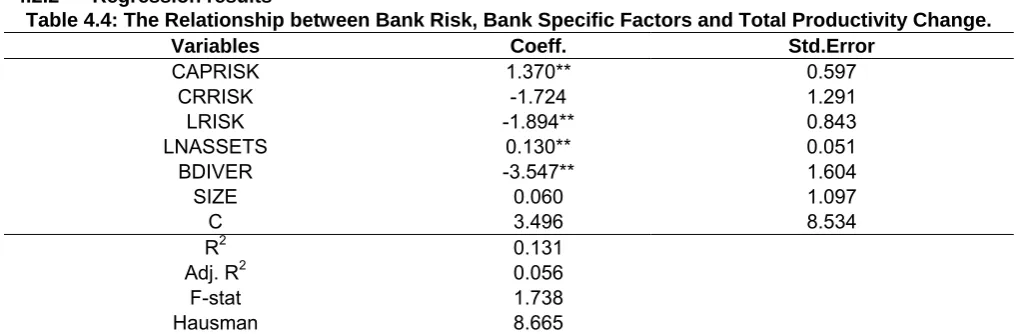
Table 4.4: The Relationship between Bank Risk, Bank Specific Factors and Total Productivity Change.
Variables Coeff. Std.Error
CAPRISK 1.370** 0.597
CRRISK -1.724 1.291
LRISK -1.894** 0.843
LNASSETS 0.130** 0.051
BDIVER -3.547** 1.604
SIZE 0.060 1.097
C 3.496 8.534
R2 0.131
Adj. R2 0.056
F-stat 1.738 Hausman 8.665 Notes: CAPRISK = Capital Risk; CRRISK = Credit Risk; LRISK = Liquidity Risk; LNASSETS = Loan to Assets Ratio;
BDIVER = Bank Diversification; SIZE = Bank Size. Significance Level ***1%, **5% and *10%.
Table 4.4 reports the regression results of total productivity and it indicates that the random effect was more preferable since chi-square was insignificant at the 1% level. This study includes the two categories of determining variables: bank risk that encompasses capital risk, credit risk and liquidity risk as well as bank-specific factors that comprise bank loan to assets ratio, bank diversification and bank size. The introduction of bank risk in the study is to assess its impact on changes in productivity of banks. The results in Table 4.4 show that increasing capital risk results in declining productivity among Malaysian banks for the period 2010 to 2014. This finding is consistent with Brissimis, Delis, and Papanikolaou (2008) who reported that increased level of capital risk expose banks to adverse development and consequently impact their performance. Moreover, liquidity risk shows negative relationship with productivity change. According to Daimond and Rajan (2001), loans are illiquid assets and specific collection skills are required. Therefore, difficulty in collecting the loans would make it being sold at a discount or becoming a poor collateral. This would eventually affect the productivity of the banks. Surprisingly, credit risk does not have any influence on changes in productivity. Consistent with the earlier study by Chen and Pan (2012), an increase in bank credit risk due to increase in ratio of total loans to total assets does not improve technical efficiency (TE) and pure technical efficiency (PTE) at the decision making units (DMUs).
5. CONCLUSION
This study employed Malmquist total factor productivity index (MPI) to measure changes in total productivity. The results demonstrate that on average, efficiency and productivity of Malaysian banks for the period 2010 to 2014 have been fluctuating. Based on the observations, changes in Malaysian banks’ efficiency were largely due to scale rather than pure technical efficiency. Citibank recorded the highest change in its efficiency. Meanwhile, Deutsche Bank displayed the utmost shifts in bank’s productivity by capturing the effects of new product development and innovations. The finding also implies that regardless of the bank size, reduced level of bank capital leads to improved productivity. Moreover, the effect of liquidity risk on bank productivity is negative. As identified, loan is the dominant asset held by banks and is categorized as illiquid asset. Hence, if bank loans are not paid off, it will affect productivity growth. Analysis indicated that Citibank attained the largest productivity decline during the period of study. In a nutshell, this study has been able to show that bank risks play a strategic role in shaping productivity of banking units in addition to the inputs and outputs.
REFERENCES
Ahmad, S., 2006, Banking risk and efficiency: an evidence from commercial banks of Pakistan. In GCBE 2006: 6th Global Conference on Business & Economics (pp. 1-15). Association for Business and Economics Research (ABER). Aly, H. Y., Grabowski, R., Pasurka, C., & Rangan, N., 1990, Technical, scale, and allocative efficiencies in US banking: An
empirical investigation. The Review of Economics and Statistics, 211-218.
Batchelor, V. B., 2005, A comparable cross-system bank productivity measure: empirical evidence from the Malaysian dual
banking system. PhD PhD, Edith Cowan University.
Brissimis, S. N., Delis, M. D., & Papanikolaou, N. I., 2008, Exploring the nexus between banking sector reform and performance: Evidence from newly acceded EU countries. Journal of Banking & Finance, 32(12), 2674-2683. Casu, B., Girardone, C., & Molyneux, P., 2004, Productivity Change in European Banking: A comparison of parametric and
Chen, K. C., & Kao, C. H., 2011, Measurement of Credit Risk Efficiency and Productivity Change for Commercial Banks in
Taiwan. Working Paper
Chen, K., & Pan, C., 2012, An empirical study of credit risk efficiency of banking industry in Taiwan. Web Journal of Chinese Management Review,15(1), 1-16.
Das, A., 2002, Risk and productivity change of public sector banks. Economic and Political Weekly, 437-448. Diamond, D. W., & Rajan, R. G., 2001, Banks and liquidity. The American Economic Review, 91(2), 422-425.
Färe, R., Grosskopf, S., Norris, M., & Zhang, Z., 1994, Productivity growth, technical progress, and efficiency change in industrialized countries. The American economic review, 66-83.
Fu, X. Q., & Vong, A., 2011, Bank efficiency and productivity change in Hong Kong and Macao. Working Paper.
Krishnasamy, G., Hanuum Ridzwa, A., & Perumal, V., 2004, Malaysian post merger banks' productivity: application of Malmquist productivity index. Managerial Finance, 30(4), 63-74.
Omar, M. A., Rahman, A. R. A., Yusof, R. M., Majid, M. S. A., & Rasid, M. E. S. M., 2006, Efficiency of commercial banks in Malaysia. Asian Academy of Management Journal of Accounting and Finance, 2(2), 19-42.
Othman, A., Kari, F., & Hamdan, R., 2013, A comparative analysis of the co-operative, Islamic and conventional banks in Malaysia. American Journal of Economics, 3(5C), 184-190.
Paradi, J. C., Asmild, M., & Simak, P. C., 2004, Using DEA and worst practice DEA in credit risk evaluation. Journal of Productivity Analysis,21(2), 153-165.
Pasiouras, F., 2008, Estimating the technical and scale efficiency of Greek commercial banks: the impact of credit risk, off-balance sheet activities, and international operations. Research in International Business and Finance,22(3), 301-318.
Rezitis, A. N., 2006, Productivity growth in the Greek banking industry: a non-parametric approach. Journal of Applied economics, 9(1), 119.
Sealey, C. W., & Lindley, J. T., 1977, Inputs, outputs, and a theory of production and cost at depository financial institutions. The Journal of Finance, 32(4), 1251-1266.
Siegel, I. H.,1981, Productivity Measurement at the Firm Level. In Productivity Analysis at the Organizational Level (pp. 9-29). Springer Netherlands.
Sueyoshi, T., & Goto, M., 2011, DEA approach for unified efficiency measurement: assessment of Japanese fossil fuel power generation. Energy Economics, 33(2), 292-303.
Sufian, F., 2007, The efficiency of Islamic banking industry in Malaysia: Foreign vs domestic banks. Humanomics, 23(3), 174-192.