Design and Performance Analysis of OpenFlow-Enabled
Network Topologies Using Mininet
Idris Zoher Bholebawa
*, Upena D. Dalal
Electronics and Communication Engineering Department, S. V. National Institute of Technology, Ichchhanath, Dumas Road, Surat-395007, Gujarat, India.
* Corresponding author. Tel.: +919624114224; email: [email protected] Manuscript submitted July 22, 2015; accepted April 18, 2016.
doi: 10.17706/ijcce.2016.5.6.419-429
Abstract: Software-defined Networks (SDN) is an innovative idea proposed by an academic institute to
reach certain goal of Next Generation Networks (NGN). SDN decouples control plane and data plane from the network core devices for operating purpose. The control plane is the centrally control unit called SDN controller acting as Network Operating Systems (NOS). The data plane resides inside the network core devices and is only responsible for forwarding data packets controlled by central controller. OpenFlow technology is one of the most successful implementation of SDN, and it is a first standard of SDN defined by Open Networking Foundation (ONF). In this paper, an OpenFlow-based network architecture is discussed by comparing with traditional network. Further, a design and performance analysis of OpenFlow-based various network topologies are done. The performance analysis is done by comparing all network topologies on basis of bandwidth utilization, packet transmission rate, round-trip propagation delay between end nodes and maximum obtained throughput. The design of all the OpenFlow-enabled topologies are done using prototype network emulator called Mininet.
Key words: Mininet, network topologies, OpenFlow, SDN.
1.
Introduction
Computer networks are in constant evolution and many innovating ideas are proposed by researchers and network engineers of different company vendors. The main target for innovating ideas behind the evolution of computer networks is to make network more flexible for testing and management purpose, more scalable by adding/removing active network devices without disturbing other devices for efficient performance. It can be easily programmable for any changes in the device firmware without disturbing the other performance and more reliable to intruder attack, etc. One of the approaches for implementation of flexible, scalable and programmable network is Software-defined Networks (SDN) [1]. SDNs are proposed for modern technology network that can be programmed by a central controlling unit according to various needs and purposes. OpenFlow [2] networks are the efficiently deployed network architecture for SDNs. The OpenFlow network protocol was initiated at Stanford University as a clean slate project in 2008 [3]. Open Networking Foundation (ONF) [4] initiated by different giant networking companies started promoting both OpenFlow and SDN in 2011, and announces OpenFlow as the first standard of SDN.
controlling action by a single software defined controller. In OpenFlow network, the device consists of data plane and is responsible for data forwarding action is termed as OpenFlow-enabled switch and the central controlling unit or control plane is termed as OpenFlow controller. Different types of controller software are available for testing purpose, these software are called as Network Operating Systems (NOS) as described in [5].
The organization of this paper is done by describing OpenFlow-enabled network architecture in Sec. 2. An implementation of OpenFlow network topologies using an open source tool called Mininet [6] is done in Sec. 3. A comparative performance analysis between different OpenFlow network topologies based on results obtained after simulation is done in Sec. 4. Finally, Sec. 5 concludes the analyzed work and deliberates the future perspectives.
2.
OpenFlow Network Architecture
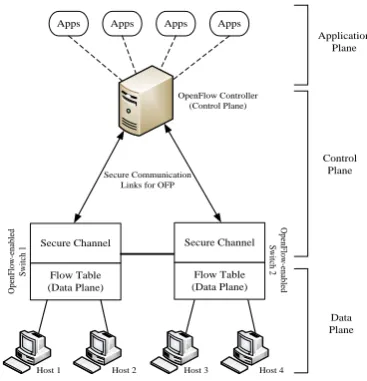
Unlike traditional networking architecture, in OpenFlow-enabled networks control plane and data plane are separated from network core devices as discussed above. The control plane resides on top of all data planes, which is a central controller. Thus, OpenFlow network architecture is referred as centrally control architecture. Software running inside OpenFlow controller is called NOS which act as an intermediate plane between data plane and application plane. The OpenFlow network architecture consists of three layers:
Lowest layer is data forwarding plane and it includes one or more OpenFlow-enabled virtual or physical switches.
Second layer is a control plane and it includes OpenFlow controllers with predefined NOS. Sometimes one or more controller may also require for complex network design.
The third and topmost layer is an application plane. One or more OpenFlow application is defined at this layer for management or data flows controlling task.
The OpenFlow architecture is shown in Fig. 1.
Secure Communication Links for OFP
O p en F lo w -e n ab le d S w it ch
1 Secure Channel
Flow Table (Data Plane) Host 2 OpenFlow Controller (Control Plane) Host 1 O p en F lo w -e n ab le d S w itc h 2 Host 4 Host 3 Secure Channel Flow Table (Data Plane)
Apps Apps Apps Apps
Application Plane Control Plane Data Plane
Fig. 1. The OpenFlow network architecture.
arrives from end host to an OpenFlow controller on secure link using OpenFlow Protocols (OFP) [7]. This in turn enables the controller to decide whether the flow should be added to flow table of switches or to discard. OpenFlow switch consists of flow table and secure channel to communicate with OpenFlow controller using OpenFlow Protocols (OFP). Each data flow through the network must first get permission from the OpenFlow controller in order to verify whether communication is permissible by network policies or not. If controller allows the flow than it will compute the route and inserts the flow entries in the flow table of an OpenFlow switch. The flow table entries done by controller have three fields as shown in Fig. 2 and a detail description is available in [7]. Once an entry is done by controller in a switch, all the succeeding packet arrives from hosts to a switch will match the entry and follow the same path dictated by a controller. If entry not found in the flow table than either switch will discard the packet or it will send to the controller for further processing based on controller decision. A flow diagram of arrived data packet processing in OpenFlow-enabled switch is explained in [8].
Matching Field (Packet Header)
Counters
Actions (Instructions)
Metadata Ethernet Source Address Ethernet Destination Address
Ingress Port
MPLS EXP traffic class IPv4 Source Address
Ethernet Type VLAN ID VLAN Priority
MPLS Lable
TCP/UDP/SCTP src port. ICMP Type TCP/UDP/SCTP dst port. ICMP Type
IPv4 Destination Address IPv4 Protocol / ARP opcode
IPv4 ToS bits
Fig. 2. Flow table entries for matching fields [8].
The three fields shown in Fig. 2 are:
Matching Field (or Packet Header): This field is used to match the updated information in a flow table against the arrived data packet. It consists of ingress port and other header fields which is clearly depicted in Fig. 2.
Counters: This field is used to update the statistics of a packet after matching has done and to keep track on the number of packets and number of bytes for each flows and also to maintain the timing constraints.
Actions: This field is used to perform the specific actions set up by a controller to process an incoming packet after matching has done.
The flow entries in a flow table of a switch are removed after some timeout time called idle timeout as discussed in [7]. The flow entries can also be added or removed manually through some sort of software or hardware constraints as discussed in [9].
3.
OpenFlow Network Topologies
Network topologies are the arrangement of nodes in a network in some specific manner. Here, nodes may include end users (or host machines), network core devices like hubs, switches, routers, etc. It may also include printers, scanners, fax machines, etc. The interconnection of all these devices in some physical style forms a network topology.
built-in network topologies, namely, Minimal Topology, Single Topology, Linear Topology, Tree Topology and Reversed Topology [11]. The default topology is minimal topology which is predefined with one OpenFlow kernel switch connected to two hosts and OpenFlow reference controller, whereas number of switches and hosts can be changed for other topologies using the command-line interface (CLI).
The three basic OpenFlow network topologies, Single, Linear and Tree topology are discussed in this section and a comparative performance analysis between each other is done in next section. The performance analysis of a network relative to bandwidth utilization, delay of the network, overall network throughput and load on the network is done.
3.1.
Single Topology
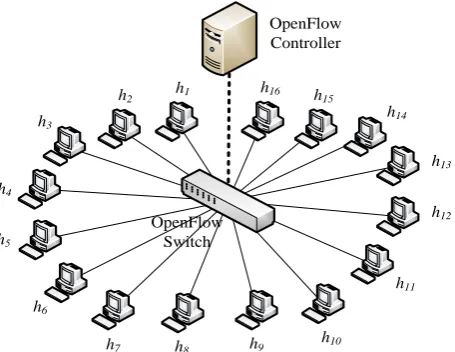
The Single topology consists of a single OpenFlow-enabled switch connected with multiple hosts as defined. The switch in turn connected to the OpenFlow controller via secure channel. A single topology having 16 numbers of hosts is designed in Mininet using CLI command as:
“$ sudo mn --topo = single,16”
On an execution of above command for OpenFlow-enabled single topology in command prompt, a Mininet console will create a single OpenFlow-enabled network topology having 16 hosts connected with a single OpenFlow-enabled switch. The switch in turn connected with control plane (an OpenFlow controller) as shown in Fig. 3.
OpenFlow Controller
OpenFlow Switch
h1
h3
h4
h6
h14
h16 h 15
h13
h12
h11
h10
h9
h8
h7
h5
h2
Fig. 3. OpenFlow-based single topology having 16 hosts.
3.2.
Linear Topology
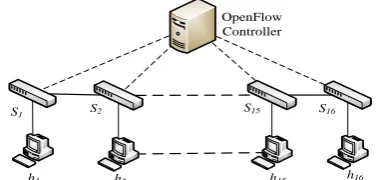
In linear topology, if there are ‘n’ hosts in a network then ‘n’ numbers of switches are required. That means each host will connected with their respective switch. For example, host H1will connect with switch S1, host H2 with switch S2, likewise, and all the switches are connected with one another which in turn
connected with a common controller. A linear topology having 16 hosts is designed in Mininet using CLI command as:
“$ sudo mn --topo = linear,16”
OpenFlow Controller
h1 h2 h15 h16
S2
S1 S15 S16
Fig. 4. OpenFlow-based linear topology having 16 hosts.
A linear topology with 16 hosts connected with its own switches in linear fashion is clearly shown in Fig. 4. All switches are interconnected with each other and are in turn connected with OpenFlow controller as shown.
3.3.
Tree Topology
A tree topology is depending on the arrangement of switches and hosts in a tree fashion. That is, multiple branches are present in a topology and in these branches multiple switches and hosts are connected according to topological design. A tree topology having 16 hosts is designed in command prompt CLI using following command:
“$ sudo mn --topo = tree,depth=2,fanout=4”
In the above given CLI command to create tree topology, a command syntax define depth and fanout. Here, depth indicates the number of levels of switches and fanout indicates the number of output ports available to connect switches or hosts. The depth is require for number of levels of switches to connected starting from controller. It means that, let, controller is at level ‘0’, then two levels of switch will appear according to the given example and lastly a level of hosts will appear. The number of hosts require to connect with each switch depends on the number of fanout, the fanout in this example is 4. Thus, for the given example a number of levels of switches is two and each switch is having 4 number of output ports for connection of next level. The above command will create a tree topology having 16 hosts in Mininet as shown in Fig. 5.
S2
OpenFlow Controller
h1
h3 h4
h2
S3
S1
S4
S5
h9
h5
h6
h7
h8
h10
h11
h12
h13
h14
h15
h16
Fig. 5. OpenFlow-based tree topology having 16 hosts.
4.
Result Analysis and Discussion
In this section, a comparative performance analysis of single topology, linear topology and tree topology are done based on results obtain after execution of networks. The performance analysis is done by comparing all network topologies on basis of bandwidth utilization, packet transmission rate, time required to transmit packet from source node to destination node and maximum obtained throughput.
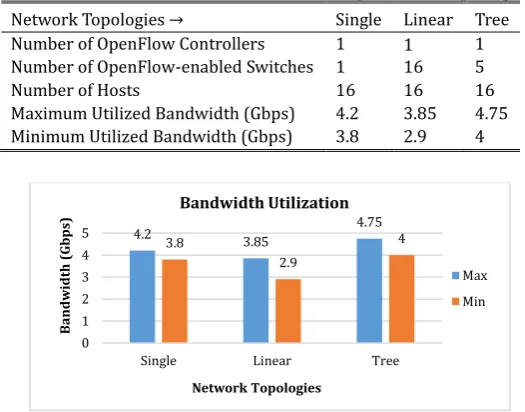
Here, a performance analysis for the three topologies as discussed in previous section is done for a topological designed network of 16 hosts. Bandwidth utilization for all three OpenFlow topologies is tabulated in Table 1 and is shown in Fig. 6.
Table 1. Bandwidth Utilization for Basic OpenFlow Topologies
Network Topologies → Single Linear Tree
Number of OpenFlow Controllers 1 1 1
Number of OpenFlow-enabled Switches 1 16 5
Number of Hosts 16 16 16
Maximum Utilized Bandwidth (Gbps) 4.2 3.85 4.75
Minimum Utilized Bandwidth (Gbps) 3.8 2.9 4
Fig. 6. Bandwidth utilization for basic OpenFlow topologies.
The simulation results obtained for bandwidth utilization of the network is by executing ‘iperf’ [12] command in Mininet. The number of OpenFlow-enabled switches required for implementation of single, linear and tree topology networks for a common 16 hosts architecture is 1, 16 and 5 respectively as discussed in previous section and is shown in Table 1. Based on the results obtained the bandwidth utilized is minimum in linear topology and maximum in tree topology as shown in Fig. 6. In linear topology the connection of switch and host is in one-to-one fashion, i.e. one host is connected with one switch and the switches in turn connected with each other for end nodes connectivity. The overall bandwidth utilization of the link is limited for the number of nodes. Whereas, in tree topology the architecture is distributed though it is centrally controlled as shown in Fig. 5, the overall utilization of bandwidth will be more.
Next, comparisons of the three topologies are done based on Packet Transmission Rate (PTR). The PTR for all the three topologies is compared in Table 2 and is shown graphically in Fig. 7.
Table 2. Packet Transmission Rate for Basic OpenFlow Topologies
Number of Packets Transmitted Total time required for packet transmission (in millisecond)
Single Topology Linear Topology Tree Topology
5 4001 ms 3998 ms 4001 ms
10 8996 ms 9001 ms 8998 ms
20 18998 ms 18999 ms 19000 ms
30 29001 ms 28999 ms 29003 ms
50 48997 ms 49002 ms 49002 ms
100 99000ms 98999 ms 99009 ms
4.2 3.85 4.75 3.8
2.9
4
0 1 2 3 4 5
Single Linear Tree
B
and
w
id
th
(
G
b
p
s)
Network Topologies
Bandwidth Utilization
Fig. 7. Packet transmission rate for basic OpenFlow topologies.
Based on the results obtain for PTR, the total time taken by the three OpenFlow network topologies for different number of packet transmission is almost similar to each other. Since the behavior of all the nodes in any OpenFlow network is same, the OpenFlow network is active for same time interval to execute different network topologies for common packet transmission rate.
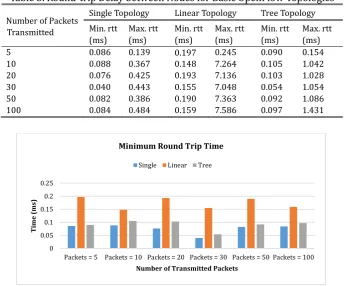
Next, comparison of three topologies is done on the basis of delay between nodes in a network. This can be achieved by finding out the round-trip time (rtt) between nodes by executing ‘ping’ connectivity test. A round-trip delay between nodes for different network topologies with variable PTR is tabulated in Table 3 and is shown graphically in Fig. 8 and Fig. 9 for minimum and maximum delay respectively.
Table 3. Round-trip Delay between Nodes for Basic OpenFlow Topologies
Number of Packets Transmitted
Single Topology Linear Topology Tree Topology
Min. rtt (ms)
Max. rtt (ms)
Min. rtt (ms)
Max. rtt (ms)
Min. rtt (ms)
Max. rtt (ms)
5 0.086 0.139 0.197 0.245 0.090 0.154
10 0.088 0.367 0.148 7.264 0.105 1.042
20 0.076 0.425 0.193 7.136 0.103 1.028
30 0.040 0.443 0.155 7.048 0.054 1.054
50 0.082 0.386 0.190 7.363 0.092 1.086
100 0.084 0.484 0.159 7.586 0.097 1.431
Fig. 8. Minimum round-trip time between nodes for basic OpenFlow topologies.
In the above defined topologies a delay in terms of round trip time is obtained between nodes using ICMP query (Echo Request and Reply) messages. A ping command is executed between node h1and node h16for
all topologies and the results obtained are tabulated in Table 3. From the results obtained, it is clearly
0 20000 40000 60000 80000 100000 120000
Packets = 5 Packets = 10 Packets = 20 Packets = 30 Packets = 50 Packets = 100
Tot
al
Ti
m
e
(m
s)
Number of Transmitted Packets
Packet Transmission Rate Single Linear Tree
0 0.05 0.1 0.15 0.2 0.25
Packets = 5 Packets = 10 Packets = 20 Packets = 30 Packets = 50 Packets = 100
Ti
m
e
(m
s)
Number of Transmitted Packets
Minimum Round Trip Time
shown that a linear topology is taking more time for transmission of packet to its destination node as compared to single and tree topology. Since, numbers of hops between end nodes are more, and more propagation time is required for intermediate nodes to deliver packet to its exact destination. Whereas, Single topology is taking minimum amount of time to deliver packet to its destination. Since, all nodes are connected with a single OpenFlow-enabled switch. Packet delivery will be faster in single topology.
Fig. 9. Maximum round-trip time between nodes for basic OpenFlow topologies.
Lastly, comparisons between basic OpenFlow topologies are done based on Throughput analysis of a network. A network throughput is defined as the amount of data transmitted from source to destination in a given time period, typically measured in bits per second (bps). Analytically it is a ratio of maximum receiver bandwidth to round-trip time between nodes:
“Throughput = maximum receiver bandwidth/round-trip time”
The overall network throughput can be obtained by considering bandwidth utilization and round-trip time as discussed above is calculated and shown graphically in below figures.
“Max throughput = max bandwidth/ min rtt”
&
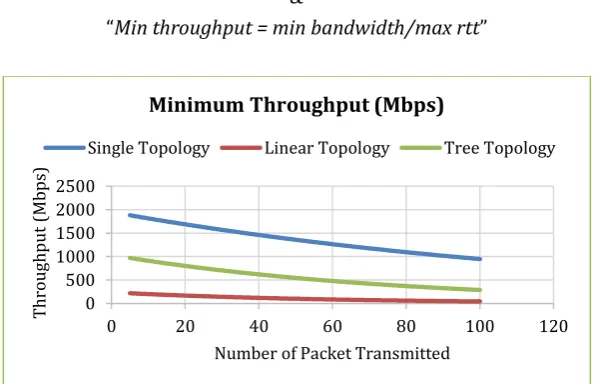
“Min throughput = min bandwidth/max rtt”
Fig. 10. Minimum throughput for basic OpenFlow topologies.
0 1 2 3 4 5 6 7 8
Packets = 5 Packets = 10 Packets = 20 Packets = 30 Packets = 50 Packets = 100
Ti
m
e
(m
s)
Number of Transmitted Packets
Maximum Round Trip Time
Single Linear Tree
0 500 1000 1500 2000 2500
0 20 40 60 80 100 120
T
hrou
gh
pu
t (
Mbps)
Number of Packet Transmitted
Minimum Throughput (Mbps)
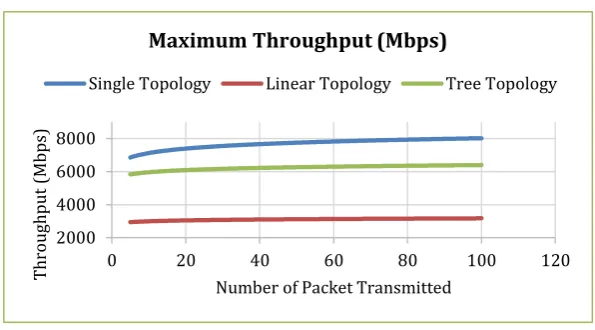
Fig. 11. Maximum throughput for basic OpenFlow topologies.
A minimum and maximum throughput graph with respect to packet transmission rate is shown in Fig. 10 and Fig. 11 respectively. From the obtained graph, it can be said that the throughput of linear topology is very less as compared to other two topologies, this is because the bandwidth utilization is less and the overall round-trip propagation delay between nodes is also more. Whereas, single topology network is having maximum throughput as compared to other two topologies, this is because the single topology is having only one switch and between any two nodes in a network there is only two hops. Thus, in single topology delay is less and throughput is more whereas in linear topology delay is more and throughput is less.
5.
Conclusion
On the basis of performance analysis of the proposed network topologies and the discussion of the results, we can conclude that the performance of single topology is better as compared to other two linear and tree topology with some limitations. If in linear topology the number of hosts in the network will increase then the performance of the network will automatically get reduce. Since, entire load of a network will handled by a single OpenFlow switch, and the flow entries in a switch will be more. If, in case, OpenFlow switch denies service due to some breakdown, than whole network will get destroyed. Also, speed of the flows, bandwidth, throughput, packet dropping probability, and many more physical parameters get affected due to limited hardware constraints.
In linear topology, the overall network performance is improved as compared to single topology on basis of network load. In single topology, the entire network load is handled by a single OpenFlow-enabled switch regardless of number of host machines. In linear topology, the network load is distributed on different switches, and each switch is responsible for handling limited flow entries. All switches should have almost equal number of flow entries, which is controlled by controller. But, a major drawback for this linear topology is that, it occupies more space due to more hardware requirement, and mainly, it is costly to install. Since, number of OpenFlow switch requirement is more, as it depends on number of host machine in a network. Although, speed of the network will increase due to multiple switches and multiple flow-entries, and fast packet processing is accomplished, but more space and cost is required to install due to more hardware requirements. Sometimes, more number of hops also affects overall speed of the data flow in a network. Thus, this will create a controversial situation regarding speed consideration.
A Tree topology is easy to implement by a single command. A complexity of a network is somewhat more than single and linear topology, but the numbers of hops between hosts are all same. And the performance on the basis of speed consideration is improved as compared to linear topology but limited as compared to single topology. Unlike single topology, in tree topology the entire network load is distributed into the
2000 4000 6000 8000
0 20 40 60 80 100 120
T
hrou
gh
pu
t (
Mbps)
Number of Packet Transmitted
Maximum Throughput (Mbps)
switches of the network, which is deficient in single topology network. If the number of hosts increases the overall performance of the single topology network will definitely get reduce, but it is not in the case of tree topology as the load is distributed. Also space requirement for installation and cost configuration is lower than linear topology.
References
[1] Open Networking Foundation (ONF). (April, 2012). Software defined networking: The new norm for networks. White Paper. From https://www.opennetworking.org/images/stories/downloads/openflow /wp-sdn-newnorm.pdf
[2] Shimonishi, H., Takamiya, Y., Chiba, Y., Sugyo, K., Hatano, Y., Sonoda, K., Suzuki, K., Kotani, D., & Akiyoshi, I. (2012). Programmable network using OpenFlow for network researches and experiments.
Proceedings of the Sixth International Conference on Mobile Computing and Ubiquitous Networking (pp.
164-171). Okinawa, Japan.
[3] McKeown, N., Anderson, T., Balakrishnan, H., Parulkar, G., Peterson, L., Rexford, J., Shenker, S., & Turner, J. (2008). OpenFlow: Enabling innovation in campus networks. ACM SIGCOMM Computer Communication
Review, 38(2), 69–74.
[4] ONF. (2013). Home — Open networking foundation. From https://www.opennetworking.org/index.php
[5] Lara, A., Kolasani, A., & Ramamurthy, B. (2014). Network innovation using OpenFlow: A survey. IEEE
Communications Surveys and Tutorials, 16(1), 493–512.
[6] Team, T. M. (2012). Mininet: An Instant Virtual Network on Your Laptop (or Other PC). From http://www.mininet.org
[7] OpenFlow Switch Specification, Version 1.1.0 (Wire Protocol 0x02). (2011). From http://archive.openflow.org/documents/openflow-spec-v1.1.0.pdf
[8] Naous, J., Erickson, D., Covington, G. A., Appenzaller, G., & McKeown, N. (2008). Implementing an OpenFlow switch on the NetFPGA platform. Proceedings of the 4th ACM/IEEE Symposium on
Architectures for Networking and Communication Systems (pp. 1–9). CA, USA.
[9] Bholebawa, I. Z., Jha, R. K., & Dalal, U. D. (August, 2015). Performance analysis of proposed OpenFlow-based network architecture using Mininet. Wireless Personal Communications, 83(17), 1–18. [10]Lantz, B., Heller, B., & McKeown, N. (2010). A network in a laptop: Rapid prototyping for
software-defined networks. Proceedings of the 9th ACM SIGCOMM Workshop on Hot Topics in Networks. Article No. 19. New York, USA.
[11]Jha, R., Kharga, P., Bholebawa, I., Satyarthi, S., Gupta, A., & Kumari, S. (2014). OpenFlow technology: A journey of simulation tools. International Journal of Computer Network and Information Security, 6(11), 49–55.
[12]Iperf–The TCP/UDP bandwidth measurement tool. From http://iperf.fr/
Idris Zoher Bholebawa received his B.E. in ECE from VNSGU, India in 2009. He received
![Fig. 2. Flow table entries for matching fields [8].](https://thumb-us.123doks.com/thumbv2/123dok_us/1313076.1638982/3.595.205.390.271.424/fig-flow-table-entries-matching-fields.webp)