A Comparative Assessment between Visual
Interpretation and Pixel based Approach for Land
Use/Cover Mapping using IRS LISS-III Imagery
Parmod Kumar
Punjab Remote SensingCentre
PAU campus, Ludhiana, Punjab
Raj Setia
Punjab Remote SensingCentre
PAU campus, Ludhiana, Punjab
D. C. Loshali
Punjab Remote SensingCentre
PAU campus, Ludhiana, Punjab
Brijendra Pateriya
Punjab Remote SensingCentre
PAU campus, Ludhiana, Punjab
ABSTRACT
The information about land use /cover information is required for urban planning, eco-systems research and developing short and long term plans for the sustainable use, conservation and development of natural resources. A number of techniques have been used for extracting land use/cover information from satellite imagery. The most commonly used techniques are visual interpretation and pixel based classification (unsupervised and supervised classification). In this study, we compared visual interpretation, unsupervised and supervised classification techniques to extract the land use/cover information from
Resorcesat-2 Linear Imaging Self Scanning Sensor-III (LISS-III)satellite imagery (Indian Remote Sensing (IRS) Satellite with spatial resolution of 23.5 m) on 1:50,000 scale
in the Barnala district of Punjab (India). Ground data was collected from field and accuracy assessments of the three classifications were undertaken. Five land use/cover classes (built-up, agriculture land, forest, wastelands and water bodies) were extracted and the results were compared among these. The overall accuracies showed that visual interpretation (83.6%) performed better results than unsupervised and supervised classification techniques. Between both the pixel based classification techniques, supervised classification (75.5%) was better than unsupervised classification (64.3%). The major variations in accuracy assessment were due to agriculture land and forest extracted using all of the three techniques. These results suggest that visual interpretation technique is better for extracting land use/cover but it takes more time than supervised classification which may be used for getting quick information about land use/cover of an area.
Keywords
Digital classification, Land use/Land Cover, LISS-III, Visual interpretation
1.
INTRODUCTION
Land use and land cover classes represent analytical units, which allow establishing a first quantitative link among human activities, environmental impacts and its geographical (spatial) dimension [1]. The information on land cover is of special value integrating the temporal dimension. Land cover/ land use maps play an important role for making the development plan both in rural and urban sectors, infrastructure planning, impact assessment and environmental hazard zonation etc [2]. As a result of technological advancements, changes of the earth’s surface have become visible by satellite imagery and remote sensing has become the most effective tool for assessing and
monitoring all these transitions [3]. Satellite remote sensing has become a major data source for mapping applications, because of the repetitive data acquisition capabilities, digital format suitability for computer processing and lower cost than those associated with traditional methods [4].
mapping land use/land cover on 1:50,000 scale in the Barnala district of Punjab (India).
2.
STUDY AREA
The study area is a part of South Punjab (Barnala district) and covers an area of 1423 sq km which is 2.83 per cent of total geographical area of the state. It lies between 750 15' 13" and 750 43’ 56” E longitudes, and 300 08' 17" and 300 36' 28" N latitudes, (Figure 1). The climate is sub-tropical and the mean winter temperature is 15.7°C and the mean summer temperature is 33.8°C.
Figure 1: Location of the study area
3.
DATA AND METHODS
Terrain corrected multispectral Resourcesat-2 satellite imagery of winter (Rabi Season) 2012 was used for extracting land cover features in the study area. The imagery was provided as four spectral bands [band-2 (VIS), band-3 (VIS), band-4 (NIR) & band-5 (SWIR) with wavelength ranges from 0.52-0.59, 0.62-0.68, 0.77-0.86 and 1.55-1.7 µm respectively. The imagery was provided as 10 bit integer data georeferenced to UTM projection. The geolocation accuracy of standard ortho-rectified imagery was 23.5 m and swath of 141 km. All the four bands were mosaicked using ERDAS Imagine 2010. The satellite imagery was classified using visual interpretation and pixel based classification (unsupervised and supervised). Visual interpretation was performed by onscreen digitization using ArcGIS 10.1. It was based on variation in color, tone, texture, shape, size, location and association of false color composite which was infrared, red and green bands of the satellite image. For unsupervised classification techniques, Iterative Self-Organizing Data analysis technique (ISODATA) was used. This technique repeatedly performs an entire classification and recalculates statistics with minimum user inputs for locating clusters. For supervised classification, maximum likelihood algorithm was used. This involved the selection of training areas representative of the different land cover classes. A number of training areas were selected to represent each class. The signature (or spectral mean) of the training area was then used to determine to which class the pixels were assigned. The detailed methodology is given in Figure 2.
Resourcesat-2 LISS-III Satellite data
Visual Interpretation Digital interpretation
Supervised classification Unsupervised classification
Ground data for training sets
Ground data & Post field verification &correction
Supervised Classification
4.
ACCURACY ASSESSMENT
Field survey was carried out to evaluate the classification accuracy. For each land cover class, total 55 sample points were collected using Garmin GPS. Accuracy assessments of the three classifications were undertaken using confusion matrices and Kappa statistics.
5.
RESULTS AND DISCUSSION:
The satellite image was classified into five land use/cover classes: agriculture, built up, forest, water bodies and wastelands. Among all these classes, major part of the study area is under agriculture (Table 1). The area under agriculture classified using visual, unsupervised and supervised classification techniques was approximately similar in the three techniques (Table 1).
Table 1: Area (percent) under different classes using the three classification techniques
Landuse Class Visual Interpretation
Unsupervised Classification
Supervised Classification
Built up 6.65 5.29 6.23
Agriculture Land
92.3 92.2 92.7
Forest 0.27 1.41 0.60
Wastelands 0.12 0.11 0.15
Water Bodies 0.70 1.00 0.29
The main confusions were among built up, forest, water bodies and wastelands. These errors affect the spatial representation and also the statistics of area of land use/cover types derived from the classified image. The area under built up classified using visual interpretation (6.65% of total area) and supervised classification (6.23% of total area) was almost similar, but it was significantly lower when extracted using unsupervised classification (5.26% of total area). This was mainly due to outer boundary of built up with vegetation cover (Figure 3) which couldn’t be delineated on 1:50 000 scale in visual interpretation technique, but it was separated in both pixel based digital classification techniques.
Figure 3: A subset of the classified image with built up extracted using (a) visual interpretation, (b) unsupervised classification technique, and (c) supervised
classification technique
The area classified under forest using three techniques was in the order: unsupervised classification (1.41% of total area) > supervised classification (0.60% of total area) > visual interpretation (0.27% of total area). It was observed
that tree clad area (tree cover lying outside the forest but the tree cover along the canals and roads) was discriminated by unsupervised and supervised classification techniques, but not with visual interpretation on 1:50,000 scale (Figure 4).
Figure 4: A subset of the classified image with tree clad area (along with water bodies and canal) extracted using (a) visual interpretation, (b) unsupervised classification
technique, and (c)supervised classification technique
The higher forest area with unsupervised classification than supervised classification was due to mixing of scrub land and forest area in the former technique (Figure5). The spectral signatures of tree clad area were not uniform in the satellite image of the study area which caused dissimilarity in the forest area extracted using supervised and unsupervised techniques.
Figure 5: A subset of the classified image with scrub land extracted using (a) visual interpretation, (b) unsupervised classification technique, and (c) supervised
classification technique
Water bodies represented 0.70% of total area for visual interpretation, 1.00% for unsupervised classification and 0.29% for supervised classification. The difference among different classification techniques is obvious because small water patches like minor distributaries couldn’t be extracted using visual interpretation on 1: 50000 scale (Figures 6 and 7).
Figure 6: A subset of the classified image with water bodies extracted using (a) visual interpretation, (b) unsupervised classification technique, and (c) supervised
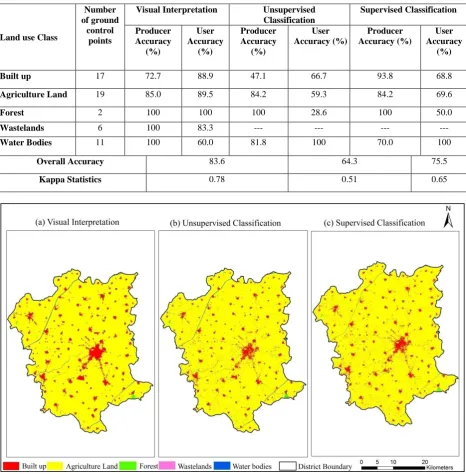
Table 2: Error matrix and the accuracy of visual interpretation, unsupervised and supervised classification techniques of different landuse/land cover classes
Land use Class
Number of ground control
points
Visual Interpretation Unsupervised
Classification
Supervised Classification
Producer Accuracy
(%)
User Accuracy
(%)
Producer Accuracy
(%)
User Accuracy (%)
Producer Accuracy (%)
User Accuracy
(%)
Built up 17 72.7 88.9 47.1 66.7 93.8 68.8
Agriculture Land 19 85.0 89.5 84.2 59.3 84.2 69.6
Forest 2 100 100 100 28.6 100 50.0
Wastelands 6 100 83.3 --- --- --- ---
Water Bodies 11 100 60.0 81.8 100 70.0 100
Overall Accuracy 83.6 64.3 75.5
Kappa Statistics 0.78 0.51 0.65
Figure 7 Landuse/Land cover map of the study area classified using (a) visual Interpretation (b) unsupervised classification technique, and (c) supervised classification technique
However, this problem may be overcome using pixel based classification technique but the training sets for minor tributaries taken in supervised classification had spectral mixing with other land cover features. These training sets were not homogenous throughout the image which resulted a significant difference in water bodies area extracted using both the digital classification techniques.
Although there is no confirmed standard for accuracy
results are useful for making the developmental plans both in rural and urban sectors of the study area, infrastructure planning, impact assessment and environmental hazard zonation. The variation in accuracy assessment of visual and supervised classification was due to agriculture and forest. Though visual interpretation is better than supervised but it is difficult to extract the features with areas lesser than minimum mapping units in visual interpretation but a single pixel is, classified in supervised classification. The lesser number of reference points were one of the major causes of variation in accuracy assessment but further research is required using selection of training area, interpretation approaches and number of reference data for accurately extracting the information about land use/cover of an area.
7.
REFERENCES
[1] Alqurashi, A., F & Kumar, L. (2013). Investigating the use of remote sensing and GIS techniques to detect land use and land cover change: a review. Advances in RemoteSensing, 2, 193-204
[2] Chowdhury, P. K. Roy and Maithani S (2010).
Monitoring growth of built-up areas in indo-gangetic plain using multi-sensor remote sensing data. Journal of Indian Society of Remote Sensing 38 : 291–300
[3] Deer, J. P. (1995). Digital change detection techniques: Civilian and Military Applications, Information Technology Division, Defence Science and Technology Organization, Australia.
[4] Coppin, P., Lambin, E., Inge, J. & Muys, B. (2002). Digital change detection methods in natural ecosystem monitoring: Proceedings of the First International Workshop on Analysis of multi-temporal remote sensing images,Vol. 2, University of Trento, Italy, 13-14 September 2001, eds., Baizzone, L., and Smits, P. World Scientific, N.J.
[5] Foody, G .M. (2002). Status of land cover classification accuracy assessment. Remote Sensing of Environment
80 :185–201
[6] Congalton, R. G. (1991). A review of assessing the accuracy of classifications of remotely sensed data.
Remote Sensing of Environment, 37, 35-46
[7] Puig, J., Hyman, G., Bolaños, S., 2002. Digital classification vs. VI: a case study in humid tropical forests of The Peruvian Amazon. In: Proceedings of the 29th International Symposium on Remote Sensing of Environment, Bueno Aires, Argentina, Vol. XXIX, pp. 8-12
[8] Niemeyer, I., & Canty, M. J., (2003), Pixel-Based and Object-Oriented Change Detection Analysis Using High Resolution Imagery. Proceedings of 25th Symposium on Safeguards and Nuclear Material Managment, 13-15 May, Stockholm.
[9] Oruc, M., Marangoz, A. M., & Buyuksalih, G., (2004), Comparison of pixel-based and object-oriented classification approaches using Landsat-7 ETM spectral bands. Proceedings of ISPRS Conference, 19-23 July, Istanbul
[10]Whiteside, T and Ahmad, W (2005). A comparison of object-oriented and pixel-based classification methods for mapping land cover in northern Australia.
Proceedings of SSC2005 Spatial intelligence,
innovation and praxis: The national biennial Conference of the Spatial Sciences Institute, Melbourne: Spatial Sciences Institute. ISBN 0-9581366-2-9
[11]Wang, Q., Chen, J., Tian, Y. (2008). Remote sensing image interpretation study serving urban planning based on GIS. In: The International Archives of the Photogrammetry, Remote Sensing and Spatial Information Sciences, Beijing, China,Vol. XXXVII, Part B4, pp. 453-456.
[12]Bahadur, K.C.K. (2009) Improving Landsat and IRS image classification: evaluation of unsupervised and supervised classification through band ratios and DEM in a mountainous landscape in Nepal. Remote Sensing