Original Research Article
Period prevalence of hypertension and risk factors
in an urban slum of Maharashtra
Ajinkya J. Niwal
1, Muralidhar P. Tambe
2, S. P. Rao
3, Malangori A. Parande
2*
INTRODUCTION
Noncommuincable diseases (NCDs) are the leading causes of death globally, almost two-thirds of all deaths are due to NCDs.1 Cardiovascular diseases affect nearly 1 billion people worldwide, accounting for 17 million deaths. Out of them, worldwide, high blood pressure is the leading single risk factor globally accounting for an
estimated 9.4 million deaths and 7% of global DALYs (Disability-Adjusted Life year) in 2010, thus attributing to about 18% of the total 52.8 million deaths during that year.2 One in three adults worldwide has high blood pressure. The proportion increases with age, from 1 in 10 people in their 20s and 30s to 5 in 10 people in their 50s.3 Behind the statistics, it is a silent killer that can affect anyone; people often have no symptoms, and many are
ABSTRACT
Background: One in three adults worldwide has high blood pressure and proportion increases with age. Detecting high blood pressure is easy. Hence a study for prevalence of hypertension was conducted in an urban slum of Pune, Maharashtra.
Methods: The study was conducted in an urban slum field practice area exclusively under the community medicine department of a tertiary care hospital during the period of February 2014- July 2014. Overall 1043 people fulfilling the inclusion and exclusion criteria were interviewed, and anthropometric measurements were taken, followed by blood pressure readings and awareness of own hypertensive status. Data was compiled, edited, classified, and analyzed. The prevalence of hypertensive patients was obtained and physical and behavioral risk factors were analyzed for association.
Results: The prevalence of hypertension in adults above 18 years of age was 25.6% with mean age of hypertensive patients was 48.58±15.75 yrs. Hypertension was significantly associated with age, habit of adding extra salt to cooked food, family history, BMI and consumption of smokeless form of tobacco among the study participants. Hypertension was not significantly associated with gender and religion of the participants. Of the 267 hypertensives, 40.82% were aware of their hypertensive status and amongst those aware 61.46% were on anti-hypertensives.
Conclusions: Hypertension is a public health problem affecting slum population as well. It is significantly associated with risk factors, which are modifiable. The awareness of hypertensive status is low, the under treatment is lower. The population in slum, with its poor literacy, low awareness and income levels provides an opportunity to make an intervention necessary as well as challenging.
Keywords: Hypertension, Point prevalence, Risk factors, Urban slum
1
Central Government Health Scheme, Mumbai, Maharashtra, India
2
Department of Preventive and Social Medicine, B.J. Govt. Medical College, Pune, Maharashtra, India
3
Narayana Medical College and Hospital, Chintareddypalem, Nellore, Andhra Pradesh, India
Received: 04 May 2019 Revised: 15 June 2019 Accepted: 18 June 2019
*Correspondence: Dr. Malangori A. Parande,
E-mail: [email protected]
Copyright: © the author(s), publisher and licensee Medip Academy. This is an open-access article distributed under the terms of the Creative Commons Attribution Non-Commercial License, which permits unrestricted non-commercial use, distribution, and reproduction in any medium, provided the original work is properly cited.
not even aware of their high BP and the associated health risks.4 It increases the risk of heart attacks, strokes, kidney failure and other associated comorbidity.3 Hypertension disproportionately affects the low and middle-income countries where health systems are weak. Pooled epidemiological studies show the average prevalence of hypertension in India is 25% in Urban and 10% in rural population. Hypertension is a significant public health problem in urban and rural areas of India.5 Hypertension is common among Indian Population (Reported Prevalence ranges from 3-40% among adults) and the diagnosis is simple to detect (non-invasive sphygmomanometer measurement) and confirm.5 More important is that it is satisfactorily controlled with effective medications and behavior change. However, the recent population surveys confirmed that the proportion of hypertensives that are treated and controlled is less than 30%.7,8
Because of the changing life styles, the environment, industrialization, and urbanization the prevalence of hypertension is increasing constantly. Field-based studies on the prevalence of hypertension are still scarce in urban slums. With this view, a study was planned to be conducted in an urban slum exclusively under the field practice area of a tertiary care hospital in Pune to assess the prevalence of hypertension and associated physical and behavioral factors, assess the awareness of being hypertensive amongst those suffering from hypertension.
METHODS
This was an observational cross-sectional study conducted in an urban slum (Mangalwar Peth) the field practice area of B. J. Government Medical College and SGH, Pune from February 2014- July 2014(6 months).
Inclusion criteria
All those residing in the area, >18 years of age, of both sex and consenting to participate in study.
Exclusion criteria
Pregnant females not willing to participate and not giving consent.
The population served by the urban health setting was 7623. This was divided into 5 blocks with around 1500 population in each block. A block was randomly selected from amongst this and selected for the study. Total population of study block was 1568. Total population above 18 years of age which was to be surveyed was 1110; 67 (6%) who did not consent to participate in the study, were excluded from the study, 1043 (93.96%) individuals above the age of 18 years of age participated is the study.
Ethical clearance was obtained from the institutional ethics committee prior to the start of the study. The data was collected by personally visiting each household in a randomly selected block in the study area. A household visit contact was considered only after visiting the house personally and knocking on the door. Wherever there was no one at home, neighbor was requested to notify the occupants of that household on their return. The locked houses were revisited on two separate days at different time due to the working nature of the residents in the slum. A pre-designed pre-tested questionnaire which includes socio-demographic variables like age, sex, socioeconomic status, occupation marital status and other variables like BP, BMI, Hip circumference, waist circumference, salt intake, addiction was used for data collection. The physical examination was undertaken at the participant’s house after the interview was completed.
Blood pressure (BP) was measured by using a mercury sphygmomanometer by auscultation method in sitting position. Three readings were taken by a single observer and the average of the last two readings was considered as the final blood pressure reading. Blood pressure was measured with diamond mercury sphygmomanometer. Three-minute rest was given between two readings. Three readings were noted and an average of last two readings was taken. Those with high blood pressure readings for the first time were sent to the tertiary care center for confirmation and management. The hypertension was defined according to the seventh report of the Joint National committee (JNC VII) on prevention, detection, evaluation and treatment of high blood pressure i.e. as systolic BP more than or equal to 140 mm of Hg or diastolic blood pressure more than or equal to 90 mm of Hg or those individuals currently taking antihypertensive treatment.9
Weight was measured using a digital weighing scale. Reading was noted in kilograms to the nearest 100 gm. Privacy was ensured for the participant. Measurement of waist circumference, hip circumference (at maximum circumference of buttocks) was done over light clothing to the nearest 0.1 cm.
Statistical analysis
Microsoft excel was used for data entry. Chi-square test has been used to test the significance of proportion of hypertension in association with various socio demographic factors. The odds ratio along with confidence intervals has been used to find the strength of relationship of various factors associated between hypertension. Statistical software namely epi-info version 7 was used for analysis of the data.
RESULTS
Figure 1: Prevalence of hypertension.
Table 1: Age wise distribution of hypertension.
Age (in years)
Hypertensive n=267
Normotensive n=776
Odds ratio (95% Cl )
N (%) N (%)
18- 25 14 (5.2) 245 (31.6) 1(Ref) 26-34 36 (13.5) 210 (27.1) 3(1.57-5.71)
35-44 42 (15.7) 158 (20.4) 4.65 (2.46-8.96)
45-54 58 (21.7) 103 (13.3) 9.85 (5.26-18.45)
55-64 54 (20.2) 36 (4.6) 26.25 (13.24-52.04)
≥65 63 (23.6) 24 (3.1) 45.93 (22.47-93.89)
2
(linear trend) = 185.9, p<0.001.
The prevalence of hypertension significantly increased with the increase in age with p<0.001 (Table 1, Figure 2). The lowest prevalence was observed in <25 years (5.2%)
of age which increased in those above 65 years of age with a dip in age group 55-64. However it was observed that the measure of risk for hypertension increased with age.
Figure 2: Relationship between hypertension and age.
Table 2: Descriptive statistics of age in Study population.
Para-meter
Hypertensive (n=267) Mean±SD
Normotensive (n=776) Mean± SD
Z value
P value
Age (in
years) 48.5±15.7 34.6± 13.2 13.9 <0.001
Mean age of the hypertensive participants was 48.58±15.76 years, while the mean age of normotensive was 34.67±13.22 and there was a significant difference between mean age of hypertensive and normotensive group (Table 2).
Table 1: Risk factors associated with hypertension (Univariate analysis).
Variables Hypertensive
n=267
Normotensive n=776
Odds ratio
(95% Cl ) P value
N (%) N (%)
Gender Males 95 (26.6) 262 (73.4) 1.08 (0.80-1.45) >0.05
Females 172 (25.1) 514 (74.9) 1 (Ref)
Religion Hindu 225 (25.7) 649 (74.3) 1 (Ref) >0.05
Muslim and others 42 (24.9) 127 (75.1) 1.04 (0.72-1.54)
Socio economic class
Lower 137 (35.9) 245 (64.1) 1 (Ref)
<0.001 Upper lower 98 (19.6) 401 (80.4) 0.43 (0.32-0.59)
Lower middle 26 (21.3) 96 (78.7) 0.48 (0.28-0.79) Upper middle 6 (15.0) 34 (85.0) 0.31 (0.11-0.73)
Diet Mixed 166 (25.3) 489 (74.7) 0.93 (0.70-1.24) >0.05
Veg 101 (26.0) 287 (74.0) 1 (Ref)
Consumption of table salt.
Yes 49 (41.5) 69 (58.5) 2.30 (1.54-3.42)
<0.05
No 218 (23.6) 707 (76.4) 1 (Ref)
Consumption of salt (g/day/person)
1-5 56 (20.0) 223 (80.0) 1.51 (1.08-2.12)
<0.05
>5 211 (27.6) 553 (72.4) 1 (Ref)
Physical Activity
Heavy 28 (15.0) 158 (85.0) 1 (Ref)
<0.05
Moderate 192 (25.6) 557 (74.4) 1.94 (1.26-3.04)
Sedentary 47 (43.51) 61 (56.48) 4.39 (2.50-7.59)
Family history of hypertension
No history 190 (23.2) 626 (76.8) 1 (Ref)
<0.001 Uniparental 58 (29.6) 138 (70.4) 1.38 (0.97-1.95)
Biparental 19 (61.3) 12 (38.7) 5.21 (2.48-10.94) 25.6%
74.4%
Hyprtensive Normotensive
0 5 10 15 20 25
< 25 26-34 35-44 45-54 55-64 > 65
Variables Hypertensive n=267
Normotensive n=776
Odds ratio
(95% Cl ) P value
N (%) N (%)
BMI (kg/m2)
Underweight 16 (10.8) 131 (89.2) 0.64 (0.34-1.15)
<0.001
Normal 55 (15.9) 291 (84.1) 1 (Ref)
Overweight 47 (27.2) 126 (72.8) 1.97 (1.26-3.02)
Obese 149 (39.5) 228 (60.5) 3.45 (2.42-5.02)
Waist to hip ratio Increased 169 (31.2) 372 (68.8) 1.87 (1.40-2.49) <0.001
Normal 98 (19.5) 404 (80.5) 1 (Ref)
Smoking Smoker 22 (40.0) 33 (60.0) 2.02 (1.15-3.53) <0.05
Non-smoker 245 (24.8) 743 (75.2) 1 (Ref)
Smokeless form of tobacco
Yes 128 (29.4) 307 (70.6) 1.40 (1.06-1.86)
<0.05
No 139 (22.9) 469 (77.1) 1 (Ref)
Alcohol consumption Yes 31 (34.4) 59 (65.6) 1.59 (1.00-2.52) <0.05
No 236 (24.7) 717 (75.3) 1 (Ref)
Alcohol consumption in males (n=357)
Yes 29 (39.7) 44 (60.3) 2.17 (1.26-3.71)
<0.05
No 66 (23.2) 218 (76.8) 1 (Ref)
Table 3 illustrates the univariate analysis of some of the risk factors with hypertension. Considering Socio Economic class, the risk of hypertension decreased with the increase in Socio economic class from lower (OR=1) to upper middle class (OR=0.31). The individuals consuming table salt were 2.30(1.54-3.42) times more risk of getting hypertension than who were not consuming table salt. There was a higher risk of hypertension in those consuming >5g/head/day of salt as compared to those who consumed <5g/head/d. Significant association could be observed between Physical activity and hypertension. Higher risk was observed amongst those with sedentary (OR=4.39) physical activity than those with moderate (OR=1.94) than heavy physical activity.
Among uniparental history of hypertension, the risk of getting hypertension was 1.38(0.97-1.95) while when biparental history of hypertension is there, the risk was 5.21(2.48-10.94). There was a significant association between family history and hypertension.
Figure 3: Prevalence of hypertension with that of BMI.
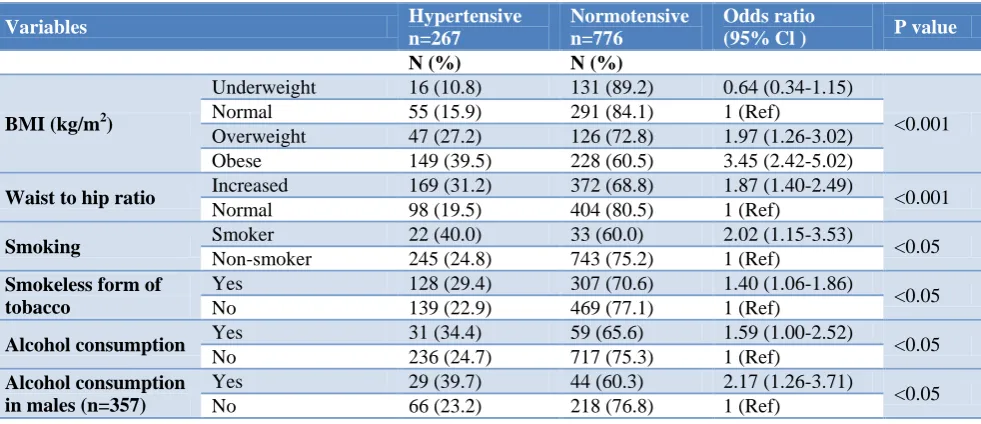
Considering the normal category of BMI as a baseline, there was a significant association between the BMI and hypertension. Overweight (OR=1.974) and obese (OR=3.458) were at higher risk of hypertension than those with normal BMI (Figure 3). There was an increased risk of hypertension among those with increased waist to hip ratio (>0.90 for males, >0.85 for female) as compared to those with normal waists to hip ratio (≤0.90 males, ≤0.85 for females).
Considering smoking as a risk factor, among the 55 participants who gave a history of smoking 22(40%) were found to be hypertensive. In contrast to this hypertension was present in 245 (24.8%) of participants who did not smoke. There was a significant association between smoking and hypertension. Those who smoked were 2.02 times more risk of hypertension.
Out of the total 1043 participants, 435 consumed tobacco in any of the smokeless form. Hypertension was present in 128 (29.4%) of those consuming smokeless form of tobacco. There is a high risk of hypertension among those consuming smokeless form of tobacco (OR=1.407)
The distribution of hypertension according to the alcohol consumption was also studied. Out of the 90 who consumed alcohol, hypertension was present in 31 (34.4%) while it was present in 236 (24.76%) out of 953 who did not consume alcohol. Those who had consumed alcohol (OR= 1.596) are at higher risk of hypertension as compared to those who never consumed alcohol.
Out of 357 males, 73 (20.44%) consumed alcohol. 29 (39.7%) out of 73 had hypertensive, in contrast to 66 (23.23%) out of 284 who abstained from drinking. There is a significant association between alcohol consumption and hypertension in males. Increased risk of hypertension (OR=2.177) is present among those who consumed alcohol.
10.88 15.89
27.16 39.52
0 20 40 60
Underweight(n1=147) Normal(n2=346) Overweight(n3=173) Obese(n4=377)
Hypertension was not significantly associated with Gender, religion, type of diet consumed.
Table 4: Risk factors associated with hypertension (multivariate analysis).
Variables Odds ratio
(95% Cl ) P value
Age 1.84(1.62-2.10) <0.0001
Socio economic class 0.90(0.70-1.15) =0.40 Consumption of
table salt. 2.65(1.57-4.50) <0.0001 Consumption of salt
(g/day/person) 1.21(0.81-1.83) =0.40 Physical Activity 1.41(0.98-2.04) =0.06 Family history of
hypertension 1.37(0.99-1.91) <0.05 BMI(kg/m2) 1.76(1.48-2.10) <0.0001 Waist to hip ratio 1.34(0.93-1.95) =0.10 Smoking 1.69(0.79-3.63) =0.17 Smokeless form of
tobacco 1.70(1.16-2.86) <0.0001 Alcohol
consumption 1.32(0.69-2.51) =0.38
The factors associated with hypertension found significant on univariate analysis were subjected to Logistic regression analysis (Multivariate analysis) and presented in Table 4. It was found that age, consumption of table salt, family history of hypertension, BMI and consumption of smokeless form of tobacco were significantly associated with hypertension ; while other factors like socioeconomic status, >5 gm/person/ per day consumption of salt, smoking, type of physical activity, waist to hip ratio and alcohol consumption were not significant on multivariate analysis
In this study, the awareness about hypertension was present in 109 (40.82%) out of the 267 hypertensives. Illiterates made up 98 (36.70%) out of 267 of the hypertensives. Out of these 98 illiterates, 25(25.51%) were aware of their hypertensive status. Out of those who were aware, 67 (61.46%) of cases were on anti-hypertensive medications.
DISCUSSION
Globally the prevalence of hypertension (above 25 yrs. age) ranges from 32.6-41% in North America, Australia, China and India.10 The overall prevalence of hypertension in South East Asian region (above 25 years age) is approximately 35.2% (30.9-35.2) of the adult population.
11
The published report of integrated disease surveillance project under Ministry of health and family welfare carried out in Maharashtra in the age group 15-64 years observed the prevalence of hypertension at 20.1% with prevalence in the urban area to be 18.8%.12
In this study, the prevalence of Hypertension was found out to be 25.6% above 18 years of age. In this study ≥65
yrs of age group contributed maximum number 63 (23.6%) of hypertensive patients. This higher prevalence may be due to the inclusion of all individuals over 18 yrs. of age while the study conducted by IDSP included only 15-64 age group people.This prevalence was similar to a study conducted for age group >18 yrs. of age urban slum of Mumbai by Dhikale et al which found the prevalence of hypertension to be 23.59%.13 In a multicentric study conducted in 15662 populations from 8 states in India by Joshi et al found the prevalence of hypertension to be 46%.14 Similar results have been reported by other studies conducted in urban slums of different cities in India.15-16 There is a difference in the prevalence among various studies conducted all around the world and also in India. This may be due to the different age group in which the study was conducted, urban or rural settings.
Age is one of an important non-modifiable risk factor for hypertension and as the age increases there is an increase in the blood pressure. Age probably represents an accumulation of environmental influences and the effects of genetically programmed senescence in body systems. Age indicates the cumulative outcome of the lifelong host and environment interactions.17 In this study, it is observed that as the age increases there is an increase in hypertension prevalence, with a small dip in age group 55-64 and there is a significant association in the increase of age and hypertension. A report published by the World health organization in 2013 also mentions the increasing prevalence of hypertension with age.3 The published report of integrated disease surveillance project carried out in Maharashtra in the age group 15-64 years observed the prevalence of it to increase with age.12 Other studies support these findings.16,18-19 The prevalence of hypertension in this study was slightly higher in males (26.61%) as compared to females (25.07%). However, this difference was not statistically significant which is in coherence with Kashyap et al.18
Maximum number of participants in this community belonged to the upper lower class, followed by the lower class of socioeconomic status. There was a significant association between socioeconomic status and hypertension, however, more risk was observed in the lower socio-economic class as compared to the higher socioeconomic group. In contrast to the findings of this study, other studies conducted in India found a significant association between socioeconomic status and hypertension with more prevalence in the higher socio-economic groups. 20-21 Higher risk of hypertension in the lower socio-economic class in this study may be due to the fact that majority of the participants belonged to the lower socioeconomic class.
consumed <5 g/day of salt. Studies conducted in Vijayawada, Belgaum, Delhi and Surat strongly support these findings. 16,19,21,22 Public health measures should be directed toward increasing public awareness of the pathophysiological effects of excessive usage of dietary salt in the development of hypertension. The effects of a high-salt diet are related to the function of the renin-angiotensin system, which is normally suppressed by a high-salt diet. Endothelial dysfunction probably plays an important role in the influence of high sodium intake on blood pressure, although the exact mechanisms remain elusive.
It was observed that physical activity and hypertension were significantly associated (p<0.05). Also, an increased risk of hypertension (OR=4.39) is seen among those with sedentary activity as compared to those having heavy physical activity (OR=1). Rujul et al in a study in the urban area of Surat found a significant association between physical activity and hypertension.22 A study by Gore et al found sedentary activity in 84.8% of the participants in a study in an urban area of Bangalore.24 Physical inactivity is an important modifiable risk factor in the development of hypertension. The reduction in blood pressure with physical activity is thought to be due to attenuation in peripheral vascular resistance, which may be due to neurohormonal and structural responses with reductions in sympathetic nerve activity and an increase in arterial lumen diameters, respectively. In this study, a uniparental history of hypertension had 29.59% of hypertensives with OR=1.39; it increased to 61.29% in those with a biparental history of hypertension with OR=5.22.Similar results were obtained from studies done by others.13,21 The hereditary nature of hypertension is well established by numerous family studies demonstrating associations of blood pressure among siblings and between parents and children. Individuals with a FH of hypertension form an easily identifiable group who may benefit from targeted interventions. There was a significant association between BMI and hypertension in our study (p<0.001). An increased risk is seen in those with obesity (OR=3.458) and overweight (OR=1.974) as compared to those with normal BMI. Those with underweight (OR=0.646) were having less risk as compared to the normal BMI. Similar finding was found by Srikant et al in Bangalore.23 Dhikale et al also found a significant association between BMI and hypertension in an urban slum of Mumbai.13 Similarly central obesity i.e. increased waist to hip ratio was significantly associated with hypertension (OR=1.873). Panesar et al found the significant association between the increased waist to hip ratio (OR=3.076).21 Yadav et al observed waist to hip ratio to be an independent risk factor for hypertension.20 Individuals with obesity have an increase in fatty tissue that increases their vascular resistance and in turn increases the work the heart has to do to pump blood throughout the body which results in hypertension. The published report of integrated disease surveillance project under Ministry of health and family welfare carried out in Maharashtra in the age group 15-64
years observed the percentage of smokers in an urban area in males and females to be 15.1% and 2.3% respectively. In our study 95 (5.27%) out of 1043 subjects were smokers. Percentage of smokers in males and females was 14.29% and 0.6% respectively. Among females, none of them were current smokers. 30 (54.55%) out of 55 male smokers were current smokers. The percentage of current smokers in our study was higher as compared to IDSP study for males. However, it was lower for females.
This lower prevalence among the females may be due to prevailing socio-cultural customs, traditions and practices prevalent in our Indian society. Cigarette smoking by women is considered as a taboo that may be one of the causes of females not revealing the current smoking status. There was a significant association between smoking and hypertension (OR= 2.023).
Venkatraman et al in a study in South India found a direct relation between smoking & hypertension. 25 Similar findings have come up by other authors. 13,21 Cigarette smoking acutely exerts a hypertensive effect, mainly through the stimulation of the sympathetic nervous system. Smoking, affecting arterial stiffness and wave reflection might have greater detrimental effect on central blood pressure, which is more closely related to target organ damage than brachial blood pressure. In a report, carried out in Maharashtra observed smokeless form of tobacco consumption was 12.3% in females and 31.5% in males.12 A smokeless form of tobacco consists of Pan, gutkha, tobacco chewing, snuff, mishri. In this study 435 (41.70%) consumed tobacco in a smokeless form. The percentage of females and males consuming a smokeless form of tobacco was observed to be 30.2% and 49.8%. The predominant form of smokeless form of tobacco consumption was that of mishri (roasted tobacco). Out of 229 consuming mishri 195 (85.15%) were females. The percentage of females consuming a smokeless form of tobacco is higher than other studies.13,21 A Higher percentage of males consuming a smokeless form of tobacco may be due to habit to consume the smokeless form at the workplace. In the present study, the study population consisted all those above 18 years. It was observed that as the age group increased the prevalence of consuming tobacco increased. The proportion of participants above 65 years of age were 87 (8.74%) out of 1043 in our study. 44 (50.57%) out of these 87 were consuming tobacco. This could be one reason for an overall increase in the percentage of smokeless consumption of tobacco as compared to other studies.13,21 There was a significant association between consumption of smokeless form of tobacco and hypertension.
studies on account of the cultural prohibitions on alcohol. None of the Muslim participants (n=157) had consumed alcohol in their lifetime. This may have decreased the percentage of alcohol users. There was a significant association between alcohol and hypertension (p<0.05). In other studies, similar observations were there.13,21 Regarding alcohol, alcohol intake is associated with an increased risk of high blood pressure. Blood pressure returns to normal with abstinence suggests that alcohol-induced elevations may not be fixed, and do not necessarily lead to sustained blood pressure elevation.
Hypertension was not significantly associated with gender & religion of the participants.
Awareness about hypertension
In our study, the awareness about hypertension was present in 109 (40.82%) out of the 267 hypertensives. Illiterates made up 36.70% of the hypertensives. Out of these, 25 (25.51%) were aware of their hypertensive status. Out of those who were aware, 67 (61.46%) of cases were on anti-hypertensive medications. The awareness is similar to those in the slum area of Mumbai. It is lower than that observed in an urban slum, Delhi.13,21 This significant proportion of illiterates could be one of the reasons for the observed lower figure of awareness in our study about hypertension as compared to the other studies.20,23Report published by WHO, south-east Asia ‘Regional Health Forum’ has observed the awareness of hypertension in India to range from 11.4-51.8%.26
CONCLUSION
Hypertension is a public health problem affecting slum population as well.
In this study, the prevalence of hypertension in adults above 18 years age was 25.6%. Hypertension was significantly associated with age, the habit of adding extra salt to cooked food, family history, BMI and consumption of smokeless form of tobacco. among the study participants. It is significantly associated with risk factors, which are modifiable. The awareness of hypertensive status is low, the under treatment is lower. The population in slum, with its poor literacy, low awareness & income levels provides an opportunity to make an intervention necessary as well as challenging.
ACKNOWLEDGEMENTS
I would like to thank colleagues, seniors of my department and people from the study area for helping me and guiding me throughout the end.
Funding: No funding sources Conflict of interest: None declared
Ethical approval: The study was approved by the Institutional Ethics Committee
REFERENCES
1. Mote BN. A regional epidemiology of India's "NCD's risk factors" focusing particularly on Maharashtra: A call for "Health promotion" once again. Int J Med Public Health. 2016;6:26-30. 2. WHO. A global brief on Hyper - tension World
Health Day, 2013. Available at: http://www.who. int/cardiovascular_diseases/publications/global_brie f_hypertension/en. Accessed 21 November 2015. 3. WHO. WHO methods and data sources for global
burden of disease estimates 2000- 2011,2013. Available at: http://www.who.int/healthinfo/ statistics/GlobalDALYmethods_2000_2011.pdf?ua =1. Accessed 23 November 2015.
4. Tambare SN, Parande MA. Awareness and sociodemographic factors of pre-hypertension among adult cases attending rural health training center of a medical college. Int J Med Sci Public Health. 2019;8(5):340-6.
5. Todkar SS, Gujarathi VV, Tapare VS. Period Prevalence and Sociodemographic Factors of Hypertension in Rural Maharashtra: A Cross- Sectional Study. Indian J Community Med. 2009;34(3):183-7.
6. Gupta R, Gupta VP. Hypertension epidemiology in India: Lessons from Jaipur heart watch. Curr Sci. 2009;97(3):349–55.
7. Hense HW, Maziak W, Heidrich J. Why is blood pressure control unsatisfactory—or is it? Nephrol Dial Transpl. 2002;17:1547–50.
8. Mcmanus RJ, Mant J, Mcmanus RJ, Mant J. Community pharmacies for detection and control of hypertension. J Hum Hypertens. 2001;15(10):509– 10.
JNC VII Express: Prevention, detection, evaluation and treatment of high blood pressure. Available at: http://www.nhlbi.nih.gov/guidelines/hypertension/e xpress.pdf; 2003. Accessed 15 November 2010. 9. WHO, World Heart Federation W stroke F. Global
atlas on cardiovascular disease prevention and control. World Heal Organ. 2011;2–14. Available at:http://www.whqlibdoc.who.int/publications/2011/ 9789241564373_eng.pdf. Accessed 2 December 2014.
10. World Health Organization. WHO. Adherence to long-term therapies: evidence for action. 2003. Available at: http://apps.who.int/medicinedocs/ en/d/Js4883e/ Accessed 2 December 2014.
11. Risk ND, Survey F. Integrated Disease Surveillance Project. Training. 2004. 2004-2004.
12. Dhikale PT, Solanki MJ. SRBLS. A Study of Epidemiology of Hypertension in an Urban Slum Community of Mumbai. Biol Med (Aligarh). 2013;3(3).
14. Gore Chaitali ASM. A Study of Hypertension in an urban Slum in Bangalore, India. Int J Med Appl Sci. 2015;4(2):78–83.
15. Chinnamma D, Pitta M, R NR. An Epidemiological Study of Hypertension Among Individuals Aged 20 Years and Above in Urban Slum, Ranigari Thota, Vijayawada City. J Evol Med Dent Sci. 2015;04(13):2180–5.
16. Park K. Textbook of Preventive and Social medicine. 23rd ed. Jabalpur: Bhanot; 2015: 372-377.
17. Kashyap V, Kumar C, Haider S, Singh SB, Sagar V. Prevalence of Hypertension and Its Association with Selected Socio-Demographic. 2015;14(4):2279– 861.
18. Das OP, Vijaya A, Ashwini B. Narasannavar RKS. Prevalence of Hypertension among Adults Residing In Urban Slums of Ramnagar, Belgaum City-A Cross-Sectional Study. IOSR J Dent Med Sci 2014;13(5):102–4.
19. Yadav S, Boddula R, Genitta G, Bhatia V, Bansal B, Kongara S, et al. Prevalence & risk factors of pre-hypertension & pre-hypertension in an affluent north Indian population. Indian J Med Res. 2008;128(6):712–20.
20. Panesar S, Chaturvedi S, Saini NKRA. Prevalence and predictors of hypertension among residents aged 20-59 years of a slum-resettlement colony in Delhi, India. WHO South-East Asia J Public Heal. 2013;2(2):83.
21. Rujul D, Parth D, Mehul M, Mihir R, Desai R. Prevalence and Correlates of Hypertension in the Slum Population of Surat City. Natl J Med Res. 2012;2(3):381–5.
22. Gore Chaitali A SM. A Study of Hypertension in an urban Slum in Bangalore, India. Int J Med Appl Sci. 2015;4(2):78–83.
23. Srikanth J, Kulkarni S. Hypertension in Elderly: prevalence & health care seeking pattern in an urban slum of Bangalore city. Int J Recent Sci Res. 2015;6(3):2952–7.
24. Venkataraman R, Satish Kumar BP, Kumaraswamy M, Singh R, Pandey M, Tripathi P, et al. Smoking, alcohol and hypertension. Int J Pharm Pharm Sci. 2013;5(4):28–32.
25. World Health Organization. Regional Health Forum WHO South-East Asia Journal of Public Health. New Delhi, ND; 2013. Available at: http://www.searo.who.int/publications/journals/regi onal_health_forum/en. Accessed on 20 November 2015.