R E S E A R C H
Open Access
Sparse estimation for structural variability
Raghavendra Hosur
1,3, Rohit Singh
1and Bonnie Berger
1,2*Abstract
Background:Proteins are dynamic molecules that exhibit a wide range of motions; often these conformational changes are important for protein function. Determining biologically relevant conformational changes, or true variability, efficiently is challenging due to the noise present in structure data.
Results:In this paper we present a novel approach to elucidate conformational variability in structures solved using X-ray crystallography. We first infer an ensemble to represent the experimental data and then formulate the identification of truly variable members of the ensemble (as opposed to those that vary only due to noise) as a sparse estimation problem. Our results indicate that the algorithm is able to accurately distinguish genuine conformational changes from variability due to noise. We validate our predictions for structures in the Protein Data Bank by comparing with NMR experiments, as well as on synthetic data. In addition to improved performance over existing methods, the algorithm is robust to the levels of noise present in real data. In the case of Human
Ubiquitin-conjugating enzyme Ubc9, variability identified by the algorithm corresponds to functionally important residues implicated by mutagenesis experiments. Our algorithm is also general enough to be integrated into state-of-the-art software tools for structure-inference.
Introduction
A central tenet of molecular biology is that a protein’s three-dimensional (3D) structure is crucial to its func-tion. Indeed the structural genomics initiative is produ-cing an ever increasing number of structures at high resolution, providing accurate coordinates for each atom in the structure [1]. A protein’s structure, however, is rarely static. Proteins are dynamic molecules, capable of exhibiting a wide range of motions and conformational variability [2,3]. Such conformational changes are impor-tant in biological functions such as enzymatic catalysis, cellular transport, and signaling [4,5]. It has been postu-lated that even subtle conformational changes may have important functional consequences [6].
A multi-conformer model, or ensemble, attempts to model variability by explaining the data using an ensem-ble of conformers, rather than just one conformer. Indeed, conformational variability in a protein might be present even in a single experiment, where the observed data is an average over multiple conformations [7,8]. Multi-conformer approaches have long been the norm
when modeling NMR data. It has been suggested that, for an accurate representation of the physical heteroge-neity in a protein, such multiple-conformer models also be used to explain X-ray crystallography data [8-10].
An open problem– and the focus of this paper– is
understanding the nature of conformational variability implied by experimental data. The key challenge here is to distinguish variability resulting due to noise in experi-mental data and uncertainty in structure determination techniques from functionally relevant physical motion [9,11,12]. The problem is particularly difficult to solve with single-conformer approaches, given their limited ability to model the data. Indeed, this issue has been a driving force in the efforts toward ensemble approaches [8]. Even with the current ensemble approaches, it is difficult to disentangle a protein’s physical motion (e.g. hinge or loop motions) from other kinds of protein motion (e.g., vibrational motion). The key problem is that limited sampling (i.e. number of conformations) and multiplicity of the problem make for weak statistical estimates [8,10,13]. While a growing number of tools address the problem of using ensembles to implicitly model conformational variability [7,10,12,14,15], they generally do not distinguish between variability due to noise vs. physical motion.
* Correspondence: [email protected]
1
Computer Science and Artificial Intelligence Laboratory, MIT, Cambridge, MA, USA
Full list of author information is available at the end of the article
There have been some attempts to analyze structural variability, but using pairs of structures rather than ensembles. Conventional parameters such as torsional angle differences, temperature factors and root-mean-squared-distance (RMSD) values have been used to identify flexible regions. But they combine estimation noise and true variability into a single quantity; thus, they are of limited usefulness under noisy data (e.g., for low-to-medium resolution structures) (see Related Work, [11]). More importantly, conformational variabil-ity is best described over a population (i.e., ensemble) of conformations; pairwise comparison between structures implies such limited sampling of the conformational space that it may be unreliable for all but the least noisy datasets.
In this paper, we take a different approach to analyz-ing variability. Our approach is inspired by recent devel-opments in regression-based predictive models in machine learning. The basic intuition behind the approach is to construct an ensemble of conformers that explain the experimental data and then use sparse estimation to distinguish between conformers that are just noisy versions of a base conformation (e.g., the PDB structure) and those that capture true conformational variability (relative to the base). Accordingly, structures sampled from a Gaussian distribution about the base structure should be more predictive of the base struc-ture than strucstruc-tures displaying true variability. This allows us to separate out the biologically relevant varia-bility due to physical motion using a feature selection
technique, Lasso [16]. Lasso, which stands for “least
absolute shrinkage and selection operator,”is a regular-ized regression technique in which only the most signifi-cant predictor features are selected [16]. We illustrate the approach on X-ray crystallographic data, as it is the most common source of structural data. Our results demonstrate that the method compares favorably with previous approaches. It is more robust to specific para-meter choices and produces fewer false positives and false negatives (see Comparative Analysis). In contrast to conventional approaches, we use Electron Density Maps (EDM), as opposed to 3-D coordinates used for pairwise structure comparison, for identification of true variability; this allows us greater power in accurately identifying true structural outliers without the need for any artificial parameters to model noise [17]. Finally, our predictions of true variable regions are in good agreement with the dynamics inferred from solution NMR experiments; the latter are presumably closer to the physical reality.
One of the key contributions of our work is in fram-ing the problem as a sparse estimation problem, in a way that allows a wealth of machine learning knowledge to be applied to it. In particular, the problem of
identifying sparse models that can be physically inter-preted has recently gained much attention in machine learning, data mining and statistics due to the exponen-tial growth in publicly available data [18]. We show here that identification of true variable regions in an ensem-ble is naturally formulated as a sparse learning proensem-blem via Lasso. This formulation allows us to rigorously deal both with noise in the experimental data and uncer-tainty associated with the structure-building process. Our approach of using Lasso is quite general, and can be applied to any structural data. Application of our method to proteins of interest may reveal interesting conformational changes that might go unnoticed due to the absence of alternate structural evidence, i.e., inde-pendently solved alternate conformations, which are still expensive and cumbersome to obtain.
A key intuition driving our approach is as follows: to identify true variability in a protein fragment, rather than performing a per-atom statistical test, we perform a whole-model statistical test. A per-atom test will essentially ignore correlated motions (even if small) between neighboring atoms; in contrast, a whole-model test will be able to identify even small correlated motions. We formalize this approach using the Lasso-based test. We exploit the idea of borrowing informa-tion from all the samples to make a reliable statistical inference on a particular sample. In contrast, a pairwise
t-statisticapproach uses information from only a single sample to make a decision [13].
Related Work
Coordinate-based methods using pairwise comparisons have had reasonable success in identifying flexible regions [11,19]. However these techniques were designed to identify true flexibility in conformations that have been solved independently, where there is already some evidence of variability. Nigham et al. give a statis-tical test based on pairwise RMSD to identify regions showing true variability in the presence of noise. Key to their method is the assumption of a uniform, normal independent noise (artificially added) at each coordinate. However, this assumption typically does not hold in rea-lity [20].
in one value the conformational variability, as well as ambiguities related to inadequacies in data (e.g., related to crystal imperfections, errors in measurement of inten-sities). This problem is aggravated at medium-to-low resolutions (> 1.5Å). At such resolutions, B-factors act as“error-sinks,” absorbing any errors (not necessarily related to protein motion) in the optimization and model building process [17].
A number of methods have been proposed to model multiple conformations that might give rise to X-ray crystallographic data from a single crystal [7,9,10,12]. Although independently optimized multi-conformer representations prove to be a very attractive solution, interpretation of what the ensemble represents is a gray area [9,12]. Knight et al. (2008) give a simple residue-level heuristic test based on the variance in the ensem-ble to identify true variability. However, there is no con-sensus method to identify true structural variability, and the interpretation of such ensembles is still the subject of debate [9,12].
Results
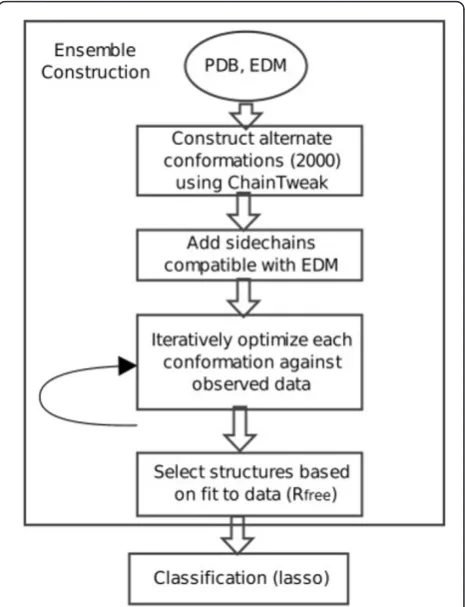
Our method consists of two steps (Figure 1): a) con-struction of an ensemble representative of the observed data, and b) analysis of the variability in this ensemble using Lasso. The ensemble generation algorithm is inde-pendent of the classification of variability; the ensemble can be obtained from any other method. However, it is important to ensure that all the structures in the ensem-ble are of high-quality, and represent the data almost as
well as the PDB structure (see Methods:Ensemble
Con-struction). To formulate the classification problem using Lasso, we express the PDB structure as a linear combi-nation of the members of the ensemble (each member is thus a feature). We fit the regression using EDMs obtained from the diffraction data and 3-D coordinates of individual members. Members of the ensemble that are noisy versions of the PDB structure, and hence more correlated with it, will be selected in this regres-sion. The remaining structures are classified as truly variable (see Methods:Analysis of variability and Elec-tron Density Map).
Synthetic Data
Our algorithm successfully models variability in a simu-lated crystal having two conformations, one the PDB structure (conformer 1) and the other constructed com-putationally (conformer 2) (Figure 2A; green and gray; RMSD = 0.989 Å). The second conformer was con-structed using ChainTweak [21]; we randomly selected a conformation from a set of 100. Side chains were built using RAPPER and all atoms were assigned a B-factor of
30 Å2. Synthetic diffraction data were computed by
averaging the simulated structure factors of the two
conformers using the experimental resolution cutoffs [12,22].
Starting from an EDM of the simulated crystal, our algorithm generates structures similar to both the origi-nal structures (Figure 2A, B). Of the 13 structures output by the algorithm, 4 structures were non-redundant; remaining structures were almost identical to these 4 structures. Lasso regression on these 4 structures shows that the ensemble correctly identifies the heterogeneity in the original data; 2 structures have coefficientsω≈0 with regression done with EDM ofconformer 1(as per at-test;
colored blue in Figure 2A), corresponding to structures
with true variability (see Methods: Electron Density
Map). Moreover, the same conformations had
statisti-cally significant coefficients (ω> 0) in the regression with the EDM ofconformer 2. Indeed, these conformations are closer toconformer 2(RMSDs = 0.298, 0.128 Å) than the
Figure 1Overview of the ensemble generation and classification algorithm. Roughly 2000 conformations are constructed using ChainTweak and side-chains are added using RAPPER. The
optimization is carried out until the fit-to-data converges (Rfree). In the
final step, structures that collectively represent the data as well as the PDB structure are selected for classification via Lasso. EDM: Electron density map.Ris a measure of agreement between the amplitudes of the structure factors calculated from a structure and those from the original diffraction data.Rfreeis the corresponding cross-validation
conformations classified as non-variable (RMSDs = 0.456, 0.765 Å). The algorithm thus appears to recover the het-erogeneity in the data (Figure 2B).
Performance analysis
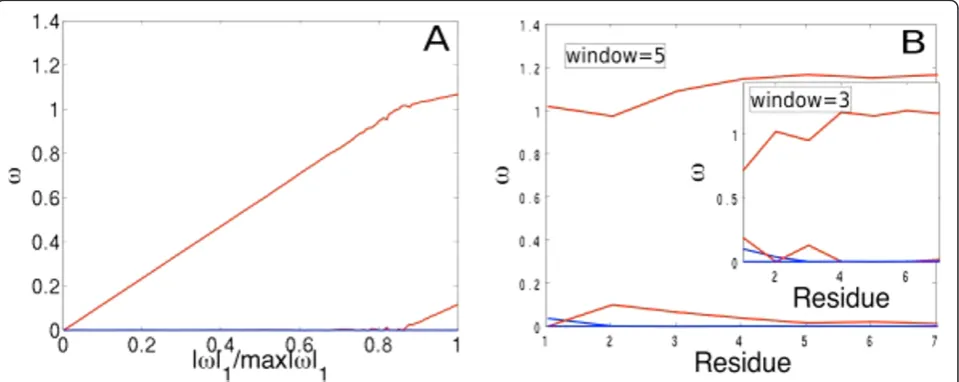
Our method is robust and consistent (Figure 3A, B). The consistency and accuracy of our method depends on the extent of correlation between the features (see Methods: Analysis of variability). Correlation between structures that are truly variable and ones variable due to noise, will result in different regularization penalties (l) selecting very different structures, leading to highly variable regression weights [23,24]. Our simulations indicate that the features (i.e. conformations in the ensemble) are uncorrelated to a large extent (Figure 3A), indicated by the overall smooth trends for
ωas we increase the regularization penalty l. Increasing
lshrinks the individual weights of the features towards
zero, thereby decreasing the ratio |ω|1/max|ω|1. We believe the overall smoothness of the regularization path may be due to the efficiency of the sampling algorithm-ChainTweak, which constructs highly diverse and uncorrelated conformations. In our simulations we find that, of the four structures in the ensemble, only one structure (red) is dominant for all regularization penal-ties. A second structure (red) is selected only at lowl’s (< 50; Figure 3A).
We find that our overall classifications are quite
robust to the size of optimized grid region ‘G’ (see
Methods:Electron Density Map). The average weight of
a structure, calculated by averaging over all fragments, is consistent across varying fragment and window sizes; structures represented in red do indeed have the highest average weights and those in blue, negligible average weights (Figure 3B). One could vary ‘G’in two ways: by
Figure 2Example of ensemble construction and classification. A) PDB structure is shown in green, the second conformer in the synthetic crystal is in gray. The two structures classified by Lasso as variable are shown in blue and the two as variable due to noise, in red. B) Summary of the algorithm output using synthetic data. RMSD is calculated with respect to the PDB structure (green). Suitability of the linear model and statistical significance of the regression coefficients were evaluated using standard techniques (R2andt-test).
Figure 3Performance analysis. A) Regularization path for the ensemble (|ω|1®0 asl®∞towards left). B) Residue-level lasso with varying
splitting the chain into separate fragments and carrying out Lasso on each one, or by sliding a window centered around each residue and optimizing over each window. Our results on the fragment-based approach are identi-cal to Figure 3B; we used fragment sizes of 1,2,4 and 8 (data not shown). For the second approach, we used sliding windows of sizes 3 and 5 centered on each resi-due (Figure 3B), and optimized over the bounding box enclosing the residues in the window.
Comparative analysis
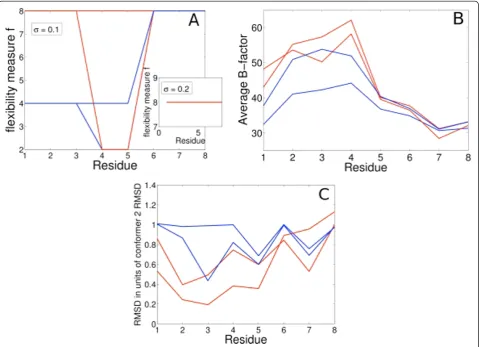
Lasso compares favorably to other methods in identify-ing true flexibility. The pairwise comparison method of Nigham et al. (Pflex) is sensitive to the standard devia-tion of added noise (s).Pflexcomputes a flexibility
mea-sure, ‘f’, for each residue based on RMSD, s and a
threshold p-value. A lower f implies higher flexibility.
We used the values suggested by Nigham et al. for s
(0.1 < =s< = 0.2) and the threshold p-value (= 0.0001).
Pflex tends to easily classify structures as variable at low levels of added noise (s= 0.1, Figure 4A); three of the
four structures in the ensemble are classified as variable. At higher noise levels it fails to classify any structure as truly variable, leading to false negatives; f remains at 8 for all residues for all structures in the ensemble (s= 0.2, Figure 4A Inset). While B-factors can correctly identify the regions of high variability, they fail to distin-guish between noise and true variability, as evidenced by the similar profiles (Figure 4B). RMSD (best-fit) provides some indication of the true variability, but the interpre-tation may be sensitive to noise levels. The extent of the initial variability in the crystal, represented by each structure in the ensemble can be analyzed by looking at normalized RMSD: RMSD from the PDB structure
nor-malized by the RMSD of conformer 2 (from the PDB
structure). A higher normalized RMSD implies the
structure is closer to conformer 2, and a lower score
implies it is closer to the PDB structure (Figure 4C). However, it is not clear what RMSD cutoff one should use in the presence of noise to robustly classify a struc-ture as variable.
Real Data
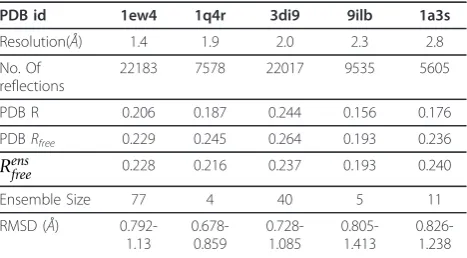
Our algorithm performs well on experimental diffraction data from 5 crystal structures across a range of resolu-tions (Table 1). We evaluated our models by comparing them with the best available single-conformer model (i.e., PDB). Analysis of data fits and variability amongst the models emphasizes the advantages of representing the data using multiple conformers. Even when our ensemble contains models differing by ~1 Å, we get an equivalent/improved fit to data: Rens
freeis lower than or
equal to the PDB Rfree. Our average improvements in
Rfree are competitive with other approaches that
con-struct multiple-conformer representations [7,9,12]. Tests on real data show that multi-conformer models add the most value at low resolutions; at high resolu-tions (< 1.5Å) the ensemble is not able to significantly
improve upon the fit-to-data (Table 1 PDB
Rfree<=Rensfree). It is possible that the truly variable con-formers themselves cluster into a small number of sets. This may be especially true for PDB structures 3di9 and 1ew4, where the greater number of observations might have a bearing on the larger size of the ensemble. More-over, for low resolutions, it is interesting to note that most of the variability observed is due to noise - less than 8 alternate conformers are truly variable in most cases. This re-confirms the importance of analyzing the basis of variability, particularly in multi-conformer representations of low resolution data. Our method is suited for this analysis as the structures are selected robustly and the resulting sparsity can be physically interpreted.
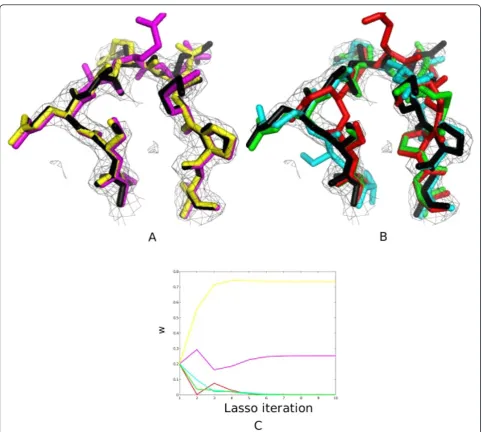
We observe that Lasso can classify variability effec-tively for most cases; structures classified as variable
appear to differ more than those classified as non-vari-able (Figure 5A, B). Since we use an iterative method to solve the regression problem, interpretation of variability in the ensemble can be further analyzed by looking at the solution trajectory for Lasso (ω vs. Lasso iteration; Figure 5C). The trajectory can help give a qualitative picture of the landscape near the native conformation: structures whose coefficients go to zero faster are farther away from the native structure.
We then asked the question: “is there any biological
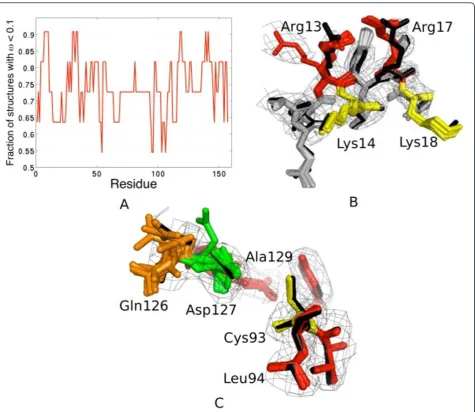
insight from the ensemble that can help us in under-standing protein function ?”To this end, our results on the crystal structure of the human ubiquitin-conjugating enzyme (Ubc9, pdbid: 1a3s) give some interesting anec-dotal evidence [26]. Using a window-size of 5 centered on each residue, we applied Lasso to identify the most variable regions for 1a3s (11 structures; Figure 6A). Four fragments turn out to be highly variable: the N-terminal helix (6-20), 30-40, 115-120 and C-terminus residues 135-145. This is in good agreement with NMR experi-ments, which reveal that Leu6, Ala10, Arg13, Arg17, Leu38, Leu119, Gln126, Asp127, Ala129, Glu132, Ile136 and Asn140 are amongst the most flexible residues in an otherwise rigid structure [27,28]. These residues overlap with our predictions of the true variable regions (Figure 6A). Our method is thus able to identify physi-cally relevant variabilities.
Additionally, it is known that the N-terminus is important for Ubc9’s specificity for SUMO rather than ubiquitin [27,28]. However, the molecular mechanisms responsible for substrate identification and interaction are not well understood [29]. Tatham et al. (2003) con-ducted site-directed mutagenesis experiments on Ubc9 to discover that mutations R13A/K14A and R17A/K18A
disrupted Ubc9’s interaction with SUMO-1. More
recently, through a crystal structure of the Ubc9-SUMO-1 complex, R13 and R17 have been observed to be involved in key non-covalent interactions with SUMO-1 [30]. A closer look at the heterogeneity mod-eled by our method suggests two possible conforma-tional states for R13 (Figure 6B). Proximity of the two arginines at positions 13 and 17 indicate that such con-formational changes might influence the binding inter-face with an E1-ubiquitin conjugate [28,30]. Finally, we looked at the dynamics captured by the ensemble near the active site for substrate recognition Cys93. We find that Gln126 and Asp127 have been modeled in multiple conformations by our algorithm (Figure 6C). Interest-ingly, these residues have been shown to be highly flex-ible and possibly important for substrate recognition through mutagenesis experiments [31]. Further detailed analysis in light of our results could give some insight into the molecular mechanisms underlying such specific interactions.
Table 1 Summary of the models obtained using real diffraction data
PDB id 1ew4 1q4r 3di9 9ilb 1a3s
Resolution(Å) 1.4 1.9 2.0 2.3 2.8
No. Of reflections
22183 7578 22017 9535 5605
PDB R 0.206 0.187 0.244 0.156 0.176
PDBRfree 0.229 0.245 0.264 0.193 0.236
Rens
free 0.228 0.216 0.237 0.193 0.240
Ensemble Size 77 4 40 5 11
RMSD (Å) 0.792-1.13 0.678-0.859 0.728-1.085 0.805-1.413 0.826-1.238
PDBRandRfreeare calculated after 6 iterations of optimization in PHENIX [25].
These may differ from published values.“No. of reflections”gives the total number of experimental observations (i.e. intensity measurements).Rensfree
Conclusions
We have introduced a novel technique for analyzing conformational changes that may be present in a real protein crystal. Our method first constructs a high-qual-ity, diverse ensemble of structures respresentative of the crystallographic data. We then use a sparse estimation algorithm (Lasso) to distinguish structures that are gen-uinely variable from those that appear variable due to noise.
Unlike previous approaches, our method involves the estimation of variability by operating in the EDM space rather than in the 3-D coordinate space. This allows us
to avoid the errors that are implicitly introduced in inferring the 3-D coordinates from the EDM. In particu-lar, our method is able to effectively deal with correlated motions, without assuming independent and identically distributed (i.i.d) noise - a key assumption in earlier approaches [11]. Tests on real data show that the algo-rithm is able to capture physically relevant conforma-tional changes, even for low resolution structures where the amount of noise is significant. Another advantage of operating in EDM-space is that our current technique is independent of any structure inference packages, and can be integrated to improve structure inference at an
earlier stage in the structure-building process (e.g., from an initial experimental EDM). We believe that this approach is particularly useful in inferring/analyzing low-resolution structures. A common criticism of ensemble modeling approaches at low-resolutions is that they over-fit the data [9,12]. In contrast, our use of Lasso enables us to identify and discard structures that are variable only due to noise, permitting simultaneous optimization of the ensemble against the data without significant over-fitting risk. This, in turn, should improve automated structure determination at low reso-lutions where ambiguous EDMs often lead to error-prone single conformer models [9,12].
A key contribution of this paper is the Lasso-based statistical test to distinguish variability due to noise from that due to true heterogeneity. We believe that the general approach we have introduced - to evaluate noise using the entire ensemble, rather than on a per-atom pairwise basis - may be of value in other ensemble based analyses also. Lasso’s performance as a statistical test here could be further improved by using kernel-based algorithms that can effectively deal with correla-tions and non-linear generative models [32].
Correctly estimating the true variability in a protein’s structure is crucial. Our results indicate that the magni-tude of variations within the ensemble could give
Figure 6Flexibility analysis of the 1a3s ensemble. A) Residue level Lasso with a window size of 5 reveals four fragments (peaks) of potential interest: 6-15, 30-40, 115-120 and135-142. B) The N-terminal region (12-20) of 1a3s. Multiple rotamers of R13 (left, red) might affect the
misleading results for structural analysis, especially with single conformer models. Furthermore, true, localized variability could have a significant impact on solvent accessibilities, secondary structure prediction, estimation of electrostatic and potential energies, and template-based homology modeling techniques [8]. Accurate estimate of these quantities, in turn, is crucial to understanding the biochemical and functional characteristics of a protein.
Methods
Ensemble Construction
To obtain a diverse, high-quality ensemble representing the X-ray diffraction data, we seed a single-conformer maximum likelihood optimization procedure (e.g., PHE-NIX) with a diverse set of conformations [25]. We assume that realistic conformations explaining the crys-tallographic data will be within a limited RMSD distance of the published PDB structure; this follows similar assumptions in previous work [7,10]. However, hinge motion, if present in a single crystal specimen, can also be detected by sampling in a larger conformational space around the PDB structure. Starting from the back-bone coordinates in the PDB, we construct alternate backbone conformations within 2Å RMSD using ChainTweak, a state-of-the-art inverse-kinematics based neighborhood-sampling algorithm [21]. ChainTweak can, in principle, exhaustively sample from the neigh-borhood of a conformation; leading to a highly variable and diverse ensemble. For each backbone, we assign side-chains using RAPPER [7], based on their fit to the Electron Density Map (EDM). We tried sampling from higher RMSD neighborhoods around the PDB structure, but RAPPER often fails to find a rotamer-assignment compatible with the EDM for conformations greater than 2Å RMSD from the PDB backbone. The final ensemble is obtained by subsequent optimization using PHENIX and filtering based on fit-to-data, measured using a cross-validation parameter Rfree; lower Rfree
implies better fit-to-data. The final ensemble consists of structures that are of high quality and collectively repre-sent the data, as well as the PDB structure (Figure 1).
Analysis of Variability using Lasso
Given an ensemble of conformations, our goal in this section is to identify the subset of conformations whose variation from a given base conformation is most likely due to only noise in the experimental data. The remain-ing conformations can then be interpreted as demon-strating true variability compared to the base conformation. The choice of a base conformation here is arbitrary; a natural choice for it is the PDB structure, since one is often interested in conformational variabil-ity not captured by the published PDB structure. To achieve this goal, we formulate a Lasso regression
problem: we express the base conformation as a linear combination of the ensemble members (each such conformation is thus a feature); we use experimental data (i.e. diffraction data) to fit this regression. As part of the Lasso framework for feature selection, we assign (unknown) weights to each feature. The key strength of Lasso is that it is likely to make the weights for irrele-vant features exactly zero, clearly identifying them. The intuition here is that structures sampled from a Gaus-sian distribution (i.e. modeled by B-factors) about the PDB structure should be more predictive of the PDB structure than structures displaying true variability. The former structures will be assigned a non-zero weight during Lasso and can then be classified as not displaying true structural variability, since they are adequately represented by the PDB structure and do not represent biologically relevant long time-scale motion.
Lasso regression is often an effective technique for shrinkage and feature selection in cases where feature selection must be performed with noisy, limited data [16,32,33]. The loss function of Lasso regression is defined as:
L= i
(yi−
p
βpxip)2+λ
p
||βp||1 (1)
wherexipdenotes the pth predictor (feature) in theith
data point, yi denotes the value of the response for this
data point, and bpdenotes the regression coefficient of
thepth feature. Thel1 regularizer leads to a sparse solu-tion in the feature space, which means that regression coefficients for the most irrelevant and redundant fea-tures shrink to zero. Interestingly, recent theoretical work recovers Lasso as a formulation of a linear robust regression problem under feature-wise uncorrelated and norm-bounded noise [33]. The authors suggest that such problems are of interest when values of the fea-tures are obtained with noisy pre-processing steps, and the magnitudes of such noises are bounded.
We exploit this parallel in our formulation, where we compute each feature (i.e. each structure in the ensem-ble) by optimizing against the observed data. The PDB structure is the observed quantity, and the individually optimized structures in the ensemble are our noisy
pre-dictor features. A sparse solution in the b space will
then represent structures which are variable due to
noise (bp > 0), thus decomposing the variability
observed in the ensemble. To get the regularization pen-altyl, we follow suggestions based on other applications of Lasso and use cross-validation [16,24].
Electron Density Map
contrast to previous approaches, which use coordi-nate based methods for pairwise structure compari-son, we have designed the test using EDMs, since the former cannot distinguish between model errors and genuine structural outliers [17]. EDMs are obtained by taking an inverse-fourier transform of the observed diffraction data, which are appropriately scaled using B-factors [22]. Another advantage of using an EDM is that it directly includes the B-fac-tors of the models, and hence can also inherently deal with isotropic or anisotropic B-factors. This cir-cumvents the problem of estimating actual uncer-tainty from B-factors, which is often a challenge for coordinate based methods. The simple regression test quantifies the relevance of each structure in the ensemble to the Gaussian distribution around the PDB (as given by the B-factors).
As part of our Lasso formulation, we assume as the observed variable, the EDM computed from the PDB structure. The predictor variables, or features, are EDMs of structures in the ensemble. The electron density at a point‘g’on a grid describing the observed EDM(ρPDBg ), is then modeled as a linear combination of electron den-sities at the point ‘g’of the predictor EDMs(ρig). We assume that the observed electron density is noisy with respect to our generative model and model this using a normally distributed noise componentεg. We then
mini-mize the Lasso loss function:
ρg PDB=
i
ωiρig+εg (2)
min gεG
(ρPDGg − i
ωiρig)2+λ
i
ωi (3)
Here,ωiare the regression coefficients. The structures
for whichωi approaches zero are the ones most
irrele-vant compared to the PDB, and hence exhibit true varia-bility. To optimize over a fragment (e.g., one residue),‘g’ is restricted to the bounding box for the fragment.
All EDMs are constructed using Clipper [34], and are described on the same unit cell with the same symmetry as that of the PDB structure. The optimization was car-ried out using the non-linear optimization library IPOPT, which uses an interior point method, combined with an efficient line-search procedure, to minimize the non-linear objective function [35].
Acknowledgements
The authors thank Dr C. Stultz and Dr M.V. Hosur for insightful discussions. This publication was made possible by Grant Number 1R01GM081871 from the National Institute of General Medical Sciences. Its contents are solely the responsibility of the authors and do not necessarily represent the official views of the NIH or NIGMS.
Author details
1Computer Science and Artificial Intelligence Laboratory, MIT, Cambridge,
MA, USA.2Dept. of Mathematics, MIT, Cambridge, MA, USA.3Dept. of Materials Science and Eng., MIT, Cambridge, MA, USA.
Authors’contributions
RS, RH and BB identified the problem. RH implemented the algorithms and collected data. RH, RS and BB analyzed the data and wrote the paper. All the authors have read and approved the final manuscript.
Competing interests
The authors declare that they have no competing interests.
Received: 14 October 2010 Accepted: 19 April 2011 Published: 19 April 2011
References
1. Bourne P, Weissig H:Structural BioinformaticsWiley-Liss, Inc., NJ; 2003. 2. Jensen L:Refinement and reliability of macromolecular models based on
X-ray diffraction data.Methods in Enzymology1997,277:353-366. 3. Ringe G, Petsko G:Study of protein dynamics by X-ray diffraction.
Methods in Enzymology1986,131:389-433.
4. Volkman B, Lipson D, Wemmer D, Kern D:Two state allosteric behaviour in a single domain signalling protein.Science2001,291:2429-2433. 5. Eissenmesser E, Millet O, Labeikovsky W, Korzhnev D, Wolf-Watz M, Bosco D,
Skalicky J, Kay L, Kern D:Intrinsic dynamics of an enzyme underlies catalysis.Nature2005,438:117-121.
6. Koshland D:Conformational changes: How small is big enough?Nature Medicine1998,4:1112-1114.
7. DePristo M, de Bakker P, Blundell T:Heterogeneity and Inaccuracy in Protein Structures Solved by X-ray Crystallography.Structure2004, 12:831-838.
8. Furnham N, Blundell T, DePristo M, Terwilliger T:Is one solution good enough.Nature Struct and Mol Biol2006,13(3):184-185.
9. Terwilliger T, Grosse-Kunstleve R, Afonine P, Adams P, Moriarty N, Zwart P, Read R, Turk D, Hung LW:Interpretation of ensembles created by multiple iterative rebuilding of macromolecular models.Acta Crystallographica (D)2007,63:597-610.
10. Knight J, Zhou Z, Gallichio E, Himmel D, Friesner R, Arnold E, Levy R: Exploring Structural variability in X-ray crystallographic models using protein local optimization by torsion angle sampling.Acta Crystallographica (D)2008,64:383-396.
11. Nigham A, Hsu D:Protein conformational flexibility analysis with noisy data.Journal of Computational Biology2008,15:813-828.
12. Bedem van den H, Dhanik A, Latombe J, Deacon A:Modeling discrete heterogeneity in X-ray diffraction data by fitting multi-conformers.Acta Cryst (D)2009,D65:1107-1117.
13. Ji H, Liu S:Analyzing‘omics data using hierarchical models.Nature Biotechnology2010,28:337-340.
14. Shehu A, Kavraki L, Clementi C:On the characterization of Protein Native state ensembles.Biophysical Journal2007,92:1503-1511.
15. Gore S, Blundell T:Optimal side-chain packing in proteins and crystallographic refinement.J Appl Cryst2008,41:319-328.
16. Tibshirani R:Regression shrinkage and selection via the Lasso.Journal of the Royal Stat Soc Series B1996,58:267-288.
17. Kleywegt G:Validation of protein crystal structures.Acta Crystallographica (D)2000,56:249-265.
18. Hastie T, Tibshirani R, Friedman J:The Elements of Statistical Learning: Data Mining, Inference and PredictionNew York: Springer Science+Business Media, LLC; 2009.
19. Gerstein M, Chothia C:Analysis of protein loop closure: two types of hinges produce one motion in lactate dehydrogenase.Journal of Molecular Biology1991,220:133-149.
20. Vitkup D, Ringe D, Karplus M, Petsko G:Why Proteins R-factors are so large: a self consistent analysis.Proteins2002,46:345-354.
21. Singh R, Berger B:ChainTweak: Sampling from the Neighbourhood of a Protein Conformation.Pacific Symposium on Biocomputing2005, 52-63. 22. Drenth J:Principles of Protein X-ray CrystallographyNew York:
Springer-Verlag; 1999.
24. Meinshausen N, Rocha B, Yu B:Discussion: A tale of three cousins: Lasso, L2Boosting and Dantzig.Annals of Statistics2007,35:2373-2384. 25. Adams P, Grosse-Kunstleve R, Hung L, Loerger T, McCoy A, Moriarty N,
Read R, Sacchettini J, Sauter N, Terwilliger T:PHENIX:building new software for automated crystallographic structure determination.Acta Crystallographica (D)2002,58:1948-1954.
26. Giraud F, Desterro J, Naismith J:Structure of Ubiquitin-conjugating enzyme 9 displays significant differences with other ubiquitin-conjugating enzymes which may reflect its specificity for sumo rather than ubiquitin.Acta Cryst (D)1998,54:891-898.
27. Liu Q, Yuan Y, Shen B, Chen D, Chen Y:Conformational Flexibility of a Ubiquitin Conjugation Enzyme (E2).Biochemistry1999,38:1415-1425. 28. Liu Q, Jin C, Liao X, Shen Z, Chen D, Chen Y:The Binding Interface
between an E2 (UBC9) and a Ubiquitin Homologue (UBL1).J Biol Chem 1999,274:16979-16987.
29. Tatham M, Kim S, Yu B, Jaffray E, Song J, Zheng J, Rodriguez M, Hay R, Chen Y:Role of N-Terminal Site of Ubc9 in SUMO-1,-2, and -3 Binding and conjugation.Biochemistry2003,42:9959-9969.
30. Knipscheer P, Dijk van W, Olsen J, Mann M, T S:Noncovalent interaction between Ubc9 and SUMO promoted SUMO chain formation.The EMBO Journal2007,26:2797-2807.
31. Lin D, Tatham M, Yu B, Kim S, Hay R, Chen Y:Identification of a substrate recognition site on Ubc9.Journal of Biological Chemistry2002,
277:21740-21748.
32. Li F, Yang Y, Xing E:From Lasso regression to Feature vector machine. Neural Information Processing Systems (NIPS)2005,18:779-786. 33. Xu H, Caramanis C, Mannor S:Robust Regression and Lasso.Neural
Information Processing Systems (NIPS)2008.
34. Cowtan K:The Clipper project.Joint CCP4 and ESF-EACBM Newsletter on Protein Crystallography2002,40: [http://www.ccp4.ac.uk/newsletters/ newsletter40.pdf].
35. Wachter A, Biegler T:On the implementation of a primal-dual interior point filter line search algorithm for large-scale nonlinear programming. Mathematical Programming2006,106:25-57.
36. Delano W:The PyMOL Molecular Graphics System2002 [http://www.pymol. org].
doi:10.1186/1748-7188-6-12
Cite this article as:Hosuret al.:Sparse estimation for structural
variability.Algorithms for Molecular Biology20116:12.
Submit your next manuscript to BioMed Central and take full advantage of:
• Convenient online submission
• Thorough peer review
• No space constraints or color figure charges
• Immediate publication on acceptance
• Inclusion in PubMed, CAS, Scopus and Google Scholar
• Research which is freely available for redistribution