STUDY OF THE DEVELOPMENT OF THE STRUCTURE OF THE NETWORK OF
SOFIA SUBWAY
ИЗСЛЕДВАНЕ НА РАЗВИТИЕТО НА СТРУКТУРАТА НА МЕТРОМРЕЖАТА НА СОФИЙСКИЯ
МЕТОПОЛИТЕН
Assoc. Prof. PhD Stoilova S., MSc. eng. Stoev V., Faculty of Transport, Technical University – Sofia, Bulgaria
E mail: [email protected]; [email protected]
Abstract
:
The main issues are considered in this topic: study of the structure of metro system by using the Graph Theory. New indicators have been defined in the research such as a degree of routing, a connectivity of the route, average length per link (which takes into account the number of routes), intensity of the route, density of the route.The study includes network of Sofia subway and the plans for its future development. The methodology could be used to evaluate other existing metro networks as well as for preliminary analysis in the design of subway systems.KEYWORDS: GRAPH THEORY, METRO NETWORK, SUBWAY, PASSENGERS, VERTEX, EDGES, CONNECTIVITY, STATION
1.
Introduction
Metro systems are the main type of public transport in many cities around the world. The structure of the different metro lines depends on the size of the city, the location of the different regions, the density of the development and others. The structure of the metro network, the number of subway lines and subway routes are important for the volume of passenger flows and the overall organization of urban passenger transport. An analysis of metro networks features can be of substantial help for planners.
The object of the research is the network of Sofia’s subway. The operation of the Sofia‘s subway started from 1998, the expansion continues to our own day. As of May 2015, the Sofia Metro consists of two interconnected lines, serving 34 stations, with a total route length of 38.6 km. In this context it is necessary to examine factors related to the structure of the metro network to assess the schemes of development and organization of transport.
The aim of the study is:
• To apply the Graph Theory for studying metro network; • To examine the state and the structure of metro network
with indicators defined by the Graph theory;
• Apply the model to the network study of the Sofia’s metro system and the future plans of development.
2. Methodological approach
The Graph Theory is inherently linked to transportation. A lot of researchers have used the Graph Theory to study the characteristics of transport networks. In [11] is explained the main Graph Theory concepts as well as various indicators have been introduced, such as traffic flow, network diameter, and other dimensionless ratios. The first introducing of three of the Graph Theory’s indicators directly linked to network design (circuits, degree of connectivity, and complexity) is made in [9]. In [12] is established a comprehensive series of new indicators, the line overlapping index, the circle availability, and network complexity. The main indices that represent the structural properties of a graph as such are beta index (a level of connectivity), alpha index (a measure of connectivity which evaluates the number of cycles in a graph), gamma index (connectivity), eta index (average length per link) and others, [12].
Some authors have used the Graph Theory to study metro networks. In [5] and [6] are used three indicators such as coverage, directness, and connectivity to assess the overall properties of networks. There are introduced new indicators such as tau (directness) and rho (connectivity). Authors have analysed 19 subway networks located around the world, [5, 8]. They are compared by using the annual numbers of boarding per capita as a
performance indicator. In [6] has been adapted various concepts of the Graph Theory to describe characteristics of the State, Form and Structure of 33 metro systems. The complexity of metro systems and the impact of network size have been analysed and the implications on robustness have been discussed, [7]. It uses three indicators relevant to ridership: coverage, directness, and connectivity. This study used the Graph Theory as a mathematical method to transform networks into graphs, from which relevant properties (e.g., links, nodes) were collected. The authors analysed 19 subway–metro networks and developed three indicators to assess the overall properties of transit networks, linking them to ridership.
The Graph Theory and the Complex Network Theory are adopted to examine the connectivity, robustness and reliability of the Shanghai subway network of China, [16]. The subway network systems of four cities, i.e., Seoul, Tokyo, Boston and Beijing, are studied by using global and local efficiencies and the Graph Theory, [3]. The Complex Network Theory and the Graph Theory are adopted to analyse and calculate the vulnerability of metro network, [4].
All these studies indicate that the Graph Theory may be successfully used for examining the metro networks. In the papers, it has not been studied the effect of the number of routes in metro systems on their structure and the satisfaction of passengers.
2.1.A representation a metro network in a graph
In this research is used the methodology elaborated by authors in [13]. The model was applied to study and classify the 22 European metro systems.
The goal of a graph is to represent the structure of a network, [2, 15]. A graph is a symbolic representation of a network and of its connectivity. It implies an abstraction of the reality so it can be simplified as a set of linked nodes. The conversion of a real network into a planar graph is based on the following principles: every terminal and intersection point becomes a node; each connected node is then linked to a straight segment.
An example of a representation of a metro network in a graph is shown in Fig.1. In Figure 1a is shown a real metro network, Figure 1b shows a presentation of a simple graph presented in the research.
Edges are non-directional links. The edges are two types – single
e
Sand multiplee
M.2
M S e
e
e= + , (1)
where:
e
is the total number of edges;e
Sis the total number of single-use edges;e
Mis the total number of multiple-use edges.In order to define the total number of edges eS andeM, each edge
must be reported twice- the first time from nod “i” to nod “j”, secondly from nod” j “to nod “i” .This is the reason why in formula (1) the sum of the total number is divided by two.
A real metro network by www.metrosofia.com
Fig.1. Sofia’s metro network representation in graph structure
The single edge shows that vertices are connected. The multiple edges show that there is more than one specific line between two vertices. If two consecutive vertices are linked by two or more edges, this is considered as a single edge (eS=1)and a multiple one
(
e
M=1).The total number of edges equals 2 in this case. If two consecutive vertices are linked by one edge, this is considered as a single edge (e
S=1) и the total number of edges is e=1.2.2. Indicators for study metro networks
In order to study the indicators it must be taken in to account the following clarifications:
• A metro line is a infrastructural track which connects a starting point with a finishing point and it has a definite number of stations.
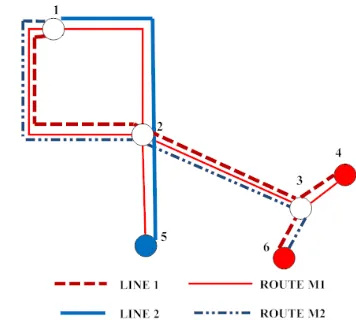
• A metro route is an organization of trains’ movement between a starting station and a finishing station and it consists of one or more than one metro lines. In most European metro networks metro routes coincide with metro lines. In the case of Sofia metropolitan a metro route is consisted of two metro lines.
Fig. 2 shows the difference between metro line and metro route.
Fig.2. Sofia’s metro network with metro lines and metro routes
2.2.1. Complexity (beta index)
The main network indicators which have been developed are complexity
β
and a degree of connectivityγ
, [5, 6, 12]. A state refers to the current development phase of a metro network. The complexity is expressed by the relationship between the number of links (e) divided by the number of nodes (ν
). The complexityβ
is determined by the formula, [6]:v
e
=
β
, (2)where:
ν
is the sum of the transfer-verticesν
T and the end-verticesν
E;e
is the number of edges.
ν
=
ν
T+
ν
E (3) A connected network with one cycle has a value of 1.2.2.2. A degree of connectivity (gamma index)
The degree of connectivity
γ
calculates the ratio between the actual numbers of edges to the potential number of edges; that is if the network is 100% connected. The value ofγ
is between 0 and 1, where a value of 1 indicates a completely connected network. This indicator is a measure of the evaluation of a network in time. For planar graphs with v≥3 , the degree of connectivity is calculated by the formula, [12]:
) 2 (
3 −
= v
e
γ (4)
The structure of metro networks is a planar graph in most cases because there is not any connectivity between all peaks within the network. In these cases, the following formula has been used (4).
In non planar graphs the degree of connectivity
γ
is calculated as follows, [12]:
) 1 ( 2
−
= ν
γ ev (5)
Metro networks which are consisted of nods connected completely have a non-planar graph. For example Warsaw metro network is linear and it is consisted of two nods and one edge. In this case.
The two indicators a complexity
β
and a degree of connectivityγ
show the structural differences between two networks of an equal size.2.2.3. An average length per edge (Eta index)
Adding new nodes will cause the eta index to decrease as the average length per edge declines.
e L
=
η (6)
where:
L
is the total metro network route length, km; e is the total number of edges in metro network.This ratio indicates the intensity (density) of the stations in the network.
2.2.4. Connectivity (rho)
The network structure is presented by connectivity
ρ
. This indicator measures the intensity and the importance of connections (i.e. transfers) in a metro system. This indicator is the relationship between the net numbers of transfer possibilities divided by the number of the transfer stations. It is calculated by the formula, [5, 6]: T M c T e ν νρ=( − ) (7)
where :
ν
Tc is the total number of transfers in the transfer vertices;M
e
is the total number of multiple edges;ν
T is the total number of transfer vertices in a metro network.The total number of transfers in the transfer vertices is the sum of the number of metro lines going through a transfer station minus one. A transfer station sharing two transit lines offers one transfer possibility, another sharing three lines offers two possibilities, and so on.
This indicator calculates the total number of net transfer possibilities. The ratio indicates the average connectivity of each transfer node in the network. The advantage of this indicator is that it provides information about the stations where more transfers from one line to another could be done, i.e. it crosses more than two metro lines.
2.2.5. Indicators of routing
New indicators such as a degree of routing, connectivity of the route, average length per edge (which takes into account the number of routes), intensity of the route, density of the route have been introduced in this research. These new factors have great impact on the categorisation and the evaluation of a metro network based on their routes. The coefficients describing the routes in a metro network show the total transport satisfaction.
The degree of routing a subway network gives a greater degree of satisfaction of transport to passengers.
) 2 ( 3 − = v i
g (8)
where:
g
is the degree of routing;i
is the total number of route arcs in the metro network; v is the total number of vertices in the metro network.The total number of metro routes is a sum of the route edges
i
Sand the multiple routes edges
i
M.The coefficient
g
considers the degree of connectivity of the routes in the transferring vertices of a metro network. The increase in the number of arcs of routes will cause an increase in the number of the vertices.The coefficient of connectivity of the routes
b
is the ratio of the total number of arcs route i to the total number of vertices in ametro network. It takes into account the connectivity of the routes in the structure of the network.
v i
b= (9)
For the coefficients
g
and band is valid the following:g≥γ ;
b
≥
β
(10) The total number of edges (routes) is equal to the sum of the single edges (routes) and the multiples edges (routes). In the matrices, one arc is passed twice for each of the both directions. When determining the total number of arcs, the sum is divided by two. This applies toe
S,e
M,i
S,i
M,e andi
. If the edges between two nodes pass through different infrastructures, multiple arc is not counted. They are accounted as single arcs.The coefficient a for average length per edge, which takes into account the number of routes, determines the intensity of the routes in a metro network.
i
L
a
=
(11)where:
L
is the total length of the metro network, kmAs the value of the coefficient is smaller, the more intense is an metro network of routes. A low coefficient indicates saturated with routes metro network.
For the coefficients
η
and a is valid the following:a≤
η
(12) The following relationship is valid for metro networks for which the graph arcs do not pass more than two lines:
g
=
γ
;b=β
;a
=
η
(13) The coefficient of density of the routesr
shows what the density of multiple route arcs in a metro network is.
v
i
r
=
M (14)where:
i
M is the total number of multiple route arcs in a metro network.3.
Application. A study of the indicators for
Sofia’s metro network
Those indicators by the graphs theory and introduced new indicators were examined for different schemes of development of the network of the Sofia subway.
In the paper have been developed variants of routes according to the possibilities of the infrastructure of the metro network. For each scheme have been studied the modification of coefficients in regard to the number of nodes, number of arcs and number of subway lines.
Fig.3. Variant scheme 0а, 0b, 0с. The end stations 2a, 2b and 2c
are respectively for each of the variants 0a, 0b and 0c
Fig.4. Variant scheme 1
Fig.5. Variant scheme 2
Fig.6. Variant scheme 3
Fig.7. Variant scheme 4
Fig.8. Variant scheme 5
Fig.9. Variant scheme 6
Fig.10. Variant scheme 7
Fig.12. Variant scheme 8B
Fig.13. Variant scheme 9А
Fig.14. Variant scheme 9B
Fig.15. Variant scheme 10
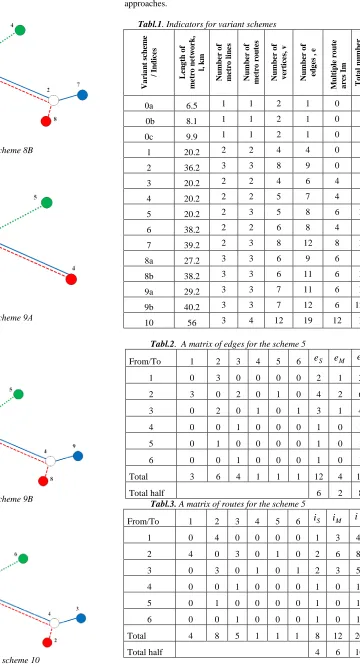
Table 1 shows the indicators length of the metro network, number of subway lines, number of vertices, number of edges, number of routes for studied variant schemes.
Tables 2 and 3 show the matrices with the values for the indicators by the graphs theory and innovation indicators for the variant scheme 5. The values seen the difference in the two approaches.
Tabl.1. Indicators for variant schemes
V a ri a n t s ch em e / I ndi ce s L en g th o f m et ro n et w o rk , l, km N um be r o f m et ro l in es N um be r o f m et ro ro u te s N um be r o f v ert ic es , v N um be r o f ed g es , e Mul ti pl e r o ut e a rcs I m T o ta l nu m be r o f a rcs r o u te i
0а 6.5 1 1 2 1 0 1
0b 8.1 1 1 2 1 0 1
0c 9.9 1 1 2 1 0 1
1 20.2 2 2 4 4 0 4
2 36.2 3 3 8 9 0 9
3 20.2 2 2 4 6 4 6
4 20.2 2 2 5 7 4 7
5 20.2 2 3 5 8 6 10
6 38.2 2 2 6 8 4 8
7 39.2 2 3 8 12 8 11
8а 27.2 3 3 6 9 6 9
8b 38.2 3 3 6 11 6 11
9a 29.2 3 3 7 11 6 11
9b 40.2 3 3 7 12 6 12.5
10 56 3 4 12 19 12 19
Tabl.2. A matrix of edges for the scheme 5
From/To 1 2 3 4 5 6
e
Se
Me
1 0 3 0 0 0 0 2 1 3
2 3 0 2 0 1 0 4 2 6
3 0 2 0 1 0 1 3 1 4
4 0 0 1 0 0 0 1 0 1
5 0 1 0 0 0 0 1 0 1
6 0 0 1 0 0 0 1 0 1
Total 3 6 4 1 1 1 12 4 16
Total half 6 2 8
Tabl.3. A matrix of routes for the scheme 5
From/To 1 2 3 4 5 6
i
Si
Mi
1 0 4 0 0 0 0 1 3 4
2 4 0 3 0 1 0 2 6 8
3 0 3 0 1 0 1 2 3 5
4 0 0 1 0 0 0 1 0 1
5 0 1 0 0 0 0 1 0 1
6 0 0 1 0 0 0 1 0 1
Total 4 8 5 1 1 1 8 12 20
Total half 4 6 10
coefficients
β
,γ
,η
,ρ
, the value for the number of multiple links is "2", while for the new coefficients is taken "3".This specificity gives an idea of the intensity of routes between two nodes (stations) in a metro network. These new coefficients are always different from those from the Graph Theory where the number of multiple arcs between two nodes is more than two.
Table 4 shows the value of indicators by Graph theory and new indicators.
Tabl.4. Indicators by Graph theory
Variant scheme / Indices
γ g β b ρ r η a
0а 1,00 1,00 0,50 0,50 0,00 0,00 6,50 6,50 0b 1,00 1,00 0,50 0,50 0,00 0,00 8,10 8,10
0c 1,00 1,00 0,50 0,50 0,00 0,00 9,90 9,90
1 0,67 0,67 1,00 1,00 0,50 0,00 5,05 5,05
2 0,44 0,50 1,13 1,13 1,00 0,00 4,02 4,02
3 0,67 1,00 1,50 1,50 1,67 1,00 3,37 3,37
4 0,56 0,78 1,40 1,40 1,67 0,80 2,89 2,89
5 0,56 1,11 1,60 2,00 2,33 1,20 2,53 2,02
6 0,50 0,67 1,33 1,33 1,67 0,67 4,78 4,78
7 0,44 0,61 1,50 1,38 1,75 1,00 3,27 3,56 8а 0,50 0,75 1,50 1,50 2,00 1,00 3,02 3,02 8b 0,50 0,92 1,83 1,83 1,67 1,00 3,47 3,47
9a 0,47 0,73 1,57 1,57 1,75 0,86 2,65 2,65
9b 0,47 0,83 1,71 1,79 1,50 0,86 3,35 3,22
10 0,40 0,63 1,58 1,58 1,67 1,00 2,95 2,95
Figure 16 shows a comparison of the initial scheme of development of the metro. Since the three schemes (fig.3) differ only in their length the coefficients have identical values. These schemes include only one metro line.
The average length per edge η and the coefficient a for average length per edge, which takes into account the number of routes, grew by increasing the length of the network.
In figures 17, 19, 21 and 23 is shown a comparison of the variants of the development of the metro network with two subway route.
In figures 18,20, 22 and 24 is shown a comparison of the variants of development of the metro network with three subway route.
Fig.16. Comparison of the indices for variant schemes
with one line
In most schemes between the coefficients of "Graph Theory" and introduced new factors there is no difference. This is due to that
in the Graph Theory for multiple edges is recorded “2” independently from of number of passing between two nodes arcs. The new indicators take into account of the exact number of arcs passing between any two nodes. Only in scheme 5 has the difference in the two types of indicators. The reason for this is the large number of routes in one line (more than 2).
The comparison of the schemes with two and three routes allows to observe the difference in indicators. The values of newly coefficients increase by increasing the number of routes on a subway line and the transportation satisfaction for passengers in the metro network is growed.
The number of arcs between two nodes in a metro system for the introduced new coefficients (g, b, r, a) is the number of routes. For example, if three metro lines pass two nodes with coefficients
ρ η γ
β, , , , the value for the number of multiple links is "2"(one single edge and one multiple edge), while for the new coefficients is taken "3"(the real number of passing routes). This specificity gives an idea of the intensity of routes between two nodes (stations) in a metro network. These new coefficients are always different from those from the Graph Theory where the number of multiple arcs between two nodes is more than two.
The coefficient "g" considers the degree of connectivity of the routes between nodes in a metro network. The value of this ratio for studying metro schemes is from 0 to 1.
The values of the coefficient ‘’b" in the research are in the range between 0,5 and 2. The largest value has the scheme 5, fig.8. It has a large number of metro lines (routes) in an arc.
When the values of ‘’g’’ and ‘’b’’ are higher, then the network has more than two routes.
Complexity β depends on the number of subway lines, transfer and end nodes. By increasing the complexity of metro network and crossings of metro lines, its value increases. For example: the variant scheme 8b (fig. 12) has β= 1,83. This index has a low value when the scheme is a linear structure such as variant 0a, 0b, 0c, fig.3.
The indicator of a degree of connectivity
γ
shows to what extent metro lines have contact to each other. The highest degree of connectivity isγ
=1. This value clearly represents the linear structure of the metro network with only one line - variants 0a, 0b, 0c, fig.3.Average length per link η has a value greater than 1. Networks with a small number of arcs and small length of lines have a higher value of the coefficient. For example scheme 0a (η=6,5), 0b (η=8,1),0c (η=9,9). The coefficient "a" accounts for intensity of routes in a metro network. It has a value from 2,02 to 9,9. These two indices have a small difference. This is for schemes 5, 7, 9b. The differences are due to the way of determining the indices total number of edges and total number of routes.
Connectivity ρ depends on the metro network. This ratio shows the level of the average connectivity of each transfer node in a network. Connectivity is 0 in linear networks such as scheme 0a, 0b and 0c. In this case, there are no transfer nodes. With an increasing number of metro lines and complexity of the network, the value of the connection is increased. The results from the study have shown values of this coefficient from 0 to 2,33. The maximum value of this coefficient is for scheme 5, fig.8 (ρ=2,33) because it has larger number of transfer units (3) and larger number of metro routes (3) compared to the other schemes in the study.
The coefficient “r” shows the density of multiple route arcs in a metro network. The more lines pass through an area, the greater is the coefficient value. For networks where there is no multiple route edges, r=0.
costs and also there is a possibility the same train composition to run on both metro lines.
The connection method the metro network in Sofia eliminating the need for separate depots for both lines and also reduces to a minimum of zero mileage of trains.
Fig.17. Comparison of the degree of routing and connectivity
for variants with two lines
Fig.18. Comparison of the degree of routing and connectivity
for variants with three lines
Fig.19. Comparison of the connectivity of the routes and complexity
for variants with two lines
Fig.20. Comparison of the connectivity of the routes and complexity
for variants with three lines
Fig.21. Comparison of coefficient of density of the routes and
connectivity for variants with two lines
Fig.22. Comparison of coefficient of density of the routes and
Fig.23. Comparison of coefficient of average length per edge and
eta index for variants with two lines
Fig.24. Comparison of coefficient of average length per edge and
eta index for variants with three lines
Conclusions
The study has shown the following results:
• The Graph Theory has been applied to characterise the metro network and to define the indicators of the state and the structure of a metro network.
• The new factors for study the metro network have been defined. These factors allow us to evaluate the stage of development of the examined systems.
• The new indicators takes into account the routes in the metro network. In the study has been examined the change of these indicators.
• The variant schemes were tested by methodology which taken into account of the development of the metro network of Sofia’s metro, since the introduction of the first part of the first subway line to final planned development of the metro’s network.
Acknowledgement
This research is conducted in relation to the execution of a contract № 142ПД0019-04/2014 ” A simulation modelling of technological processes in main metro stations of the Sofia’s subway”. The research has been funded by Technical University of Sofia, Bulgaria
References
1. Barberillo, J. & Saldana, J. Navigation in large subway networks: An informational approach. Physica A: Statistical Mechanics and its Applications. 2011. Vol. 390. Issue 2. P.374–386.
2. Bondy, J. Murty, U. Graph theory with applications. New York, Amsterdam, Oxford: North-Holland. 1976. 270 p. 3. Chang, K. & Kim, K. & et al. Subway Networks in Cities.
Journal of the Korean Physical Society, 2006. Vol. 48. P. S143-S145.
4. Deng, Y. & Qiming Li, Q. & Ying Lu, Y. & et al. Topology vulnerability analysis and measure of urban metro network: The case of Nanjing. Journal of networks. 2013. Vol. 8, No. 6, P. 1350-1356.
5. Derrible, S. & Kennedy, A. Network analysis of world subway systems using updated graph theory. Transportation Research Record: Journal of the Transportation Research Board. 2009. No. 2112. P. 17–25.
6. Derrible, S. & Kennedy, A. Characterizing metro networks: state, form, and structure. Transportation. 2010. No.37. P. 275-297.
7. Derrible, S. & Kennedy, A. The complexity and robustness of metro networks. Physica A. 2010. Vol. 389. P. 3678-3691. 8. Derrible, S. & Kennedy, A. Evaluating, Comparing, and
Improving Metro Networks. Transportation Research Record: Journal of the Transportation Research Board, 2010. No. 2146. P. 43–51.
9. Garrison, W. & Marble, D. Factor-analytic study of the connectivity of a transportation network. Papers of the Regional Science Association. 1964, Vol. 12, Issue 1, P. 231-238
10. Musso, A. & Vuchic, V. Characteristics of metro networks and methodology for their evaluation, Transportation Research Record: Journal of the Transportation Research Board. 1988. No. 1162. P. 22-33.
11. Kansky, K. The structure of transportation networks: Relationships between network geography and regional characteristics. Chicago: University of Chicago, Research Paper No. 84. 1963.
12. Rodrige, J. The geography of transport systems. Thrd edition. New York: Routelage. 2013. 297 p.
13. Stoilova, S., V. Stoev. An application of the graph theory which examines the metro networks. Proceeding of III Symposium of young researchers "TRANSPORT PROBLEMS", pp.944- 955, 2014.
14. Tan, P. & Steinbach, M. & Kumar, U. Introduction to Data mining. Minnesota: Iniversity of Minnesota. 2006. 769 p. 15. Tutte, W. Graph theory. Cambridge: Cambridge University
Press 2001. 327 p.