http://www.sciencepublishinggroup.com/j/her doi: 10.11648/j.her.20180302.11
The Influence on Academic Performance of Working Group
Methodology
Icíar Carmen Jiménez Barandalla
1, José Luis Montes Botella
2, Paloma Bernal Turnes
11
Department of Business Economy, Rey Juan Carlos University, Madrid, Spain
2
Department of Applied Economics, Rey Juan Carlos University, Madrid, Spain
Email address:
To cite this article:
Icíar Carmen Jiménez Barandalla, José Luis Montes Botella, Paloma Bernal Turnes. The Influence on Academic Performance of Working Group Methodology. Higher Education Research. Vol. 3, No. 2, 2018, pp. 23-31. doi: 10.11648/j.her.20180302.11
Received: February 13, 2018; Accepted: May 8, 2018; Published: May 24, 2018
Abstract:
The Working Group Methodology has positive effects on students’ academic performance. The contribution of this study consists in determining the variables by means of which the Working Group Methodology influences academic performance, and in comparing the effectiveness of two different working group methodologies: cooperative learning (hereafter CL) and group work without guidelines established by the teacher, known as the Unstructured Groups Methodology (hereafter UGM). To that end, the effect of Working Group Methodology on academic performance is measured using three factors: 1) student attitudes; 2) attitude to learning and the learning approach adopted by students; and 3) student skills. The sample is made up of 110 students from a Spanish university, working on the Corporate Finance module of a degree in Business Administration and Management. Based on the analysis of Structural Equation Modeling the conclusion is reached that only the CL methodology affects academic performance, and that it does so via student skills; its influence via the attitude to learning and the learning approach of the student is also debated. In addition, it can be seen that CL influences student attitudes and skills in a more significant way than UGM. Finally, the results show that the variables in the model account for academic performance to a greater extent in the group in which CL was used (R2=0.264) than in the group in which UGM was applied (R2=0.187). These results demonstrate the greater effectiveness of group work when based on well-defined guidelines, rather than when developed without a predefined structure.Keywords: Academic Performance, Working Group, Cooperative Learning, Skills, Attitudes, Learning Approach
1. Introduction
Academic studies on university education, and particularly those on education in the sphere of finance, set out the wide variety of teaching techniques and types of assessment employed in this educational area. The Working Group Methodology (hereafter WGM) is a teaching method which creates a sociocultural background to the acquisition of knowledge, promoting respect for diversity of opinion, as well as the learning of alternative behaviours. Despite the fact that various authors have investigated group work in the sphere of education [1-3], no common principles of procedure have been established for the discussion of Working Groups in general as a methodology; nonetheless, some concrete approaches to WGM do possess distinct characteristics, as is the case with cooperative learning [4], collaborative learning [5] and Student Success Skills [1].
This article analyses the influence of WGM on academic performance via three different factors: 1) student attitudes; 2) the student’s attitude to learning and its influence on the learning approach adopted; and 3) student skills. To this end, the student sample is divided into two groups, group 1 (experimental group), in which the CL methodology is taught, and group 2 (control group), in which UGM is used. For each of the two learning methods the hypotheses comprising the structural equation model are tested for the purpose of verifying and comparing the effectiveness of CL as opposed to UGM in the academic outcomes achieved by the students.
The structure of the following sections of this paper begins with a definition of each of the variables which play a part in the learning process. Thereafter, the hypotheses to be verified will be set out and the methodology of the analysis will be explained. Finally, the results obtained will be presented and discussed, and the conclusions of the study drawn.
2. Conceptual Framework
Working Group Methodology (WGM). WGM can be defined as a method by means of which people help one another in a context favourable to the solution of questions concerning personal, group, organisational or community matters [7]. The indicators defining the variable WGM in the model of this study have as their conceptual framework the model of the determinants of group effectiveness proposed by Handy [8]. The distinction made by this author between given determinants (given by the group, the type of material and by the environment), intervening factors and outcomes in the evaluation of the effectiveness of the group applies in the present study to both UGM and CL.
Academic Performance (ACADPERF). Crow and Crow [9] define academic performance as the degree to which the student benefits from teaching received in a specific learning area. In the design of the Pre-test and Post-test of academic performance, the present investigation uses the two basic measures of academic performance of Minbashian, Huon and Bird [10]: the quantity of information produced by students in the final examination, and the quality of their answers.
Student Attitudes (ATT). Dockery and Bedeian [11] define attitude as the tendency to act in a particular way. Bearing in mind that the construct Attitude represents a complex psychological state with different facets (feelings, behaviour, motivation etc.), the present study utilises multiple indicators to embrace the complex nature of this phenomenon. Thus, different indicators have been used to represent student attitudes in the three spheres of influence described by Pérez, Valenzuela, Díaz, González-Pienda and Nuñez [12]: 1) for sense of security and satisfaction; 2) with regard to learning atmosphere; and 3) in the case of involvement in academic tasks.
Student Skills (SKILLS). Brown, Green and Lauder [13] define skill as the experience, capacity or competence to carry out specific activities, often acquired through formal instruction or work experience. Woods, Felder, Rugarcia and
Stice [14] suggest that teachers should educate students in the skills of problem solving, communication, group work, self-evaluation, change management and lifelong learning. Following this approach, the present study uses indicators for individual and also social student skills.
Attitude to Learning (AL). Lovelace and Brickman [15] define attitude to learning as the student’s positive or negative feelings and predispositions with regard to learning. Shaoan [16] associates the indicators for attitude to learning with the students’ preference or interest with regard to their participation in the learning process. With this in mind, and given the relationship which exists between attitude to learning and motivation [17], three indicators have been chosen to measure the student’s attitude to learning: interest in learning, preference for social improvement, and interest in a better future.
Learning Approach (LEARNAPP). The concept of learning approach refers to the level of processing and also the intention with which the student learns specific material [18]. Booth and James [19] point out that the student can change his/her way of learning if a new classroom experience modifies his/her motivation for learning. The present study takes as its indicators for learning approach the following factors: the degree to which the knowledge acquired by the student relates to reality, the extent to which the student relates some ideas and concepts to others, and the frequency with which the student consults other sources to dig deeper into the subject matter.
3. Theory and Hypothesis
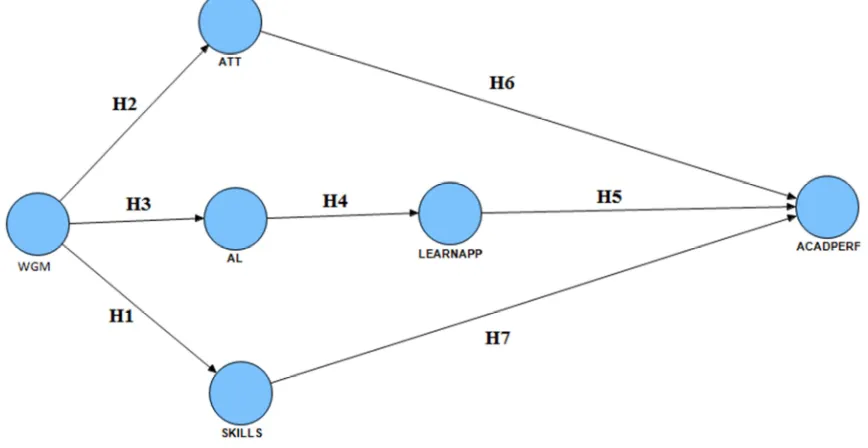
Hypothesis 1: WGM directly influences the promotion of student skills. With regard to UGM, Marra and Palmer [2] point out that students learn to appreciate different viewpoints, which improves their complex thinking skills when faced with a difficult problem and enriches their learning. On the other hand, the CL methodology encourages the development of numerous intellectual, communication, interpersonal and organisational skills [6, 20].
Hypothesis 2: WGM directly influences the improvement of student attitudes. UGM promotes greater involvement of students in the learning process, thus encouraging more active teaching than when the students work individually [21]. In turn, CL encourages the student’s active participation [22], the student’s sense of responsibility [23] and supportive attitudes among students [24].
Hypothesis 3: WGM directly influences the fostering of student attitude to learning. UGM awaken students’ interest in learning [16], and affects positively attitude to learning and students’ persistence in their studies [25]. In the case of CL, this methodology encourages students’ eagerness to learn [26], and fosters positive attitudes to learning in students and promotes social improvement as a motivation for learning [20, 27].
learning strategy [28]. Specifically, students with a positive attitude to learning adopt more cognitive and fewer surface strategies than those who develop negative attitudes [29].
Hypothesis 5: The student’s learning approach has a direct and positive effect on his/her academic performance. Learning strategies play a central and critical role in determining the student’s academic performance [30]. More specifically, the thinking activities connected with a deep approach, such as connecting ideas, structuring and synthesising, lead to better learning results than the memorising activities connected with a surface approach [31].
Hypothesis 6: The student’s attitudes have a direct and positive effect on his/her academic performance. Certain student attitudes, such as interaction with the teacher and
participation in group discussion, affect the student’s academic performance [28]. Pérez et al. [12] add that the student’s attitudes to his/her academic tasks have a decisive influence on his/her academic performance.
Hypothesis 7: The student’s skills have a direct and positive effect on his/her academic performance. Study skills constitute one of the principal pillars of the student’s academic performance, where study skills include not only appropriate studying strategies but also time management skills and other resources required by the academic task [30]. In the same way, Teachman [32] demonstrates that intellectual skills clearly determine academic performance.
Figure 1 represents the relationships between the variables in the study model proposed.
Figure 1. The PLS proposed model.
4. Method
4.1. Research Method
In order to test the relationships between indicators and latent constructs as well as the structural relationships between the latent constructs, the structural equation model (SEM) was developed. The model was designed by applying the Partial Least Squares (PLS) procedure, using Smart PLS 2.0.M3 software [33]. As the modelling of the phenomenon is in an emergent stage, the PLS algorithm was chosen according to the following criteria: PLS minimal recommendations with regard to sample size and prediction accuracy, and comparatively low demands with regard to data multinormality requirements [34]. The analysis was carried out in three stages. The model was applied first to an experimental group and then to a control group sample. Finally, the model was tested to establish whether there was a statistically significant difference between the two groups, relevant to the teaching methodologies of CL and UGM.
The model was validated in two phases: first, the
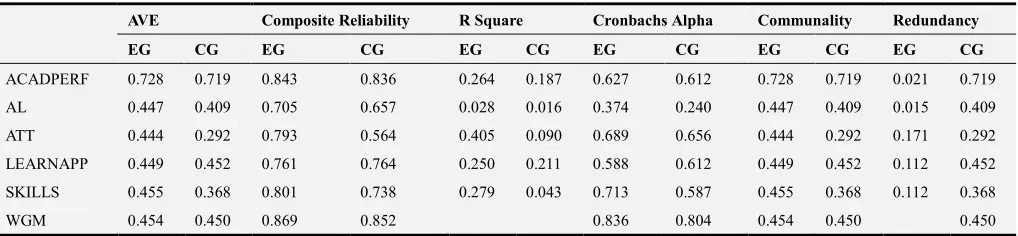
measurement model was assessed; then the structural model was evaluated. Each construct was assessed for unidimensionality, internal consistency reliability and indicator reliability, as well as for convergent and discriminant validities. All the constructs present in the model were reflective. Model quality control overviews are presented in Table 1, for both the experimental and the control group.
4.2. Data and Procedures
and 31 females, the control group of 21 males and 34 females; both groups contained high, medium and low performing students.
For the first four weeks of class, the teacher taught the first five topics of the module to both groups using the traditional lecture format [4]. At the end of this period, students of both groups took the same examination (the Corporate Finance Pre-Test), which existed in two versions, distributed randomly among the students, each containing a different set of questions on the same subject matter taught using the traditional learning method.
Over the following five weeks, the teacher worked with the students in both groups to help them to dig deeper and to put the concepts acquired into practice, but a different teaching methodology was used in each group. In group 1 the teacher used the CL methodology, in order for the groups to reach an in-depth understanding of the technical concepts and arrive at a group solution to the case studies. In group 2, however, the same teacher used the teaching method known as UGM, without giving the students guidelines on working in a group. At the end of this second five-week period, in order to test the difference in effectiveness of the two methodologies employed, both groups took the same test as before (the Corporate Finance Post-Test), but students who previously did version A now did version B, and vice versa.
4.3. Measures
The scales for the variables in this study are based on two of the questionnaires most frequently used to evaluate the learning approaches of students in higher education: Approaches to Studying Inventory (ASI) [35] and the Study Process Questionnaire (SPQ) [36]. The exception to this is the variable Academic Performance, which was measured using indicators specially designed for the present study.
Working Group Methodology was measured using the Experiences of Teaching and Learning Questionnaire (ETLQ). Academic Performance was evaluated using the Corporate Finance Test designed for the present study (average difficulty 56% and reliability 0.96, using Kuder and Richardson’s formula 21); its design consists of five theoretical and five theoretical-practical questions, which students must answer in 90 minutes, explaining their reasoning and showing the working for the theoretical-practical questions. Student Attitudes was measured using five items from the Revised Two Factor Study Process Questionnaire (R-SPQ-2F). Student Skills was evaluated using five items from the What you learnt from this course unit subscale of ETLQ. Attitude to Learning was measured using the Shortened Experiences of Teaching and Learning Questionnaire (SETLQ), which is an abbreviated version of the ETLQ questionnaire. Learning Approach was evaluated using four items from the Approaches to Learning and Studying subscale of ETLQ.
5. Analysis
All measurement items for the basic constructs of this study were adopted from the literature. Special care was taken to ensure the consistency of the construct measurement scales. All items associated with these constructs were assessed on a ten-item Likert-type scale in accordance with which respondents were asked to state their agreement with a statement on a scale ranging from 1 = ”totally disagree” to 10 = “totally agree.”
With regard to the external (measurement) model for the experimental group sample, the unidimensionality of the factors was checked using exploratory factor analysis (EFA). Factor loadings vary between 0.465 and 0.844; 70.37% of them (19 out of 27 values) have values above the 0.600 threshold, accepted as high; none is below the 0.400 threshold conventionally considered low [37]. In the control group sample, the range of values is between 0.228 and 0.803; 4 out of 27 values are above the 0.600 threshold; 18 values are between 0.600 and 0.400; and finally, 5 values are below 0.400, which is taken to be the low threshold.
In the case of the criterion for discriminant validity, the cross-loadings were obtained by correlating the component scores of each latent variable with all other items. For both groups, the loadings of each indicator are higher for its own construct than for any of the other constructs, from which it can be inferred that the model constructs differ sufficiently from one another. The purpose of this table is to demonstrate that an indicator mainly loads on the latent variable it is supposed to reflect and not on others.
As the final step in the external model validation process, its discriminant validity is assessed following the Fornell-Larcker criterion [38]. This criterion requires a latent variable to share more variance with its assigned indicators than with any other latent variable. Consequently, the AVE square root of each latent variable should be greater than its squared correlation with any other latent variable. This condition is satisfied for both groups. Latent variable correlations for both groups display moderate to low values, indicating a good convergent validity of the measures used for each variable in the model.
Table 1. Quality Criteria Overview. Experimental Group (EG) and Control Group (CG).
AVE Composite Reliability R Square Cronbachs Alpha Communality Redundancy
EG CG EG CG EG CG EG CG EG CG EG CG
ACADPERF 0.728 0.719 0.843 0.836 0.264 0.187 0.627 0.612 0.728 0.719 0.021 0.719
AL 0.447 0.409 0.705 0.657 0.028 0.016 0.374 0.240 0.447 0.409 0.015 0.409
ATT 0.444 0.292 0.793 0.564 0.405 0.090 0.689 0.656 0.444 0.292 0.171 0.292
LEARNAPP 0.449 0.452 0.761 0.764 0.250 0.211 0.588 0.612 0.449 0.452 0.112 0.452
SKILLS 0.455 0.368 0.801 0.738 0.279 0.043 0.713 0.587 0.455 0.368 0.112 0.368
WGM 0.454 0.450 0.869 0.852 0.836 0.804 0.454 0.450 0.450
Table 2 presents the values of the estimated total effects, direct and indirect, among the latent variables. For the experimental group, four path coefficients are not significant: ATT->ACADPERF (t=0.562), WGM->ACADPERF (1.354), WGM->AL (t=0.0.864), WGM->LEARNAPP (t=0.908). The remaining relationships are significant at p<0.05,
showing the influence of the change in the teaching method. For the control group, all relationships are not significant
except AL->LEARNAPP (t=3.780) and
SKILLS->ACADPERF (t=2.065), and only the latent variable path coefficient (SKILLS->ACADPERF) is statistically significant.
Table 2. Total Effects (Mean, STDEV, T-Values). Experimental Group (EG) and Control Group (CG).
Original Sample Sample Mean Standard Error T Statistics
EG CG EG CG EG CG EG CG
AL -> ACADPERF 0.221 0.024 0.228 0.047 0.078 0.106 2.844 0.223
AL -> LEARNAPP 0.500 0.459 0.515 0.513 0.117 0.122 4.266 3.780
ATT -> ACADPERF 0.099 0.412 0.106 0.191 0.176 0.269 0.562 1.531
LEARNAPP -> ACADPERF 0.442 0.052 0.441 0.086 0.101 0.201 4.378 0.256
SKILLS -> ACADPERF 0.447 0.376 0.458 0.259 0.176 0.182 2.534 2.065
WGM -> ACADPERF 0.136 0.049 0.142 0.007 0.101 0.113 1.354 0.430
WGM -> AL 0.166 0.125 0.185 0.180 0.192 0.216 0.864 0.581
WGM -> ATT 0.636 0.301 0.657 0.276 0.052 0.257 12.275 1.168
WGM -> LEARNAPP 0.083 0.058 0.086 0.089 0.091 0.115 0.908 0.500
WGM -> SKILLS 0.528 0.208 0.545 0.259 0.064 0.245 8.302 0.851
6. Results and Discussion
The analysis of the results requires, firstly, the verification of the validity of the indicators used; secondly, an assessment of the explanatory ability of the model; and thirdly, an analysis of the extent to which the variables used in the model account for the students’ academic performance.
Thus, it is firstly necessary to verify the validity of the indicators used for each of the variables mentioned in order to ensure that they measure the study variables appropriately. The analyses carried out show that these indicators explain their corresponding constructs well, that there is no overlap in the concepts of the different constructs and that the variability of each construct is better explained by its own indicators than by those of any other construct.
Secondly, the explanatory ability of the model must be analysed, in order to verify that the proposed model is capable of explaining the relationships between the study variables. To this end, the results shown in Tables 1 and 2 are evaluated below with regard to each of the hypotheses proposed in the present study.
The third and final part of the analysis of the results concerns the extent to which the variables representing the student’s learning process account for the student’s academic
performance.
Hypothesis 1 (WGM -> SKILLS) is accepted in the experimental group (R²=0.279, t=8.302), but this effect does not exist in the control group (R²=0.043, t=0.851).
Hypothesis 2 (WGM -> ATT) is accepted in the case of the experimental group (R²=0.405, t=12.275), whereas once again this is not true of the control group (R²=0.090, t=1.168).
the variables WGM and ACADPERF is 0.0028 (path value). However, with regard to the unilateral hypotheses, the level of confidence in the test for the influence of the CL methodology on attitude to learning (hypothesis 3) is 81% (t=0.864) and in the test for the influence of CL on academic performance is 91% (t=1.354); that it could be said that CL does have a significant influence on attitude to learning, which, via the approach to learning, would transfer to academic performance; nonetheless, the results do not reach a level of confidence of 95%. This interpretation is in line with the conclusions of Tran and Lewis [20], who state that CL improves student attitude to learning and who encourage the use of this teaching methodology to create a more stimulating working environment for the student. Moreover, other previous studies endorse the relationship between CL and the student’s learning approach; for example, Johnson and Johnson [4] make the point that through the use of CL students achieve a better performance because they learn more, use higher reasoning strategies, construct more complex and complete conceptual structures and retain the information learnt with greater precision.
Hypothesis 4 (AL -> LEARNAPP) is supported in the case of both groups (experimental group R²=0.250, t=4.266, and control group (R²=0.211, t=3.780).
Hypothesis 5 (LEARNAPP -> ACADPERF) is supported for the experimental group (t=4.378), but not for the control group (t=0.256). In addition, the acceptance of hypothesis 5 for the experimental group necessarily entails the acceptance of the indirect effect of attitude to learning on academic performance for the experimental group (t=2.844), with a regression coefficient between the two variables of 0.221. The opposite is the case for the control group, as the rejection of hypothesis 5 for the control group rules out this effect (t=0.223) and the regression coefficient is 0.023.
Hypothesis 6 (ATT -> ACADPERF) is rejected for both groups (experimental group t=0.562 and control group t=1.531). The rejection of this hypothesis also rules out any influence of WGM on academic performance via student attitudes (experimental group R²=0.063 and control group (R²=0,124).
More specifically, whilst the results show that CL had a direct influence on the development of the attitudes on the part of the students (t=12.275), UGM had no significant influence (t=1.168). This difference in the effect of each methodology on student attitudes may be due to the fact that with CL students depend on one another to achieve positive results as a group, which generally creates a more positive and active attitude towards learning among students than when they work with the UGM methodology. Thus, the present study confirms the findings of previous studies [40], which point out that CL promotes an attitude in the student of commitment to the good of the class, of responsibility and of perseverance in the performance of tasks. Nonetheless, this improvement in attitudes among students taught using the CL methodology was not so great as to translate into an improvement in academic results; the existence of previous studies which reach the opposite conclusion that CL does
contribute to the achievement of more favourable academic results through an improvement in student attitudes [27] raises questions as to the suitability of the Corporate Finance Test as an assessment tool, with regard not only to students’ knowledge and skills but also to their attitudes.
Hypothesis 7 (SKILLS -> ACADPERF) is accepted for both groups (experimental group t=2.534 and the control group t=2.065). The acceptance of hypotheses 1 and 7 for the experimental group necessarily entails the acceptance of the indirect effect of CL on academic performance, the regression coefficient between the two variables being 0.236 (path value). The fact that CL has a clear effect on academic performance can be explained by the significant influence of CL on two of the skills investigated in this study, cognitive skills and problem solving, which leads to better academic outcomes [4]. Moreover, the influence of CL on student skills in general can be clearly observed in the results from the model (t=8.302), and is supported by previous studies [41, 4]. In contrast with these results, those obtained with regard to UGM indicate that its influence on student skills is not significant (t=0.851). Students taught using UGM do not receive, as they do with CL, specific guidelines from the teacher as to how to discuss in a group, how to solve problems in a group and how to dig deeper into the subject matter through active listening and constructive criticism; the results show that this makes the development of these skills more difficult for them.
In summary, these results show that academic performance is explained to a greater extent by the model variables in the case of the experimental group (R²=0.264), in which CL was used, than in the case of the control group (R²=0.187), in which UGM was applied. This result is due to the fact that hypotheses 1, 4, 5 and 7 are accepted for the experimental group, entailing the influence on academic performance of four variables: the CL teaching methodology, student skills, the student’s attitude to learning and the student’s learning approach. Nonetheless, only hypothesis 7 is accepted for the control group, so that only student skills are accepted as influencing academic performance.
7. Conclusions
performance via student skills is accepted. These results are consistent with those obtained in previous studies, such as those of Johnson and Johnson [4] and Slavin [42, 40], who all demonstrate that students following the CL method obtained better academic results than those who learnt with different methodologies.
The findings of this study have implications on both the theoretical and the practical level.
Two conclusions are particularly relevant from the theoretical point of view: 1) Constructs from previous studies were used to determine the indicators used to measure the variables which play a part in the learning process, and the results of exploratory factor analysis (EFA) uphold the view that these indicators are valid; and 2) A model of structural equations has been validated which can identify the relationships between the six variables related to student learning which were chosen for this study.
From the practical point of view, seven important conclusions were arrived at, the first three of which are connected with the three processes which are the subject of the study, and the last four with other relationships between the model variables.
1) WGM does not affect students’ academic performance via student attitudes, but, in the case of CL, it can be seen that this methodology does foster student attitudes. This raises the possibility that the error is not in the model, but rather that it is necessary to find more comprehensive indicators for academic performance, capable of measuring not only the cognitive and procedural achievements of the student, but also attitudinal achievements.
2) CL influences academic performance via student skills to a significant extent, but there is no such effect when UGM is employed; thus, it has been proved that the fact that students in the experimental group worked with the guidelines and CL structure implemented by the teacher helped them to develop skills, and hence obtain better academic outcomes.
3) CL also affects academic performance via attitude to learning and learning approach, but in a way which is debatable; that is to say, if it is accepted that when CL influences attitude to learning and the student’s learning approach, it does so only in a positive sense, then it can be asserted that CL influences academic performance by this process. However, this assertion does not reach a level of confidence of 95%, for which reason its acceptance is debatable.
The four conclusions concerning other relationships between the study variables are as follows: 1) CL has a direct influence on student attitudes in the experimental group; 2) CL is an effective methodology for developing the student skills; 3) independently of the use of CL or UGM with students, the attitude adopted by students in the learning process directly influences their approach to learning; and 4) the learning approach adopted by the student has no direct influence on academic performance.
In summary, these conclusions demonstrate that, whilst both CL and UGM are methods of working in a group, the
effect of the methodology on the attitudes, skills and academic performance of the student is more beneficial when it is clearly defined and structured. For this reason, it is important for teachers to familiarise themselves with the theories underlying teaching methodologies and supported by investigation before introducing their own new guidelines in teaching [25]. For example, the approach of Student Success Skills (SSS) is a tried and tested model for group work and is endorsed by the literature [43]; it is, therefore, worth the teacher’s while to examine the effectiveness of approaches to group work which are thoroughly endorsed by scientific studies, in contrast to UGM techniques.
References
[1] Mittelmeier, J., Rienties, B., Tempelaar, D., and Whitelock, D. (2018). Overcoming cross-cultural group work tensions: Mixed student perspectives on the role of social relationships.
Higher Education, 75(1), 149-166. doi:10.1007/s10734-017-0131-3
[2] Lavy, S. (2017). Who benefits from group work in higher education? An attachment theory perspective. Higher Education, 73(2), 175-187. doi:10.1007/s10734-016-0006-z [3] Webb, N. M. (1982). Student interaction and learning in small
groups. Review of Educational Research, 52(3), 421-445. doi:10.3102/00346543052003421
[4] Johnson, D. W., and Johnson, R. T. (1999). What makes cooperative learning work. In D. Kluge, S. McGuire, D. W. Johnson, and R. T. Johnson (Eds.), Cooperative learning (pp. 23-36). Tokio: Japan Association for Language Teaching.
[5] Stahl, G. (2012) Traversing planes of learning. International
Journal of Computer-Supported Collaborative Learning, 7, 467-473. doi:10.1007/s11412-012-9159-7
[6] Johnson, D. W., Johnson, R. T., and Holubec, E. J. (1999). Los nuevos círculos del aprendizaje. La cooperación en el aula y la escuela [The new circles of learning. Cooperation in the classroom and school]. Buenos Aires: Aiqué.
[7] Brown, A. (1994) Group Work. Great Yarmouth: Ashgate Publishing.
[8] Handy, C. B. (1983). Understanding organizations. Middlesex, UK: Penguin Books Ltd.
[9] Crow, L. D. and Crow, A. (1969). Adolescent development and adjustment. New York: Mc Graw-Hill.
[10] Minbashian, A., Huon, G. F., and Bird, K. D. (2004). Approaches to studying and academic performance in short-essay exams. Higher Education, 47(2), 161-176. doi:10.1023/B:HIGH.0000016443.43594.d1
[11] Dockery, T. M., and Bedeian, A. G. (1988). “Attitudes versus actions”: LaPiere's (1934) Classic study revisited. Social Behavior and Personality, 17(1), 9-16.
doi:10.2224/sbp.1989.17.1.9
[13] Brown, P., Green, A., and Lauder, H. (2001). High Skills. Globalization, Competitiveness, and Skill Formation. Oxford, UK: Oxford University Press.
[14] Woods, D. R., Felder, R. M., Rugarcia, A., and Stice, J. E. (2000). The future of Engineering education III. Developing critical skills. Chemical Engineering Education, 34(2), 108-117. Retrieved from: http://www.che.ufl.edu/cee/
[15] Lovelace, M., and Brickman, P. (2013). Best practices for measuring students’ attitudes toward learning science. CBE-Life Sciences Education 12(4), 606-617. doi:10.1187/cbe.12-11-019
[16] Shaoan, X. I. E. (2013). Research on students’ study condition and psychology for interactive teaching model in the university. Psychology Research, 13, 1838 - 658X. doi:10.5503/J.PR.2013.13.002
[17] Gardner, R. C., and MacIntyre, P. D. (1993). On the measurement of affective variables in second language learning. Language learning, 43(2), 157-194. doi:10.1111/j.1467-1770.1992.tb00714.x
[18] Heikkilä, A., Niemivirta, M., Nieminen, J., and Lonka, K. (2011). Interrelations among university students' approaches to learning, regulation of learning, and cognitive and attributional strategies: A person oriented approach. Higher Education, 61(5), 513-529. doi:10.1007/s10734-010-9346-2 [19] Booth, K. M., and James, B. W. (2001). Interactive learning in
a higher education Level 1 mechanics module. International Journal of Science Education, 23(9), 955-967. doi:10.1080/09500690119817
[20] Tran, D. V., and Lewis. R. R. (2012). Effects of cooperative learning on students at a Giang university in Vietnam.
International Education Studies, 5(1), 86-99. doi:10.5539/ies.v5n1p86
[21] Bailey, J., Sass, M., Swiercz, P. M., Seal, C., and Kayes, D. C. (2005). Teaching with and through teams: Student-written, instructor-facilitated case writing and the signatory code.
Journal of Management Education, 29(1), 39-59. doi:10.1177/1052562904269641
[22] López, C., and Real, J. C. (2017). Efectos de la aplicación de "jigsaw" sobre la adquisición de competencias en dirección de operaciones. Revista De Métodos Cuantitativos Para La Economía y La Empresa, 24, 220-249. Retrieved from https://vpnssl.urjc.es/dana/home/index.cgi/docview/20136084 02?accountid=14730
[23] Jordan, D., and Le Metaias, J. (1997). Social skilling through cooperative learning. Educational Research, 39(1), 3-21. doi:10.1080/0013188970390101
[24] Whicker, K. M., Bol, L., and Nunerery, J. A. (1997). Cooperative learning in the Secondary Mathematics Classroom. The Journal of Educational Research, 91(1), 42-48. doi:10.1080/00220679709597519
[25] Springer, L., Stanne, M. E., & Donovan, S. S. (1999). Effects of small-group learning on undergraduates in science, mathematics, engineering, and technology: A meta-analysis.
Review of Educational Research, 69(1), 21-51. doi:10.3102/00346543069001021
[26] Hänze, M. and Berger, R. (2007). Cooperative learning, motivational effects, and student characteristics: An experimental study comparing cooperative learning and direct
instruction in 12th grade physics classes. Learning and Instruction, 17, 29-4. doi:10.1016/j.learninstruc.2006.11.004 [27] Bertucci, A., Conte, S., Johnson, D. W., and Johnson, R. T.
(2010). The impact of size of cooperative group on achievement, social support, and self-esteem. The Journal of General Psychology, 137(3), 256-272. doi:10.1080/00221309.2010.484448
[28] Mamat, N. J. Z., and Mazelan, F. F. (2011). Learning encouragement factors and academic performance. Procedia - Social and Behavioral Sciences, 18, 307-315. doi:10.1016/j.sbspro.2011.05.044
[29] Kesici, S., Sahin, I., and Akturk, H. O. (2009). Analysis of cognitive learning strategies and computer attitudes, according to college students’ gender and locus of control. Computers in Human Behavior, 25, 529-534. doi:10.1016/j.chb.2008.11.004 [30] Credé, M., and Kuncel, N. R. (2008). Study habits, skills, and
attitudes: The third pillar supporting collegiate academic performance. Perspectives on Psychological Science, 3(6), 425-454. doi:10.1111/j.1745-6924.2008.00089.x
[31] Trigwell, K. and Prosser, M. (1991). Relating approaches to study and quality of learning outcomes at the course level.
British Journal of Educational Psychology 61(3), 265-275. doi:10.1111/j.2044-8279.1991.tb00984.x
[32] Teachman, J. D. (1996). Intellectual Skill and Academic Performance: Do Families Bias the Relationship? Sociology of Education, 69(1), 35-48. doi:10.2307/2112722
[33] Ringle, C. M., Wende, S., and Will, A. (2005). SmartPLS 2.0.M3. Hamburg. Retrieved from: www.smartpls.de
[34] Henseler, J., Ringle, C. M., and Sinkovics, R. R. (2009). The use of partial least squares path modeling in international marketing. Advances in International Marketing 20, 277-320. doi:10.1108/s1474-7979(2009)0000020014
[35] Entwistle, N. J., and Ramsden, P. (1983). Understanding student learning. London: Croom Helm.
[36] Biggs, J. B. (2001). Enhancing learning: A matter of style or approach? In R. J. Sternberg, and L. Zhang (Eds.),
Perspectives on thinking, learning, and cognitive styles (pp. 73-102). Mahwah, NJ: Lawrence Erlbaum Associates.
[37] Geffen, D., Straub, D. W., and Boudreau, M. (2000). Structural Equations Models and Regression: Guidelines for Research Practice. In Communications of the Association for Information Systems, Vol. 4, Article 7 (pp. 1-79). doi:10.2307/3250956
[38] Fornell, C., and Larcker, D. F. (1981). Evaluating structural equation models with unobservable variables and measurement error. Journal of Marketing Research, 18(1), 39-50. doi:10.2307/3151312
[39] Werts, C. E., Linn, R. L., and Jöreskog, K. G. (1974). Interclass reliability estimates: Testing structural assumption.
Educational and Psychological Measurement, 34(1), 25-33. doi:10.1177/001316447403400104
[41] Lobato, C., Apodaca, P. M., Barandiarán, M. C., San José, M. J., Sancho, J. and Zubimendi, J. L. (2010). Development of the competences of teamwork through cooperative learning at the university. International Journal of Information and Operations Management Education, 3(3), 224-240. doi: 10.1504/IJIOME.2010.033547
[42] Slavin, R. E. (1996). Research on cooperative learning and
achievement: What we know, what we need to know.
Contemporary Educational Psychology, 21(1), 43-69. doi:10.1006/ceps.1996.0004