Published online November 09, 2014 (http://www.sciencepublishinggroup.com/j/ajaa) doi: 10.11648/j.ajaa.s.2014020601.15
A new additional energy source for tornadoes
Francesco Meneguzzo
1, *, Yuriy Alexeevich Baurov
2, 3, Lorenzo Albanese
11
National Research Council – Institute of Biometeorology, 8, Via G. Caproni, I-50145Firenze, Italy 2
Closed Joint Stock Company Research Institute of Cosmic Physics, 141070, Moscow Region, Pionerskaya, 4, Korolyov, Russia 3
Hotwater Srl, Via Gioberti, 15, I-56024 San Miniato (PI), Italy
Emailaddress:
[email protected] (F. Meneguzzo), [email protected] (Y. A. Baurov), [email protected] (L. Albanese)
To cite this article:
Francesco Meneguzzo, Yuriy Alexeevich Baurov, Lorenzo Albanese. A New Additional Energy Source for Tornadoes. American Journal of Astronomy and Astrophysics. Special Issue: Global Anisotropy, Theory of Byuon, New Force, New Power System, Propulsion, Space Flights. Vol. 2, No. 6-1, 2014, pp. 32-39. doi: 10.11648/j.ajaa.s.2014020601.15
Abstract:
Following earlier research aimed at detecting evidence of a connection between selected very powerful tornadoes and the global anisotropy of the physical space representing the foundation of the theory of byuons, allegedly realized by means of a positive feedback between the tornado updraft and the cosmological vector representing the global anisotropy, this article extends the analysis to a much larger database of tornadic events occurring in the continental U.S. in order to detect the fingerprint of the new proposed physical processes on the overall statistics. While the theoretical foundations of the onset and development of tornadoes are well established, some work remains to be done with particular reference to the upper tail of the energy distribution of tornadoes, where the energy developed by a single event can be as huge as 1016 J, or the equivalent of 2 Mton of TNT. In this range, additional mechanisms of energy supply in the process of development of a tornado are proposed and their fingerprint on the overall statistics are looked for. Although further analyses over different geographical areas, especially in the southern hemisphere, would be needed in order to provide a really conclusive proof, convincing evidence accumulates and points to the reality of the new proposed physical processes.Keywords:
Tornado, Fujita Scale, Theory of Byuons, New Energy, Global Anisotropy of the Physical Space1. Introduction
The nature of the origin of tornadoes, especially those developing into violent ones (F3 to F5 on the Fujita scale) has always been of great interest for researchers, since the destructive energy of such tornadoes is comparable with the energy of nuclear explosions, i.e. on the order of 20 kton of TNT, or 1014 J [1].
A great deal of theoretical and modeling work was performed regarding the onset and time evolution of tornadoes[1–3], as well as very effective conceptual models were developed, as summarized by Kufa and Snow [4].
Numerical simulations of real tornadoes sometimes suffer from significant underestimation of their intensity, even using the most advanced mesoscale or local scale meteorological models, such as the state of the art WRF-NMM model used in Litta et al. [5]: their F3 tornado occurred in India was simulated as a much weaker F0 one (peak wind speed around 20 ms-1 against the observed 70ms-1), that is most of its real energy was not caught by the simulation. Nevertheless, such models have been successfully used for the simulation and prediction of the local atmospheric “ingredients” leading to
tornadoes [6].
Besides the maximum intensity based on damages (Fujita classification) which is heavily dependent upon the strength of the winds inside the tornado, recently the path length and the path width of a tornado were included in a more comprehensive and physically consistent analysis of its overall energy in the effort to derive a power law describing the temporal behavior of tornadoes analogously to Earthquakes [7].
Some additional contribution could still be useful to explain the source of the huge energy of the most powerful tornadic events in the course of their development in time; this is the subject of the present work and will be performed in the frame of a known physical theory which application to the field of atmospheric sciences is quite recent [8].
American Journal of Astronomy and Astrophysics 2014;
well as the role of such anisotropy for the supply to tornadoes (Section 3.2.); Section results of the verification of the processes Section 3.2. as well as the respective conclusions and the perspectives for further in Section 5, the last of this article.
2. Materials and Methods
In the search for clues supporting the described in Section 3.2, tornado data including peak intensity, geographical coordinates touchdown and its path length and width are reporting worldwide lags very much behind well as the continuous and homogeneous the U.S.A., therefore all the data used in this that Country.
The data were drawn from the Storm (SPC) database [9], in the period 1954 to improvement over previous research on the the whole SPC dataset was considered, not selected events, even if the analysis of significant outbreaks carried out in that article was especially and convincing [8].
Fig. 1 shows the geographical area, covering continental U.S., considered for the tornado 30°N to 50°N, longitude 105°W to 85°W. motivated by the relative homogeneity ingredients leading to tornadic outbreaks in moist inflow from the Gulf of Mexico shear in turn connected with the mid-latitude
In order to homogenize the dataset and needed physical quantities, the original processed as follows.
Following to the information about the from tornado mean width till the year 1994 width afterwards [9], the maximum width 1995 to 2013 was turned back to the multiplying by a conversion factor which computed separately for any Fujita intensity in Table 1.
Fig. 1. Geographical area considered for the tornado
American Journal of Astronomy and Astrophysics 2014; 2(6-1): 32-39
the additional energy Section 4 shows the processes explained in respective discussion. The further work are set out
the main hypothesis including date, time, coordinates of tornado’s are needed. Tornado behind the quality as coverage used in this article refer to
Prediction Center to 2013; as a major the same subject [8], not only individual significant tornado especially significant
covering part of the tornado statistics: latitude 85°W. This choice was of the synoptic in the study area, i.e.
and vertical wind latitude jet stream [6].
and obtain all the original SPC data were
shift of reporting 1994 to maximum width reported during mean width after which value was intensity class, as shown
tornado statistics.
Table 1. Climatological mean and maximum ratio for any intensity class.
F0
Mean Width (m) 1954 – 1994 29
Maximum Width (m) 1995 – 2013 45
Mean to Maximum width ratio 0.64
The average height (h) of following Kurgansky [10], assuming mean width(d): h / d = γ = constant
central value γ = 20 was used.
maximum values for the tornado and 9,000 m, respectively [10].
As a further major improvement subject of this article [8], the (energy) was computed for each the works by Schielicke and Névir the tornado height too, the following tornado moment was used:
M = W⋅H⋅L
where M is the moment, W is the tornado height, L is the tornado average air density (approximated tornado mass-specific kinetic
<v(F)>2/2 where <v(F)> is the concerning a specific Fujita class relation of Fujita intensity scale
6.30ms−1⋅(F + 2.5)3/2where F is to F5) [7]. All the units are expressed system, therefore the unit of momentum
After discarding the events lacking total number of tornadoes occurred 40,061 out of which 18,370 F0 1,869 F3, 463 F4 and 55 F5 events.
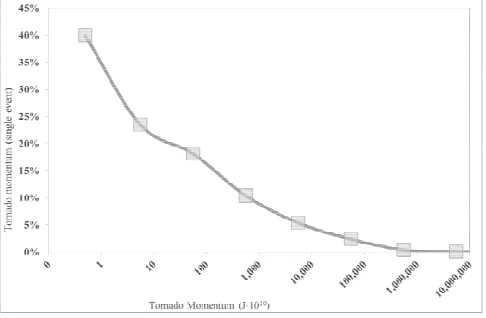
Fig. 2 shows the frequency over the whole dataset of 40,061 (Fig. 2a) and limited to values 1013 J (Fig. 2b); few events appear order of 1016 J, or 2 Mton of TNT.
(a)
33
maximum width of tornadoes and their
Fujita intensity class F0 F1 F2 F3 F4 F5
29 63 121 262 452 562
45 131 289 582 848 1,425
0.64 0.48 0.42 0.45 0.53 0.39
of a tornado was estimated, assuming its proportionality to the
constant, where γ ∼ 10-30; the used. Moreover, minimum and tornado height were set at 1,000 m
improvement over previous work on the the total atmospheric moment each tornado event based upon Névir [7,11]; having estimated following expression for the
L⋅ρ⋅e (1)
the tornado mean width, H is tornado path length, ρ is the approximated to 1 kgm-3), e is the kinetic energy, estimated as e = mean value of the wind speed class and is calculated by the scale and velocity: <v(F)> =
is the specific Fujita class (F0 expressed in MKS physical unit momentum is Joule (J).
lacking the needed details, the occurred in the study area was F0 events, 12,916 F1, 6,388 F2, events.
frequency distribution of the moment 40,061 considered tornado events values exceeding the threshold of appear to have moment on the TNT.
(b)
Fig. 2. Frequency distribution of the tornado moment: and over the threshold of 1013 J (b).
Turning to a class by class analysis, limited to F3 to F5 events, Fig. 3 shows the average moment (Fig. 3a), path length (Fig. 3b) and path width (Fig. 3c) over the whole dataset under study.
The average moment of F5 events exceeds that of F4 events by about 4 times, and the moment of F3 by more than an order of magnitude (Fig. 3a).
(a)
(b)
moment: whole data set (a)
Turning to a class by class analysis, limited to F3 to F5 events, Fig. 3 shows the average moment (Fig. 3a), path (Fig. 3c) over the whole
The average moment of F5 events exceeds that of F4 events by about 4 times, and the moment of F3 by more than
(c)
Fig. 3. Average moment (a), path length (b) and events falling into the F5, F4 and F3 Fujita classes.
It arises that the large differences moment, computed according the different mean values of the specific, and therefore to the different energy, because the path length height) contribute significantly overall average moment.
This evidence points to a significant rotational velocity, width and tornadoes, supporting the idea mechanism working at least for which will be discussed in the next
3. Theoretical Insights
3.1. The Global Anisotropy of the Byuon Theory
In [12,13] the earliest experiments fundamental anisotropy of the new non-gauge interaction, different ones (strong, weak, electromagnetic, first detected. Besides the lack important feature of this new interaction that arises in a wide range
interactions, i.e. 10−19 m [14], up 1021 m [15], and more [16].
The physical nature of the new force is explained by the byuon theory, a non-gauge theory of the formation of the physical space and the world of elementary particles from some unobservable objects called “byuons”
According to the byuon theory
physical fields can act upon the process of mass formation of the elementary particles because a fraction of su
associated with the formation of their inner space, is proportional to the modulus of a summary potential A the sum of the potentials of all known force fields calculated using the energy relation expressed by Eq. (3.1.) in Baurov and Malov [21]. Such summary potential cannot exceed, by
(c)
Average moment (a), path length (b) and path width (c) for tornado events falling into the F5, F4 and F3 Fujita classes.
differences in the average tornado to Eq. (1), is due not only to the wind speed, which are
class-different mass-specific kinetic length and width (and consequently significantly to further differentiate the
significant relationship between and lifetime (path length) of idea of common underlying for the most energetic events, next Sections.
Insights
the Physical Space and the
experiments are described where a the physical space as well as a different from the four known electromagnetic, and gravitational), were lack of gauge invariance, an interaction is just its anisotropy range of sizes, from the weak up to the size of our Galaxy, i.e.
The physical nature of the new force is explained by the gauge theory of the formation of the physical space and the world of elementary particles from
rvable objects called “byuons” [17–19].
American Journal of Astronomy and Astrophysics 2014;
magnitude, the modulus of the cosmological vectorial potential Ag, a new fundamental constant
value |Ag| ≈ 1.9⋅105 T⋅m.
As the result of the action of the field potentials (decreasing |AΣ|), each particle gains an energy
corresponds to a new force of nature throwing substance out of the region with the weakened A
investigations with the use of gravimeters and magnets [17,18], and plasma systems [17,18,22]
measurements of changes in the β-decay rate of radioactive elements [14,17,18,23], that were later confirmed by independent researches [24], have shown that the substance is ejected from the region with the weakened A
with an angular opening about 100° around the vector A determining the global anisotropy of the physical space.
In [20] the following astronomical coordinates in the second equatorial system were determined for the vector and therefore for the global anisotropy of the physical space:α≈300°±10°, δ≈36°±10°, where
ascension and δ is the declination, as the most exact results so far.
Fig. 4 shows the direction of the cosmological potential Ag projected onto the Earth’s
representing the direction of the global physical space.
Fig. 4. Projection of the cosmological vector potential A Earth’s orbital plane; VE is the Earth’s instantaneous velocity vector.
Fig. 5 shows the dependence of the cosmological vector Ag on the local solar
Standard Time (CST) across the year, every starting on mid-February, at two sites (35°N ; 95°W) (Fig. 5a) and (45°N ; 95°W) shown in Fig. 1 (year 2001 is considered, annual change during the study period small). Troughs and peaks move backward hours per month; the Ag altitude range is apparently
35°N (approximately -20° to 87°) than at 45°N therefore the time of residence of the altitude (i.e. Ag lying around the local horizontal
with increasing latitude.
The analysis of a long run of experiments
American Journal of Astronomy and Astrophysics 2014; 2(6-1): 32-39
magnitude, the modulus of the cosmological vectorial a new fundamental constant having absolute
As the result of the action of the field potentials |), each particle gains an energy ∆m⋅c2 that corresponds to a new force of nature throwing substance out of the region with the weakened AΣ. Experimental investigations with the use of gravimeters and magnets [17,18,22], as well as the decay rate of radioactive , that were later confirmed by , have shown that the substance is ejected from the region with the weakened AΣ along a cone around the vector Ag
he physical space. the following astronomical coordinates in the second equatorial system were determined for the vector Ag
for the global anisotropy of the physical 10°, where α is the right declination, as the most exact results
cosmological vector Earth’s orbital plane, anisotropy of the
Projection of the cosmological vector potential Ag onto a simplified
is the Earth’s instantaneous velocity vector.
the altitude of the solar time, or Central every two months with coordinates 95°W) (Fig. 5b), as considered, with the
being negligibly backward in time by two apparently larger at 45°N (-10° to 81°), altitude itself around 0° horizontal plane), decreases
experiments has shown that
the new force has a nonlinear and be represented as a complex series summary potential AΣ as per Eq.(4) [13,17,18]).
(a)
(b)
Fig. 5. Dependence of the altitude of the the local solar time (CST) at sites with (45°N ; 95°W).
The first term of the series is
F = 2Nmvc2λ
12∆A
where N is the number of stable and neutrons) in the test body, changes of the summary potential a test body and sensor element, space of the difference potentials arc of a circle for experiments space coordinate; 2mvc2 = 33 eV
coefficient of the series. The fundamental research physical space along with the based upon such anisotropy is
which includes all the relevant bibliography. The revealed anisotropic properties were found to affect as well processes such as the strongest chance for a deeper understanding
35
and nonlocal character and can series in terms of changes of the Eq.(4) in Baurov [21] (see also
(a)
(b)
the cosmological vector potential Agon
with coordinates (35°N ; 95°W) (a) and
the following:
AΣ[∆(∆AΣ)/∆x] (2)
stable particles (electrons, protons, body, ∆AΣ is the difference in potential AΣ at the location points of element, ∆(∆AΣ)/∆x is the gradient in
potentials ∆AΣ ; x is the length of an experiments with solenoids, therefore a eV;λ1 = 10-6 (T⋅m)-1 is the first
of the global anisotropy of the basics of the byuon theory is summarized in Baurov [20]
bibliography.
framework for a possible prediction in future [25].
The following few consequences of the byuon theory are most important in the context of this article:
The potential of the Earth’s gravitational field is always negative and decreases in absolute value with height from the local surface, therefore as per Eq. (2) a particle rising from the surface with high enough speed, experiencing a substantial rate of decrease of the gravitational potential, is subjected to an upward force towards higher values of the summary potential AΣ.
Quantum states of the byuons interact in regions of weakened summary potential to minimize their potential energy, creating the fundamental one-dimensional physical space along with rotation of the material substance around an axis perpendicular to the cosmological vector potential Ag, which arises from the residues of such minimization [17–19]. More precisely, most of the residual potential energy of interaction of byuons in the fundamental one-dimensional space created by the byuons themselves converts into the spin of primary particles, such as the electron, any lepton, etc., as well as into its mass; according to the byuon theory, any natural rotation such as the rotation of planets, stars, galaxies and the expected rotation of the Universe, arises from this mechanism of minimization of the potential energy of interaction of byuons [17–19].
3.2. Tornadoes and the Global Anisotropy of the Physical Space
Whatever the processed leading to the onset of a tornado, afterwards it can further accumulate energy along its path by means of well understood processes [2,3]; two further concurrent processes are proposed here, which are thought to sustain or reinforce a tornado during its development.
The first process stems from the consideration, already expressed in Section 3.1., that the reduction of the summary potential AΣ by means of the Earth’s gravitational potential, that is always negative, is stronger near the Earth’s surface than at any height along the local vertical axis; therefore, according to Eq. (2) the flow in an updraft is further accelerated at the expense of the gravitational potential in the direction of the increasing summary potential, which coincides with the direction to the local zenith.
Such process appears similar to the one described in [18,26,27]: during the motion of a liquid substance powered by a centrifugal pump, in a closed circuit having ascending and descending sections (height between 2.6 m and 4 m), excess heat is generated at the level of at least 30% more than the input energy, which can’t be explained from the perspective of standard calibrated physical models. Of course, the stronger the updraft, the greater the acceleration because the uprising particles experience a faster change (decrease) of the summary potential.
The second process is likely even more important and specific to tornadoes. Recalling Section 3.1., any natural
rotation arises from the mechanism of minimization of the potential energy of interaction of byuons in their fundamental one-dimensional space [19].
The latter applies as well to a tornado that can gain a fraction of energy of its rotational motion from the minimization of the potential energy of interacting byuons in regions with summary potential weakened by means of the Earth’s gravitational potential; provided that the cosmological vector potential lies around the horizontal plane tangent to the local Earth’s surface, this process results in the generation of further rotation around the vertical axis of any particle while rising in the violent updraft associated to the tornado, thus further contributing to the energy and lifetime of the tornado itself.
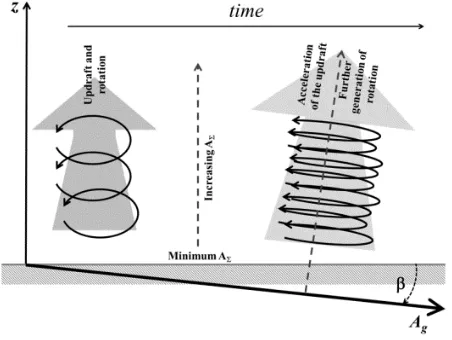
Fig. 6 shows a very simplified scheme of the proposed processes contributing to the energy of a tornado system.
It should be noted that a small deviation of Ag with regards
to the horizontal plane, represented by the angle β in Fig. 6, could be even more favorable for the energy supply to the tornado because the vertical wind shear, which is a necessary synoptic ingredient for its onset, effectively tilts the tornado axis from the vertical; as a first guess, the optimal value for the angle β could be in the range 10° to 20°, positive (upward) or negative (downward).
Fig. 6. Very simplified scheme of the proposed processes contributing to the energy of a tornado system: Ag is the cosmological vector potential and β is
its altitude with regards to the local Earth’s surface (shaded in the picture).
As a result, the new proposed mechanisms could help to discriminate situations favorable for the further accumulation of energy into a tornado and therefore its development into a high intensity and/or long lifetime or path system.
4. Results and Discussion
American Journal of Astronomy and Astrophysics 2014;
With a substantially larger dataset such available for this research, the advanced hypotheses leave their fingerprint in the overall statistics violent tornadoes.
Fig. 7(a-f) shows the frequency distribution tornado moment along with the significant individual events, i.e. moment (Fig. 7a and length (Fig. 7c and Fig. 7d) and mean path Fig. 7f), as functions of the altitude of vector potential Ag in intervals of 10°, Fujita classes F5 (Fig. 7a, Fig. 7c and Fig. 7b, Fig. 7d and Fig. 7f). The range of altitudes during the tornado lifetime is shown only moment greater than 2⋅1015 J.
(a)
(b)
(c)
American Journal of Astronomy and Astrophysics 2014; 2(6-1): 32-39
such as the one hypotheses should statistics of the most
distribution of the total significant features of and Fig. 7b), path width (Fig. 7e and the cosmological separately for the Fig. 7e) and F4 (Fig. altitudes of Ag occurred only for events with
(d)
(e)
(f)
Fig. 7. Distribution of the overall tornado moment and moment of individual events (a, b), path length (c, d), mean path width (e, f) for F5 (a, c, e) and F4 (b, d, f) events, as functions of the altitude of the vector A
The total moment for the distribution with a very high peak -20° to -10°, a substantial fraction (about 18%) and a secondary smaller 8%). No significant events are than 30°. Moreover, looking at the vast majority of F5 tornadoes energetic ones occur with Ag altitudes
with the biggest values between
37
(d)
(e)
(f)
Distribution of the overall tornado moment and moment of individual events (a, b), path length (c, d), mean path width (e, f) for F5 (a, c, e) and F4 (b, d, f) events, as functions of the altitude of the vector Ag..
relevant events occur with Ag altitudes between 10° and 25° (always with some fraction of the lifetime spent with Ag
altitudes lower than 20°), a “dip” in the distribution of significant events arises approximately between -5° and 10°, all in all supporting not only the overall theoretical approach about the existence of a new energy source feeding violent tornadoes, but also the further hypothesis about the role of the vertical tilting of tornadoes described at the end of Section 3.2.
The above tentative conclusion is further confirmed by the analysis of the total moment of F4 events, which shows exactly the same qualitative features as for F5 events, but with a much less sharp and broader distribution, with the biggest peak reaching just 35%, no “dip” of individual significant events arising around 0° and few significant tornadoes occurring with Ag altitudes as large as about 70°
(Fig. 7b). In other words, the intensity of tornadoes and therefore of the associated updraft looks like to activate a positive feedback with the energy feeding mechanisms proposed in Section 3.2.
Turning to the analysis of the tornado path length, which is indicative of the lifetime of the event, spans more than one order of magnitude and therefore contributes significantly to the overall tornado moment, the difference between F5 and F4 events is striking: practically all significant events (moment greater than 2⋅1015 J, as shown by the presence of the interval of Ag altitudes) in the F5 class occur with Ag altitudes in two intervals, i.e. between -20° and -5° and between 10° and 25°, with much smaller path lengths at higher altitudes (Fig. 7c); conversely, the distribution of path lengths with Ag altitudes is much broader and scattered when it comes to F4 events, which show few events with large path length even beyond 40°. Nevertheless, the majority of most energetic tornadoes still do show the largest path lengths between -20° and 20° (Fig. 7d).
While spanning less than one order of magnitude, at least for the most energetic events, the mean path width still contributes significantly to the overall moment due to its connection with the tornado height, as explained in Section 2. Although the above considerations for the path length remain valid for the mean path width at least qualitatively, the charts are somehow less informative (Fig. 7e and Fig. 7f), likely due to the inherently greater uncertainty in the assessment of this quantity. Beyond the usual “bimodal” distribution around the altitude 0°, evident for the F5 events and missing for the F4 tornadoes, the most striking difference appears to be the absence of mean path widths larger than 500 m for the F5 events for Ag altitudes exceeding 40°, while values greater
than 500 m are still common up to the higher altitudes for F4 events.
All the above considerations appear in very good agreement with previous findings [8], as well as supportive of the hypothesized new mechanisms of energy supply to the most violent tornadoes by means of a positive feedback between updraft (and therefore rotation velocity) and the fundamental anisotropy of the physical space.
It should be noted however that the astronomical
configuration doesn’t help very much because it happens that the Ag vector altitudes are around zero in the study area (as well as at any other site with the same latitude in the northern hemisphere) during the most favorable times of the day for the development of significant tornadoes, i.e. in the early to mid-afternoon, during the spring months, when solar heating is intense and growing, sea surface temperatures in the Gulf of Mexico are quickly rising and the jet stream flows still at sufficiently southern latitudes thus providing the needed vertical shear, moreover with residence time near 0° decreasing northward, i.e. towards colder areas where violent tornadoes are less likely to occur.
As a consequence, an even more definitive proof of the theory described in this article could be achieved after performing a similar study elsewhere in the northern hemisphere, e.g. in Europe, and – more important – in the southern hemisphere where the vector Ag is approximately reversed with regards to the horizontal plane, i.e. points downward during most of the time.
5. Conclusions
The main aim of this article was to detect the fingerprint of an hypothesized new energy source for violent tornadoes realized by means of a positive feedback between the tornado updraft and a fundamental anisotropy of the physical space.
The global anisotropy of the physical space was detected by means of a long series of experiments as well as observations of different natural systems at virtually any scale of the Universe, from the weak interaction to the meta-galactic ones; on its basis the byuon theory (Section 3.1.) was built since the early 1990s’, today allowing consistent explanations to a variety of physical phenomena covering the fields of nuclear physics, astrophysics, geophysics, as well as offering the chance to harness a new energy source [17,18,20].
Following earlier research and in agreement with previous findings [8], this article extends the analysis of the hypothesized connection between the theory of byuons and the energy balance of the most violent tornadoes, which are likely the most powerful phenomena at scales from hundreds of meters to tenths of km in the Earth’s atmosphere.
The additional convincing evidence provided in Section 4 on the basis of the largest available database makes even more difficult to dismantle the theoretical approach to the new source of energy sustaining the most powerful tornadoes.
As a consequence, it’s possible to state that the most powerful tornadoes can occur only at specific times of the day which depend on latitude time of the year.
American Journal of Astronomy and Astrophysics 2014; 2(6-1): 32-39 39
Acknowledgments
The authors gratefully acknowledge M. Pagliaro for the outstanding support and motivation by means of the SuNEC 2013 Conference.
Appendix
Abbreviations used in this article: AΣ = Summary vector potential (T⋅m) Ag = Cosmological vector potential (T⋅m)
CST = Central Standard Time TNT = Trinitrotoluene
References
[1] S.A. Arsen’yev, Mathematical modeling of tornadoes and squall storms, Geosci. Front. 2 (2011) 215–221.
[2] S.A. Arsen’yev, N.K. Shelkovnikov, Electromagnetic fields in tornados and spouts, Moscow Univ. Phys. Bull. 67 (2012) 290–295.
[3] A.Y. Gubar, A.I. Avetisyan, V. V Babkova, Tornado rise: 3D numerical model in the mesoscale turbulence theory of Nikolaevskiy, Dokl. Earth Sci. 419 (2008) 467–472.
[4] N. Kufa, R. Snow, Lightning: meteorology’s new tool, in: 86th AMS Annu. Meet. (Atlanta, GA). Second Conf. Meteorol. Appl. Light. Data, American Meteorological Society, 2006.
[5] A.J. Litta, U.C. Mohanty, S. Kiran Prasad, M. Mohapatra, A. Tyagi, S.C. Sahu, Simulation of tornado over Orissa (India) on March 31, 2009, using WRF–NMM model, Nat. Hazards. 61 (2011) 1219–1242.
[6] A.E. Mercer, C.M. Shafer, C.A. Doswell, L.M. Leslie, M.B. Richman, Objective Classification of Tornadic and Nontornadic Severe Weather Outbreaks, Mon. Weather Rev. 137 (2009) 4355–4368.
[7] L. Schielicke, P. Névir, Comprehensive analysis of tornado statistics in comparison to earthquakes: intensity and temporal behaviour, Nonlinear Process. Geophys. 20 (2013) 47–57.
[8] Y.A. Baurov, I.F. Malov, F. Meneguzzo, Tornadoes and the global anisotropy of the physical space, Am. J. Mod. Phys. 3 (2014) 93–112.
[9] SPC, Storm Prediction Center — severe weather database files (1950–2013), (2013).
[10] M. V Kurgansky, The statistical distribution of intense moist-convective, spiral vortices in the atmosphere, Dokl. Earth Sci. 371 (2000) 408–410.
[11] L. Schielicke, P. Névir, Introduction of an atmospheric moment combining Eulerian and Lagrangian aspects of vortices: Application to tornadoes, Atmos. Res. 100 (2011) 357–365.
[12] Y.A. Baurov, E.Y. Klimenko, S.I. Novikov, Experimental
observation of space magnetic anisotropy, Phys. Lett. A. 162 (1992) 32–34.
[13] Y.A. Baurov, Space magnetic anisotropy and a new interaction in nature, Phys. Lett. A. 181 (1993) 283–288.
[14] Y.A. Baurov, A.A. Konradov, V.F. Kushniruk, E.A. Kuznetsov, Y.G. Sobolev, Y. V. Ryabov, et al., Experimental investigations of changes in beta-decay rate of 60Co and 137Cs, Mod. Phys. Lett. A. 16 (2001) 2089–2101.
[15] I.F. Malov, Y.A. Baurov, The distribution of space velocities of radio pulsars, Astron. Reports. 51 (2007) 830–835.
[16] Y.A. Baurov, The Anisotropy of Cosmic Rays and the Global Anisotropy of Physical Space, J. Mod. Phys. 03 (2012) 1744– 1748.
[17] Y.A. Baurov, On the structure of physical vacuum and a new interaction in Nature (Theory, Experiment and Applications), Nova Science, NY, 2000.
[18] Y.A. Baurov, Global Anisotropy of Physical Space, Experimental and Theoretical Basis, Nova Science, NY, 2004.
[19] Y.A. Baurov, I.F. Malov, On the Nature of Dark Matter and Dark Energy, J. Mod. Phys. 01 (2010) 17–32.
[20] Y.A. Baurov, Research of global anisotropy of physical space based on investigation of changes in β and α-decay rate of radioactive elements , motion of pulsars and anisotropy of cosmic rays, Am. J. Mod. Phys. 2 (2013) 177–184.
[21] Y.A. Baurov, I.F. Malov, Variations of Decay Rates of Radio-active Elements and their Connections with Global Anisotropy of Physical Space, Int. J. Pure Appl. Phys. 6 (2010) 469–482. Also at: http://arxiv.org/abs/1001.5383.
[22] Y.A. Baurov, I.B. Timofeev, V.A. Chernikov, S.F. Chalkin, A.A. Konradov, Experimental investigations of the distribution of pulsed-plasma-generator radiation at its various spatial orientation and global anisotropy of space, Phys. Lett. A. 311 (2003) 512–523.
[23] Y.A. Baurov, Y.G. Sobolev, Y. V. Ryabov, V.F. Kushniruk, Experimental investigations of changes in the rate of beta decay of radioactive elements, Phys. At. Nucl. 70 (2007) 1825–1835.
[24] P.A. Sturrock, J.B. Buncher, E. Fischbach, D. Javorsek II, J.H. Jenkins, J.J. Mattes, Concerning the Phases of the Annual Variations of Nuclear Decay Rates, Astrophys. J. 737 (2011) 65.
[25] Y.A. Baurov, A.A. Spitalnaya, A.A. Abramayan, V.A. Solodovnikov, Seismic activity of the earth, the cosmological vectorial potential and method of a short-term earthquakes forecasting, Nat. Sci. 03 (2011) 109–119.
[26] Y.A. Baurov, F. Meneguzzo, A.Y. Baurov, A.Y.J. Baurov, Plasma Vacuum Bubbles and a New Force of Nature , The Experiments, Int. J. Pure Appl. Sci. Technol. 11 (2012) 34–44.