http://www.sciencepublishinggroup.com/j/earth doi: 10.11648/j.earth.20180704.12
ISSN: 2328-5974 (Print); ISSN: 2328-5982 (Online)
Kuqa Complex Surface Area Pseudo 3D Near-Surface
Modeling and Static Correction Techniques
Lyu Jingfeng
*, Zhou Bingfeng, Li Zhiliu
Bureau of Geophysical Prospecting Incorported, China National Petroleum Corporation, Zhuozhou, China
Email address:
*
Corresponding author
To cite this article:
Lyu Jingfeng, Zhou Bingfeng, LI Zhiliu. Kuqa Complex Surface Area Pseudo 3D Near-Surface Modeling and Static Correction Techniques.
Earth Sciences. Vol. 7, No. 4, 2018, pp. 151-157. doi: 10.11648/j.earth.20180704.12
Received: May 22, 2018; Accepted: June 8, 2018; Published: July 5, 2018
Abstract:
Having been one of the key areas for hydrocarbon prospection of Tarim Oilfield Company, Kuqa Mountain in Tarim Basin has significant LVL survey, modeling difficulty and statics problems due to its diversified near-surface conditions. In this paper, the author makes an accurate analysis on the near-surface structure in the area using the uphole-constraint shallow-layer tomography LVL surface method, the pseudo 3D near-surface modeling and the comprehensive statics technology and therefore, the imaging of sections is improved, which provides a reference for the near-surface modeling and statics works in similar areas.Keywords: Mountain, LVL Survey, Near-Surface Modeling, Statics, Pseudo 3D Tomography
1. Introduction
The Kuqa foreland basin of Tarim is rich in oil and gas resources and has huge exploration potential, so it plays an important role as one strategic area of substitution for energy in China. From the end of the last century to the beginning of this one, in the Kuche Foreland Basin, a number of large-scale natural gas fields were discovered, such as Kela 2, Dina, Dabei 1 and so on, which led to the startup of the project of natural gas transmission from West to East China and became the main gas source for transmission. Therefore it has made a tremendous contribution to Xinjiang's economic development and has changed China's energy structure[1].
The Kuqa foreland basin is characterized of typical features of mountainous foreland in western China. There are many various landform types, including mountains, alluvial fans, Gobi, farmland, villages, rivers and gullies. And moreover, the near-surface lithology is very complex and variable, full of Quaternary gravel deposits, gravel hills of Xiyu Group and sand-mudstone mountains Neogene and Paleogene. Consequently, the velocity and thickness of near-surface vary drastically in both vertical and lateral directions.
The complicated near-surface structure of Kuqa poses the following challenges to field static correction work. Firstly, the
near-surface survey is difficult. The Kuqa piedmont area has a very thick Gobi gravel layer with a wide distribution range. The thickness of the weathered zone is quite thick, even up to more than 200m, so the survey accuracy using the shallow refraction method is very low. However application of uphole survey for near-surface investigation in a large area is very time-consuming and expensive. Secondly, a reasonable near-surface model in field is not easy to build accurately. Near-surface modeling generally applies the inter-layer relationship coefficient method. The near-surface model is established by interpolating the interpretation results of uphole surveys, so the accuracy of the model depends heavily on the density and distribution of upholes. Thirdly, statics correction is challenging as well. In the Kuqa depression, seismic survey is mainly troubled by complex wave field and low signal-to-noise ratio, resulting from the seismic geological conditions of the piedmont zone. Since the accuracy of statics correction will directly affect the imaging quality of the final section, higher requirements are imposed on the statics correction technique.
2. Near-Surface Modeling and Static
Correction Methods
Earth Sciences 2018; 7(4): 151-157 152
characteristics of the Kuqa survey area itself into account, the following key technical measures are taken.
2.1. The Method of Uphole Constrained Tomography for Near-Surface Investigation
For the areas covered by thick Gobi gravel, near-surface tomographic survey methods can be used. In field, near-surface tomographic surveys are performed by placing a spread, in which the coordinates and elevations of each shot and receiver point are actually measured. The tomographic inversion is applied and interpreted indoors based on first-arrival time picked up. Finally, the uphole surveys are incorporated and used to calibrate tomographic inversion, to reveal the near-surface structure of the thick Gobi gravel area [2].
2.1.1. Parameters Determination
The tomographic survey parameters of shallow layers can be determined by testing or analyzing 2D survey lines with small receiver distances in the survey area, and can also be determined by numerical seismic forward modeling. In order to ensure the interpretation accuracy of near-surface tomography and control survey cost, the following factors must be well taken into account during the determination of each parameter:
1 The number of receivers must not exceed the upper limit of the number of receiving channels of the seismograph;
2 Smaller receiver interval;
3 The spread length is long enough to capture the high speed required for inversion;
4 Reasonable number of shots and shot interval.
2.1.2. Applicable Conditions Analysis
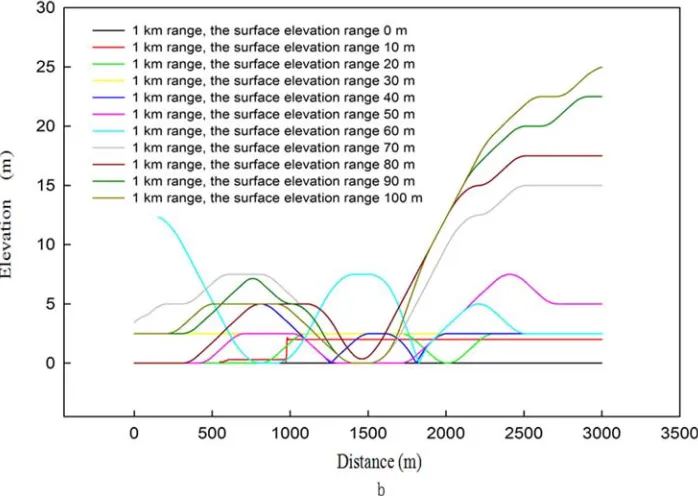
However, this method has certain limits on the surface topography. It will produce large errors in the case of dramatic surface fluctuations. According to the results of the field uphole surveys, different near-surface models are established with gradual surface undulation. The weathered zone in blue is with velocity 1350 m/s, and high velocity layer in red is
Figure 1. An analysis to the error caused by surface elevation fluctuation.
2.2. Pseudo 3D Near-Surface Modeling
Due to the wide distribution of thick Gobi gravel areas and the large thickness of weathered layers, and limited by the available drilling ability of drilling rigs and the exploration cost, the number of uphole surveys the area is relatively small. It is difficult to construct a near-surface model reasonably using the surface modeling method and then the field static correction values derived in field are less accurate. However, the areas with thick Gobi gravel have a relatively flat topography, with a stable, gradual, and relatively small elevation difference. This is favorable to the applicable conditions of the shallow tomographic survey method, and surface modeling method based on pseudo 3D tomography can be performed to establish the near-surface model in this area, so that the derived near-surface model can meet the needs of field processing. The existing 2D data in the area is fully used and the 2D surveys are dense enough (The implementation of shallow tomographic inversion should be considered if the density is not good enough.). And then first-arrivals of each 2D line are picked up, and then all data of 2D survey lines are built into a sparse 3D database [3]. The unified tomographic inversion is performed for the surface model of thick Gobi gravel areas, and finally the near-surface model of the entire area of interest is established in combination with the uphole surveys of the mountain areas and field model statics can be provided.
2.3. Comprehensive Static Correction Technology
There are many kinds of static correction methods. The most commonly used static correction methods in the complex mountainous areas in Western China are near-surface model, refraction static correction, and tomographic inversion[4-6].
2.3.1. Adaptability and Characteristics of Different Statics
The near-surface model static correction method is suitable for regions where the near-surface structure is relatively simple, and the velocity and thickness of near-surface are relatively stable vertically and horizontally. The advantage of this method is that the near-surface model can be built with high efficiency and it can solve mid- and long-wavelength statics problems. The disadvantage is that its accuracy depends heavily on the precision and density of surface surveying control points, and the accuracy of the inter-layer relationship coefficients. Meanwhile, it is relatively weak for this method to solve short-wavelength static correction problems.
The refraction static correction method is suitable for areas with known surface layer velocities or thicknesses and stable refractive layers, especially in mountainous regions with evident stratification, and in mountainous regions with old strata exposed to surface. Because this method uses a layered model and cannot simulate the velocity variation in layers, it is not suitable for solving the near-surface velocity model without a apparent refraction interface or with velocity reversal or layer pinching[7]. The advantage is that it can provide high-quality short-wavelength static correction and effectively improve the imaging quality of the section under the premise of accurate initial conditions and reasonable stratification. The disadvantage is that cross-layer phenomenon may occur in the process of refraction calculation without a stable refractive interface, thereby reducing the accuracy of the static correction. And moreover, the long-wavelength static correction is readily degraded when the initial conditions and the defined refractive layers cannot well correspond to each other [8].
Earth Sciences 2018; 7(4): 151-157 154
restricted by the surface conditions, and is suitable for the calculation of static correction in various complex surface areas. In particular, in Gobi gravel area where the weathered layer is extremely thick, the mid- and long-wavelength static correction can be solved effectively [9-11]. The velocity model needs to be smoothed during the inversion process, which results in a certain loss of high-frequency information of the near-surface model. Therefore, the high frequency components are relatively inadequate when calculating the static correction, resulting in weakness in improving the imaging accuracy of the section, so some oriented measures must be taken to make up for it.
2.3.2. Comprehensive Static Correction Technology
Considering that it is difficult to solve the problem with a single static correction method under complicated near-surface conditions in the Kuche area, considering the advantages of fusion chromatography and refraction static correction, a comprehensive static correction technique is used to solve the static correction problem in this area [12]. This study was achieved through static correction and splicing.
(1) The static correction amount splicing is to smooth the different static correction amount through a uniform smoothing parameter, and the smoothed value is a low-frequency component of the static correction amount, and the smoothed value minus the smoothed value is the high-frequency static correction amount. On the basis of unified low-frequency static correction, various high-frequency static correction imaging advantages are combined to achieve the ultimate goal of improving cross-sectional imaging. However, this method has certain drawbacks. If the smoothing parameters cannot be reasonably determined, it may cause artificially mid- and long-wavelength static corrections.
(2) Model splicing Realization of the comprehensive static correction technique mainly includes the following steps: (1) Performing tomographic inversion and refraction inversion to obtain different near-surface models; (2) Identifying the advantages range and boundary of different static correction methods through section comparison; 3 determine the range of the model transition zone near the boundary line; 4 keep the respective inversion model in the dominant region of the refraction method and the tomography; 5 determine the weight coefficient of the thickness and velocity of the LVL in the transition zone; 6 calculate according to the formula Low-speed belt thickness and speed in the transition area; 7 Comprehensive static correction calculation all over the whole survey area.
The key of the model fusion method lies in the transition zone, in which the thickness and velocity of the LVL can be calculated based on the following formula:
hC= hT*nT+hR*nR (1)
VC= VT*nT+VR*nR (2)
In the formula: hC is the thickness of LVL in the transition zone; hT is the thickness of LVL from tomographic inversion; nT is the weight coefficient of tomographic inversion, and its value is 1 in the Gobi zone, 0 in mountainous zone and gradual transition between 1 and 0 from Gobi to mountain; hR is the thickness of LVL from refraction inversion; nR is the weight coefficient of refraction inversion, which is 1 in mountainous area, 0 in the Gobi zone, and a gradual transition in the middle; VC is velocity of LVL in transition zone; VT is the velocity of LVL from tomographic inversion; VR is the velocity of LVL from refraction inversion.
3. Field Application Case Study
In 2013, the above techniques were applied to a 3D seismic survey for overcoming surface modeling and static correction in the Kuqa area, and achieved good results.
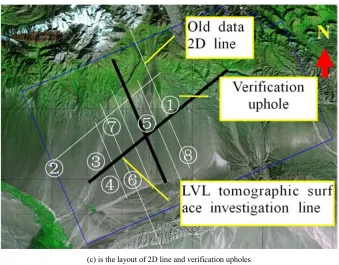
First, on the basis of the LVL tomographic survey, the application of pseudo 3D tomographic modeling techniques well reveal the near-surface structure of Gobi gravel of considerable thickness. Two 2D seismic surveys, a fixed length spread of 4 km, with 20m receiver interval, 120m shot interval are performed in the areas with thick weathered layer. All 2D survey lines are incorporated to make the density of 2D surveys to2km×6km, and then a sparse 3D survey is formed, combined with the previous 2D survey lines (30m receiver interval, 60m shot interval). Then the near-surface model of the thick Gobi gravel areas is obtained in a way of 3D tomographic inversion, and finally the near-surface model of the whole survey is established with uphole surveys in mountainous areas incorporated.
(a) is the high-velocity top surface elevation plan for the 3D work area
Earth Sciences 2018; 7(4): 151-157 156
(c) is the layout of 2D line and verification upholes
Figure 2. The high-velocity top surface elevation, surface elevation plan and the 2D line layout in the work area.
Secondly, the application of the comprehensive static correction technique (Figure 3a) has not only the advantage that profile imaging quality is improved by tomographic statics in Gobi gravel area (Figure 3b), but the feature that the refraction statics is favorable to imaging in mountainous area
(Figure 3c). So it truly strengthens its advantage but avoids its shortcomings, greatly improves the accuracy of the first-break static correction, and effectively improve the imaging quality of profile.
Where a stands for the comprehensive static method; b stands for the tomographic static method; and c stands for the refraction static method.
Figure 3. Comparison of the time primary stack section effects for different static methods.
Table 1. Comparison of the LVL thickness for different surface investigation methods.
No. Uphole Thickness (m) Pseudo 3D tomography Near surface modeling thickness (m) Error (m) Per cent
1 76.6 73.8 -2.8 -3.6%
2 69.1 67.2 -1.9 -2.7%
3 86.1 84.1 -2.0 -2.3%
4 67.8 71.5 3.7 5.4%
4. Conclusions
The high-accuracy near-surface model is not only the premise and basis of the refraction-wave and the tomographic inversion static method, but also one of the key factors to ensure the pre-stack depth migration imaging. The combination of the uphole-constrained shallow tomography for LVL investigation and the pseudo-3D tomographic near-surface modeling can reduce the exploration costs while accurately revealing the near-surface structure of thick gravel area. And it also has certain popularization and application values. It can play a role in the surface modeling process of similar exploration areas, such thick loess.
In complex near surface areas, unless the advantages of various static correction methods are integrated, the imaging accuracy of the profile cannot be improved optimally. The comprehensive statics discussed in this paper can combine the advantages of tomographic statics and refraction statics, and then effectively improve imaging quality of profile. It proves to be one of the effective ways to solve the problem of static correction in areas with complex near-surface areas like Kuqa.
Acknowledgements
This study is funded by National Science and Technology Major Project (No. 2016ZX05051-001).
References
[1] WANG ZH M, XIA Y P, LIANG X H, et al. 2012, Kuqa foreland thrust complex mountainous seismic exploration technology [M], Beijing: Petroleum Indu-stry Press, 2012. (In Chinese).
[2] LYU J F, LIU X W, WANG N J. Complex surface shallow layer tomographic survey method and it’s application [C]. Special of the Geophysical Prospect-ing Technology Conference, 2012, pp. 335-338. (In Chin-ese).
[3] SU G SH, HUANG L L, ZHAO M Q. Pseudo 3D tomographic inversion static correction technology a-nd it’s application [J]. Petroleum Geophysical, 2007, 42 (sup), pp. 111-114. (In Chinese).
[4] LI ZH L, LYU J F, ZHANG Y Q. Kuqa complex mo-untain foothill belt static correction technology appli-cation study [C]. Special of the Geophysical Pros-pecting Techn-ology Conference, 2013, pp. 145-148. (In Chinese).
[5] LYU J F, LI J W, WANG J. Static correction technolo-gy and its application [J]. Unconventional Oil&-Gas, Vol. 2, No. 1, 2015, pp. 1-4. (In Chinese).
[6] ZHANG X D, LYU J F, CAI M, et al. A method to investigate the surface conditions in complex mount-ain front [J]. Natural Gas Exploration and Develom-ent, Vol. 38, No. 2, 2015, pp. 35-37. (In Chinese).
[7] LUO Y W, YANG J, DUAN W J, et al. A comparati-ve study on several static correction methods [J]. P-etroleum Instruments, Vol. 24, No. 5, 2010, pp. 41-43. (In Chinese). [8] BAI X M, CUI H L, WANG R ZH, et al. A nearsurf-ace
abnormal area static correction method and it’s application effects [J]. Chinese Petroleum Explorati-on, Vol. 1, 2013, pp. 35-38. (In Chinese).
[9] LI J G. An analysis on different complex near surfa-ce correction techniques and their applications [J]. Oil and Gas Proceeding (Academic Journal of Jiang-han Petroleum Institute), Vol. 2, No. 32, 2010, pp. 223-227. (In Chin-ese). [10] LYU J F, WEI J Y, CHEN J G. Fast initial inversion of massive
data and its application [J]. Unconven-tional Oil&Gas, Vol. 4, No. 1, 2017, pp. 1-7. (In Chin-ese).
[11] ZHOU Y, YANG H B, HUANG Y H, et al. Applicati-on of travel-time ray tomography in complicated ne-arsurface areas and its effect [J]. Natural Gas Explo-ration and Develoment, Vol. 40, No. 4, 2017, pp. 52-58. (In Chinese).
[12] NING H X, HU J, ZHANG D R, et al. Qaidam Ying-xiongling complex mountainous 3D seismic explorati-on technology [J]. Petroleum Science and Technolog-yForum, Vol. 2, 2012, pp. 2-6. (In Chinese).