http://www.sciencepublishinggroup.com/j/mma doi: 10.11648/j.mma.20170201.12
Application of Deterministic Model to Predict Compressive
Strength of Locally Occurring 3/8 Gravel Concrete at
Different Water Cement Ratio and Curing Age
Ode. T.
1, Eluozo S. N.
21
Department of Civil Engineering, Faculty of Engineering Rivers State University of Sciences and Technology Nkpolu, Port Harcourt 2
Department of Civil and Environmental Engineering, Subaka Nigeria Limited Port Harcourt, Port Harcourt, Nigeria
Email address:
[email protected] (Ode. T.), [email protected] (Eluozo S. N.), [email protected] (Eluozo S. N.)
To cite this article:
Ode T., Eluozo S. N. Application of Deterministic Model to Predict Compressive Strength of Locally Occurring 3/8 Gravel Concrete at Different Water Cement Ratio and Curing Age. Mathematical Modelling and Applications. Vol. 2, No. 1, 2017, pp. 8-16.
doi: 10.11648/j.mma.20170201.12
Received: August 23, 2016; Accepted: November 2, 2016; Published: March 30, 2017
Abstract:
This paper express a new application of determining compressive strength of concrete different from the conventional ways using experimental analysis through calibrations and development of empirical models techniques. Although previous concepts has been generating results to monitor the compressive strength of concrete, but the purpose of these study is to develop another method of compressive strength different from experimental and empirical solution, thus express the advantage of these application compared to other conventional method in concrete strength development. The application of deterministic model in the development of locally occurring 3/8 gravel aggregate concrete at its natural has definitely generated it advantage; it has been observed that these two different materials selected at different mix proportion has also not been thorough monitored applying this type of modeling techniques. These are to determine its compressive strength using this type of predictive model. These concept were used to predict the compressive strength of locally occurring 3/8 gravel concrete at different water cement ratios and curing age, simulating these model generated predictive values that has expressed the behaviour of strength development from different water cement ratios and curing age, the graphical representations shows there various rates of compressive strength at different mix proportions and age, the strength development from these local materials has been expressed through the developed model, some effects that has generated some decline in compressive strength in some mix proportions were also observed, these influences are from variation of concrete porosity and permeability, these are reflected on the fluctuation of compressive strength at different figures expressed through graphical representation, the study is imperative because the developed model can be applied to monitor the behaviour of strength development of all in one aggregates in natural state including selective material that form other normal granite aggregate concrete, predicting there various compressive strength at different ages including every twenty four hour thus interval of seven days to ninety days, these are new concept that can be applied to monitor compressive strength of concrete.Keywords:
Deterministic Model, Compressive Strength, 3/8 Gravel and Age1. Introduction
All concrete need curing in order that cement hydration can continue so as to allow for advance in strength, durability and other mechanical characteristics. To acquire high-quality concrete, the placing of a suitable mix must be applied followed by curing in a appropriate environment, particularly during the early phase of hardening. According to Neville [6, 7, and 8] refers to curing as the procedure of protecting concrete for a particular period of time after placement, to give
increase only 50% of the strength of continuously cured concrete [5]. Further more if concrete is cured for just only three days, it will attain up to 60% of the strength of continuously cured concrete; in most cases, if it is cured for seven days, it will definitely reach 80% of attained strength of continuously cured concrete. But if curing concrete stops for some period and then recommenced again, it will observed that the strength attained will also stop and reactivate [5]. More so when a concrete is not well cured, especially at the early period of curing, it will not attained the essential properties at desired level due to a lesser degree of hydration, this implies that it will suffer from irreversible loss [7, 9]. Inappropriate curing would involve inadequate moisture and this has been observed to generate cracks, compromise strength, and decrease long-term durability [8, 10, 11, and 12]. There are factors on curing process including quality and quantity of cement used in a mix, grading of aggregates, maximum nominal size, shape and surface texture of aggregate [2] more so the applications of water/cement ratios, degree of compaction [2] the presence or depositions of some clayey particles and organic matter in the mix [3].
2. Governing Equation
m m m
C S
C C C
W V G
z l β l
∂ = ∂ + ∂
∂ ∂ ∂ (1)
Nomenclature
Cm=Compressive strength
WC=Water Cement Ratio
Vs=vertical Strain
β=Concrete porosity G=specific gravity Z, L=Curing Age
Equation (1) is solve using method of separation of variable whereby we let C (z, l) =Z (z) L (l).
[
]
' 2S
L
V G
L
β τ
+ = (2)
Therefore, we have a solution of the forms;
2 2
S
Cz V G
W
Z A andL B
τ τ β +
= ℓ = ℓ (3)
Which when combine gives equation (4) as thus;
2 2
( , ) WC VS G
M
C z l Ae B
τ τ β +
= ℓ (4)
2
( , ) C S
z l
W V G M
C z l AB
τ β + +
= ℓ (5)
3. Materials and Method
ELE England made concrete compressive machine was used. It consists of a measuring gauge with two indicator or
pointer (black and red). The indicator must be set to zero mark before testing. Load is applied to test specimen through two steel loading platforms, with a fixed upper platform and an upward moving lower platform. The lower platform has marking which help in centralizing a test specimen to receive the concentric load. At failure, the black pointer drops back to zero and red pointer remains in position to give the reading of the failure load, after the reading has been taken, a knob is adjusted to release the lower platform to former position.
4. Results and Discussion
Results and discussion are presented in tables including graphical representation of predictive values for compressive strength.
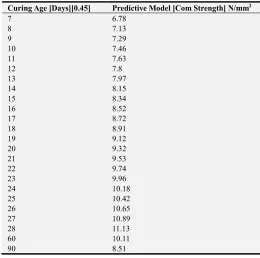
Table 1. Predictive Values of Compressive Strength at Different Curing Age.
Curing Age [Days][0.45] Predictive Model [Com Strength] N/mm2
7 6.78
8 7.13
9 7.29
10 7.46
11 7.63
12 7.8
13 7.97
14 8.15
15 8.34
16 8.52
17 8.72
18 8.91
19 9.12
20 9.32
21 9.53
22 9.74
23 9.96
24 10.18
25 10.42
26 10.65
27 10.89
28 11.13
60 10.11
90 8.51
Table 2. Predictive and Experimental Values for Compressive Strength at Different Curing Age.
Curing Age [Days] [0.45]
Predictive Values[N/mm2]
Experimental values [N/mm2]
7 6.78 6.788
8 7.13 6.851
9 7.29 7.155
10 7.46 7.45
11 7.63 7.733
12 7.8 8.007
13 7.97 8.408
14 8.15 8.536
15 8.34 8.792
16 8.52 9.006
17 8.72 9.233
18 8.91 9.45
19 9.12 9.659
20 9.32 9.86
21 9.53 10.051
22 9.74 10.235
Curing Age [Days] [0.45]
Predictive Values[N/mm2]
Experimental values [N/mm2]
24 10.18 10.578
25 10.42 10.738
26 10.65 10.891
27 10.89 11.039
28 11.13 11.174
60 10.11 12.9
90 8.51 13.29
Table 3. Predictive values of compressive strength at different curing age.
[WC 0.50] [Days] Curing Age Predictive Values [Comp SGT] [N/mm2]
7 4.35
14 5.55
21 6.1
28 10.46
60 8.85
90 8.53
Table 4. Predictive and Experimental Values for Compressive Strength at Different Curing Age.
WC[0.50][Days] Curing Age
Predictive Values [N/mm2][Comp SGT]
Experimental values[N/mm2] [Comp
SGT]
7 4.35 6
14 5.55 7.71
21 6.1 7.78
28 10.46 10.62
60 8.85 9.33
90 8.53 5.56
Table 5. Predictive Values of Compressive Strength at Different curing Age.
[WC 0.55] [Days]Curing Age Predictive Values[N/mm2] [Comp SGT]
7 6.79
14 11.08
21 8.75
28 11.19
60 8.1
90 8.2
Table 6. Predictive and Experimental Values for Compressive Strength at Different Curing Age.
[WC 0.55] [Days] Curing Age
Predictive Values[N/mm2] [Comp SGT]
Experimental values [N/mm2][Comp SGT]
7 6.79 6.82
14 11.08 10.22
21 8.75 9.04
28 11.19 11.85
60 8.1 8.93
90 8.2 9.56
Table 7. Predictive Values of Compressive Strength at Different curing Age.
[WC 0.60] [Days]Curing Age Predictive Values[N/mm2] [Comp SGT]
7 9.65
14 10.85
21 14.29
28 10.72
60 8.42
90 11.94
Table 8. Predictive and Experimental Values for Compressive Strength at Different Curing Age.
[WC 0.60] [Days]Curing Age
Predictive Values[N/mm2]
[Comp SGT]
Experimental values[N/mm2] [Comp
SGT]
7 9.65 10.5
14 10.85 11.26
21 14.29 16
28 10.72 11.52
60 8.42 8.93
90 11.94 9.56
Table 9. Predictive Values of Compressive Strength at Different curing Age.
[WC 0.65] [Days] Curing Age Predictive Values [N/mm2] [Comp SGT]
7 8.82
14 8.33
21 11.86
28 13.21
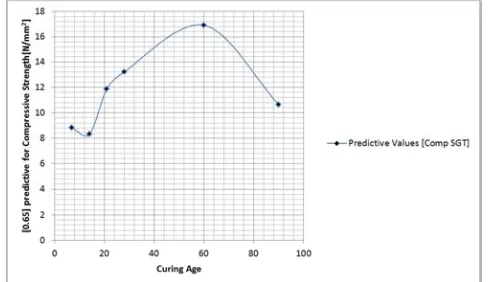
60 16.92
90 10.64
Table 10. Predictive and Experimental Values for Compressive Strength at Different Curing Age.
[WC 0.65] [Days]Curing Age
Predictive
Values[N/mm2] [Comp
SGT]
Experimental values[N/mm2] [Comp
SGT]
7 8.82 8.89
14 8.33 8.89
21 11.86 11.85
28 13.21 12.45
60 16.92 17.78
90 10.64 10.67
Table 11. Predictive Values of Compressive Strength at Different curing Age.
[WC 0.70][Days] Curing Age Predictive Values[N/mm2] [Comp SGT]
7 10.28
14 10.49
21 13.59
28 13.88
60 18.67
90 9.84
Table 12. Predictive and Experimental Values for Compressive Strength at Different Curing Age.
[WC 0.70] [Days] Curing Age
Predictive Values [N/mm2][Comp
SGT]
Experimental values[N/mm2] [Comp
SGT]
7 10.28 10.69
14 10.49 11.26
21 13.59 14.96
28 13.88 13.63
60 18.67 17.33
90 9.84 10.23
Table 13. Predictive Values of Compressive Strength at Different curing Age.
[WC 0.75] [Days] Curing Age Predictive Values[N/mm2] [Comp SGT]
7 6.56
14 9.55
21 11.37
28 9.76
60 10.61
Table 14. Predictive and Experimental Values for Compressive Strength at Different Curing Age.
[WC 0.75] [Days]Curing Age
Predictive
Values[N/mm2] [Comp
SGT]
Experimental values[N/mm2] [Comp
SGT]
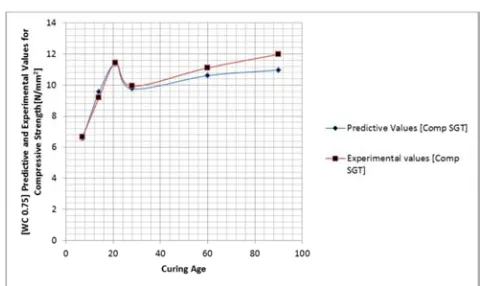
7 6.56 6.67
14 9.55 9.19
21 11.37 11.41
28 9.76 9.93
60 10.61 11.11
90 10.97 11.98
Table 15. Predictive Values of Compressive Strength at Different curing Age.
[WC [0.80][Days]Curing Age Predictive Values[N/mm2] [Comp SGT]
7 6.19
14 8.01
21 10.31
28 10.31
60 12.1
90 10.18
Table 16. Predictive and Experimental Values for Compressive Strength at Different Curing Age.
[WC [0.80] [Days] Curing Age
Predictive
Values[N/mm2] [Comp
SGT]
Experimental values [N/mm2][Comp SGT]
7 6.19 5.78
14 8.01 8.31
21 10.31 9.78
28 10.31 10.81
60 12.1 11.11
90 10.18 10.67
Table 17. Predictive Values of Compressive Strength at Different curing Age.
[WC [0.85][Days]Curing Age Predictive Values [N/mm2][Comp SGT]
7 5.17
14 10.13
21 10.14
28 11.01
60 9.66
90 11.49
Table 18. Predictive and Experimental Values for Compressive Strength at Different Curing Age.
[WC [0.85] [Days] Curing Age
Predictive Values[N/mm2]
[Comp SGT]
Experimental values[N/mm2] [Comp
SGT]
7 5.17 5.33
14 10.13 9.63
21 10.14 9.93
28 11.01 10.52
60 9.66 10.67
90 11.49 11.12
Table 19. Predictive Values of Compressive Strength at Different curing Age.
[WC [0.90] [Days] Curing Age Predictive Values[N/mm2] [Comp SGT]
7 6.45
14 10.03
21 10.15
28 11.72
60 11.06
90 11.06
Table 20. Predictive and Experimental Values for Compressive Strength at Different Curing Age.
[WC [0.90] [Days] Curing Age
Predictive
Values[N/mm2] [Comp
SGT]
Experimental values[N/mm2] [Comp
SGT]
7 6.45 7.11
14 10.03 10.37
21 10.15 9.63
28 11.72 12.15
60 11.06 9.78
90 11.06 13.12
Table 21. Predictive Values of Compressive Strength at Different curing Age.
[WC [0.95][Days]Curing Age Predictive Values [N/mm2][Comp SGT]
7 4.28
14 4.61
21 4.97
28 5.4
60 7.49
90 6.87
Table 22. Predictive and Experimental Values for Compressive Strength at Different Curing Age.
[WC [0.95] [Days] Curing Age
Predictive Values[N/mm2]
[Comp SGT]
Experimental values[N/mm2] [Comp
SGT]
7 4.28 4.41
14 4.61 4.89
21 4.97 5.11
28 5.4 6.22
60 7.49 7.56
90 6.87 7.34
Figure 1. Predictive Values of Compressive Strength at Different curing Age.
Figure 3. Predictive Values of Compressive Strength at Different curing Age.
Figure 4. Predictive and Experimental Values for Compressive Strength at Different Curing Age.
Figure 5. Predictive Values of Compressive Strength at Different curing Age.
Figure 6. Predictive and Experimental Values for Compressive Strength at Different Curing Age.
Figure 7. Predictive Values of Compressive Strength at Different curing Age.
Figure 8. Predictive and Experimental Values for Compressive Strength at Different Curing Age.
Figure 9. Predictive Values of Compressive Strength at Different curing Age.
Figure 11. Predictive Values of Compressive Strength at Different curing Age.
Figure 12. Predictive and Experimental Values for Compressive Strength at Different Curing Age.
Figure 13. Predictive Values of Compressive Strength at Different curing Age.
Figure 14. Predictive and Experimental Values for Compressive Strength at Different Curing Age.
Figure 15. Predictive Values of Compressive Strength at Different curing Age.
Figure 16. Predictive and Experimental Values for Compressive Strength at Different Curing Age.
Figure 17. Predictive Values of Compressive Strength at Different curing Age.
Figure 19. Predictive Values of Compressive Strength at Different curing Age.
Figure 20. Predictive and Experimental Values for Compressive Strength at Different Curing Age.
Figure 21. Predictive Values of Compressive Strength at Different curing Age.
Figure 22. Predictive and Experimental Values for Compressive Strength at Different Curing Age.
Figure one express the rate of compression influences by the rate of compaction pressured by the level of
permeability in the concrete, gradual increase were observed between seven to twenty eight days at every twenty four hours, slight decline rate were experiences between sixty and ninety days, but not at every twenty four hours. Figure two express the comparative rate between the predictive and experimental values, the predicted and the experimental values maintained best fits expressing the validation of the model from predictive condition. Figure three experiences fluctuation on exponential rate to the optimum strength recorded at twenty eight days, but experiences slight decrease in compression strength, while figure four expressed similar condition, both parameters maintained vacillation to the optimum level thus with slight decrease in compression between sixty and ninety days. Figure five express gradual increase to a point where fluctuation were observed, but at twenty eight days sudden decrease in concrete compression were experienced between sixty and ninety days. Figure six experienced gradual increase in compression between experimental and predictive values, both parameters developed best fits fluctuation were between fourteen and twenty eight days, slight decrease were observed between sixty and ninety days. Figure seven observed gradual increase to attain its maximum strength at twenty one days, sudden decrease in compression were observed between twenty eight and sixty day with slight increase at ninety days. Figure eight expressing comparative expression between predictive and experimental, best fits were recorded between both parameters decreasing slightly between sixty and ninety days. Figure nine gradual increases to the optimum values at sixty days sudden decrease were experiences at ninety days. Figure ten maintained best fits between predictive and
experimental, gradual compressive strength were
the experimental express slight decline at sixty days compare to predictive. Figure seventeen express rapid increase in compressive strength thus experiences fluctuation between twenty one and sixty days to the point where the optimum values was recorded at ninety days. Figure eighteen maintained similar condition by expressing fitness between predictive and experimental values, but the experimental values maintained linear increase between sixty and ninety days. Figure nineteen express an increase between seven and twenty eight were the optimum values were recorded, it also express slight decrease in compressive strength. Figure twenty express it rate of fitness between the predictive and experimental values, fluctuation were recorded between twenty one and twenty eight days of compressive strength, but the experimental were slightly higher than predictive as it maintained decline from sixty and ninety days. Figure twenty one maintained gradual increase in compressive strength to the point where the optimum vales was recorded at sixty days with slight decline at ninety days. While figure twenty two express comparison between the predictive and experimental values, fitness was observed were the optimum was recorded at sixty days thus slight declined was experienced at ninety days.
5. Conclusion
Application of deterministic model to develop
compressive strength of concrete was carried through simulation. This to monitor developed strength at every twenty four hours including seven days intervals to ninety days, the behaviour of the concrete made from local occurring 3/8 gravel has express various compressive strength rate at different curing age, these process were shows from the predictive values the variation of mix proportions and compaction at different concrete formation, the developed model through simulation express the fluctuation of some concrete sample base on the influences from variation of porosity and permeability’s in some concrete formation. Mix design variation were observed to influences some fluctuation experiences from the predicted values, experimental values from locally occurring 3/8 gravel were compared with predicted values, both parameters express favorable fits, several experts has been applying experimental values thus empirical model concept, but the application of deterministic modeling approach has not been applied, these concept has predicted the developing strength of locally occurring 3/8 at every twenty four hours interval at the same time the normal conventional monitoring of seven days interval to n ninety days. The compressive strength development has been monitored at every twenty four hour interval applying this model, it has also express variation of strength developed as most concrete even developed optimum strength before twenty eight days, similar condition were also observed on the monitoring of the strength each day of curing. The study has express several advantage from the developed model.
References
[1] Akeem A. R 2013 effect of curing methods on density and compressive strength of concrete International Journal of Applied Science and Technology Vol. 3 No. 4; April.
[2] Aluko, O. S. (2005). Comparative Assessment of Concrete Curing Methods. Unpublished Post Graduate Diploma Thesis, Federal University of Technology, Akure, Nigeria.
[3] Arum, C. and Alhassan, Y. A. (2005). Combined Effect of Aggregate Shape, Texture and Size on Concret Strength. Journal of Science, Engineering and Technology. 13 (2), 6876-6887.
[4] Gowripalan, N., Cabrera, J. G.; A. R, Cusens and Wainwright, P. J. (1992) Effect of Curing on Durability, Durable Concrete, ACI Compilation 24. American Concrete Institute, Farmington Hills, Michigan, USA 47-54.
[5] Mamlouk, M. S. and Zaniewski, J. P (2006). Materials for Civil and Construction Engineers. 2nd ed., New Jersey: Pearson Prentice Hall.
[6] Neville, A. M. (1996). Properties of Concrete, 4th ed., USA, New York: John Wiley and Sons.
[7] Ramezanianpour, A. A. and V. M. Malhotra, (1995). Effect of Curing on the Compressive Strength, Resistance to Chloride-Ion Penetration and Porosity of Concretes Incorporating Slag, Fly Ash or Silica Fume. Cement and Concrete Composites. 17 (2), 125-133.
[8] Wojcik, G. S., and Fitzjarrald, D. R. (2001). Energy Balances of Curing Concrete Bridge Decks. Journal of Applied Meteorology, 40 (11).
[9] Zain, M. F. M., M. Safiudd in and K. M. Yusof, (2000). Influence of Different Curing Conditions on the Strength and Durability of High Performance Concrete. In the Proceedings of the Fourth ACI international.
[10] Conference on Repair, Rehabilitation and Maintenance, ACI SP-193, American Concrete Institute. Farmington Hills, Michigan, USA. 275-292.
[11] Ode. T. and Eluozo S. N. 2016 Predictive Model on Compressive Strength of Concrete Made with Locally 3/8 Gravel from Different Water Cement Ratios and Curing Age; International Journal of Scientific and Engineering Research, Volume 7, issue 1 pp 1528-1551.
[12] Ode. T. and Eluozo S. N.- 2016 Model Prediction to Monitor the Rate of Water Absorption of Concrete Pressured by Variation of Time and Water Cement Ratios International
Journal of Scientific and Engineering Research, Volume 7, issue 1 pp 1514-1527.
[13] Ode. T. and Eluozo S. N. 2016 Calibrating the Density of Concrete from Washed and Unwashed Locally 3/8 Gravel Material at Various Curing Age International Journal of
Scientific and Engineering Research, Volume 7, issue 1 January-pp 1514-1552-15574.
[15] Ode. T. and Eluozo S. N; 2016 Predictive Model to Monitor Variation of Concrete Density Influenced by Various Grade from Locally 3/8 Gravel at Different Curing Time International Journal Engineering and General Science Volume 4 Issue 1, pp 502-522.
[16] Ode. T. and Eluozo S. N; 2016 Predictive Model to Monitor Vitiation of Stress –Strain Relationship of 3/8 Gravel Concrete with Water Cement Ration [0.45] at Different Load International Journal Engineering and General Science Volume 4 Issue 1, pp 409-418.
[17] Eluozo S. N. and Ode. T. 2015 Modeling and simulation of Compression Strength for Firm Clay in Swampy Area of Ahoada East International Journal of Advance Research in
Engineering and Technology Volume 6, Issue 12, pp 73-85.
[18] Eluozo S. N. and Ode. T. 2015 Mathematical Model to Predict Compression Index of Uniform Loose Sand in Coastal Area of Degema, Rivers State of Nigeria International Journal of
Advance Research in Engineering and Technology Volume 6, Issue 12, pp 86-103.
[19] Eluozo S. N. and Ode. T. 2015 Mathematical to Monitor Stiff Clay Compression Index in Wet Land Area of Degema
International Journal of Advance Research in Engineering and Technology Volume 6, Issue 12, pp 59-72.