Published online November 20, 2014 (http://www.sciencepublishinggroup.com/j/ajep) doi: 10.11648/j.ajep.20140305.21
ISSN: 2328-5680 (Print); ISSN: 2328-5699 (Online)
Determination and sorting of asbestos-containing material
by visual observation
Hiroshi Asakura
1, *, Mikio Kawasaki
2, Kazuyuki Suzuki
2, Kei Nakagawa
1, Yoichi Watanabe
21Graduate School of Fisheries Science and Environmental Studies, Nagasaki University, Nagasaki, Japan 2Center for Environmental Science in Saitama, Saitama, Japan
Email address:
[email protected] (H. Asakura)
To cite this article:
Hiroshi Asakura, Mikio Kawasaki, Kazuyuki Suzuki, Kei Nakagawa, Yoichi Watanabe. Determination and Sorting of Asbestos-Containing Material by Visual Observation. American Journal of Environmental Protection. Vol. 3, No. 5, 2014, pp. 275-282.
doi: 10.11648/j.ajep.20140305.21
Abstract:
A rapid method for the determination of asbestos fiber at an intermediate treatment facility for construction anddemolition waste (CDW) is required. Although the rapid method which involves visual observation has been developed, the determination accuracy and time are unknown. The purpose of this study was to determine the identification rate of asbestos-containing material (ACM: > 0.1w%), the time required for asbestos fiber determination by visual observation, and the asbestos content in CDW. After participating in a short training course for ACM determination, persons who did not have any knowledge of asbestos fiber determination were able to determine ACM in CDW by visual observation. Using the results of visual observation, an ACM sorting model was formulated. The model enabled simulation of asbestos content after sorting by inputting asbestos content distribution into CDW before sorting. However, 0.35 w% of asbestos still remained in the non-ACM fraction, i.e., the content was > 0.1 w%. The relationship between the number of sorters and the total sorting time for disaster waste from the Great East Japan Earthquake was presented. It was found that a very long time and a large number of people were required for sorting.
Keywords:
Asbestos, Construction and Demolition Waste, Visual Observation, Sorting1. Introduction
Material containing > 0.1w% asbestos is regarded as asbestos-containing material (ACM) in Japan. Solid waste containing> 0.1 w% asbestos is also regarded as asbestos-containing waste in Japan and EU. As asbestos-containing waste from building demolitions has to undergo special treatment prior to recycling or final disposal, the demolition of buildings and the sorting of waste materials are conducted after checking for asbestos content in the construction materials (according to ISO, EPA or JIS). However, as solid waste is usually a mixture, it is possible that ACM is contained in construction and demolition waste (CDW) that is transported to an intermediate treatment facility for CDW. In addition, the presence of ACM in disaster waste generated by the Great East Japan Earthquake cannot be avoided. Therefore, a rapid method for the determination of asbestos fiber at an intermediate treatment facility for CDW is required.
As a long time is required to identify asbestos fiber by conventional laboratory methods, such as those adopted by
ISO, those methods are unsuitable for intermediate treatment facilities for CDW. On the other hand, Saitama Prefecture has developed a rapid method for asbestos fiber determination, which involves visual observation [1]. However, the determination accuracy and time are unknown.
reported [14]. Some studies have employed an advanced analyzer with high accuracy. However, in actuality, the preliminary analysis of asbestos content in construction material from demolition work is not being conducted in many cases in Japan. Currently, one of the major sorting methods at intermediate treatment facilities for CDW is manual sorting with visual observation. Therefore, estimation of the accuracy and efficiency of sorting by visual observation should be conducted first, followed by consideration of the adoption of analytical instruments with high accuracy. The feasibility of sorting in situ can be estimated from the sorting accuracy and the sorting time determined in this study.
The purpose of this study was to determine the identification rate of ACM, the time required for determination of asbestos fiber by visual observation, and the asbestos content in CDW. Using the obtained results, asbestos content after sorting a pile of assumed CDW and the time required for visual observation were calculated.
2. Theory
2.1. Determination and sorting of Asbestos-Containing Material
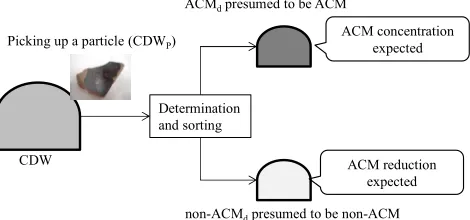
In this study, a material is thought to contain asbestos if its asbestos content is >0.1w%. ACM has to undergo special treatment prior to recycling or final disposal, as mentioned above. If ACM is present in CDW and the asbestos content in CDW is > 0.1 w%, the whole CDW is regarded as ACM. However, because it is impossible to treat large amounts of CDW as ACM, it is necessary to convert the CDW into non-asbestos-containing material (non-ACM) by removing ACM. Furthermore, concentrating non-ACM promotes recycling of CDW.
Therefore, we considered ACM sorting in this study. Specifically, a particle constituting CDW containing ACM (called CDWP hereafter) is picked up and determined by
visual observation as ACM or non-ACM. When the entire CDW has been determined, a pile of CDWPs presumed to be
ACM (ACMd: “d” is from “determined”) and a pile of CDWPs
presumed to be non-ACM (non-ACMd) will be made (Fig. 1).
Because ACMd and non-ACMd are determined by visual
observation, human error is expected. From the point of view of sorting efficiency, high-accuracy sorting of both ACMd and
non-ACMd and a short sorting time are required.
ACMdpresumed to be ACM
non-ACMdpresumed to be non-ACM
CDW
Picking up a particle (CDWP)
Determination and sorting
ACM concentration expected
ACM reduction expected
Figure 1. Concept of sorting CDW aiming at removal of ACM.
2.2. Obtained Coefficients of Identification Rate of Asbestos-Containing Material
It is ideal that CDWP be determined as ACMd when the
CDWP is actually ACM, and be determined as non-ACMd
when the CDWP is actually non-ACM. However, the
determination is based on not the asbestos content but the existence of asbestos fiber, as asbestos content cannot be determined by visual observation. In this study, CDWP is
regarded as ACMd once asbestos fiber is found. Therefore,
even if the asbestos content in CDWP varies, only the output
of “ACMd or non-ACMd,” i.e., “1 or 0,” can be obtained. In
this study, the authors take into consideration the identification rate that a certain CDWP will be determined as
ACMd. This rate is defined by the number of determinations as
ACMd for an identical CDWP per number of experimenters. In
actuality, the identification rate of “non-ACMd” would be high
in materials with low asbestos content, and the identification rate of “ACMd” would be high in materials with high asbestos
content. Then, around a certain content (ideally 0.1 w%), the identification rate of “ACMd” would increase drastically with
increasing asbestos content. In addition, around that content, experimenters would find it difficult to make a confident determination and thus determination error would increase.
In this way, considering that the Y-value approaches a minimum asymptotically for an infinitely small X-value, increases drastically around a certain X-value, and approaches a maximum asymptotically for an infinitely large X-value, an example of a curved line of the identification rate is a logistic curve, i.e., we obtain:
Dfn = 1 / {1 + aexp(bCn)}, (1)
where Dfn is the identification rate [−] for CDWP of sample
number “n,” Cn is the asbestos content [w%] for CDWP of
sample number “n,” and a and b are the coefficients of the logistic curve.
2.3. Time Required for Determination
In the determination of a certain CDWP, the determination
result will be the “existence of asbestos fiber” and further observation will not be necessary once one typical asbestos fiber is found. On the other hand, if no typical asbestos fiber were found, observation of the entire cross section of a certain CDWP would be required. Therefore, the determination time
is short and long in areas with high and low asbestos contents, respectively. In this way, considering that the Y-value decreases with increasing X-value, an example of a curved line of the determination time is an inverse proportion curve, i.e., we obtain:
tn = {c / (Cn−d)} + e, (2)
where tn is the determination time [s] for CDWP of sample
2.4. Simulation of Asbestos Content of Sorted CDW
Assuming CDW containing ACM, CDWPs are classified as
ACM or non-ACM by visual observation. After sorting using the parameters obtained by (1) and (2), piles of ACMd and
non-ACMd are made. The authors formulated a model to
calculate asbestos contents in the piles of ACMd and
non-ACMd and the determination time. If the asbestos content
in CDW could be concentrated into ACMd and the content in
non-ACMd could be decreased, sorting accuracy would
increase. On the other hand, the necessary resources (labor cost) can be calculated from the sorting time.
Considering the curved line of the identification rate, Dfn [−]
is output by inputting Cn [w%]. Therefore, the content
distribution of CDWPs has to be input in order to calculate the
asbestos content after sorting. In picking up and determining a piece of CDWP in CDW, the piece should be classified as
ACMd with the probability of Dfn and sorted into the pile of
ACMd. Similarly, the piece should be classified as non-ACMd
with the probability of 1−Dfn and sorted into the pile of
non-ACMd. In this way, the determination result is either
ACMd or non-ACMd. However, as far as the simulation model
is concerned, it is difficult to classify a piece of CDWP as
either ACMd or non-ACMd. Therefore, the authors assumed
that a piece of CDWP having uniform weight W [kg] is divided
according to Dfn into WDfn [kg] for the ACMd side and
W(1−Dfn) [kg] for the non-ACMd side. Considering that CA
[w%] and CnonA [w%] are the average asbestos contents after
sorting into piles of ACMd and non-ACMd, respectively, we
obtain:
CA = Σ(WDfnCn) / Σ(WDfn) =Σ(DfnCn) / Σ(Dfn), (3)
CnonA =Σ[W(1 −Dfn)Cn] / Σ[W(1 −Dfn) ]
= Σ[(1 −Dfn)Cn] / Σ(1 −Dfn). (4)
Sorting each piece of CDWP should require the
determination time shown in (2). The total sorting time Ttotal [s]
can be calculated by taking the summation of the determination times, i.e., we obtain:
Ttotal = Σ(tn) =Σ[{c / (Cn−d)} + e]. (5)
3. Materials and Methods
3.1. Facilities and Waste Samples
Waste samples were collected from an intermediate treatment facility in Japan (X) where CDW was crushed and recyclable materials were recovered. The treatment flow at demolition sites and intermediate treatment facility X is shown in Fig. 2. Presorted ACMd was bagged (A) at
demolition sites. Other waste construction materials, i.e., non-ACMd, were manually presorted into recyclable materials
(e.g., stones and metals) and mixtures of other materials (hereafter “mixture”), as shown in Fig. 2. The bagged ACMd,
the recyclable materials, and the mixture were transported to facility X. The bagged ACMd (A) was stored and brought to a
landfill site. The mixture was manually presorted into recyclable materials and other residue. The residue was sieved through 40 mm mesh vibrating sieve. Particles that remained on the sieve (B) were recycled or deposited at a landfill site, and fine particles that passed through the sieve were also deposited at a landfill site. A and B mentioned above were collected.
In order to identify particles containing asbestos, A and B were mixed. After mixing, 125 particles were sampled at random. Dust on the particles was brushed off and the particles were washed with tap water. Then, the particles were numbered by oil-based marking pen and called “CDWP” also
hereafter.
3.2. Sample Characteristics
Particle size (three dimensions, i.e., shortest, medium, and longest sides) and weight of CDWP were measured.
3.3. Experimental Methods
3.3.1. Main Points for Determination of ACMd by Visual Observation
Demolition of buildings
Manual presorting
ACMd
Presorting of ACMd Bagging
Manual presorting
Stones, bricks, blocks, wood, plastics, metals, other recyclable materials
40 mm Vibrating sieving
Large materials →recovery or landfill
Fine particles Recovered material
Mixture
Recovered material Residue
> 40 mm
≤ 40 mm Intermediate
treatment facility X Demolition sites
Landfill non-ACMd
A
B
Figure 2. Treatment flow at demolition sites and intermediate treatment facility X. Sampling points are also shown (A and B).
1 mm
**
*
*
5 mm
*
*
*
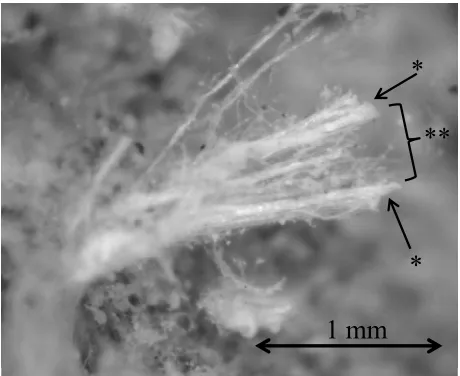
Figure 4. Typical non-asbestos fiber (glass or ceramic fiber): independent fibers*.
The determination of asbestos fiber in CDWP was
conducted as follows: first, fiber on the cross section of CDWP
was identified and then, whether the fiber is asbestos or not was determined. For the determination of asbestos fiber, individual characteristics of the fiber were checked, i.e., the fiber should be fascicular and non-uniform (Fig. 3). Therefore, an independent and uniform fiber (e.g., cotton or glass wool) is not asbestos (Fig. 4).
3.3.2. Instruments for Visual Observation
As asbestos fibers in CDWP form bundles, they can usually
be easily identified with the naked eye. However, as there are also thin bundles, the authors used a loupe (15X magnification) or a microscope (DinoLite Pro 500X: 500X magnification) to improve determination accuracy.
3.3.3. Procedure for Visual Observation
The results of visual observation by several experimenters were required to calculate the identification rate for CDWP.
Therefore, a visual observation experiment was conducted with five experimenters. The experimenters were in their twenties and did not have any knowledge of the determination of asbestos fiber. The authors showed the above individual characteristics of asbestos fiber by using photographs. Then, training for visual observation with a loupe or a microscope was conducted for 10 minutes using samples that had typical asbestos fibers. The training course took approximately 30 minutes. After that, the visual observation experiment was performed as follows.
A stopwatch was started when a piece of CDWP was chosen.
The cross section of the CDWP was observed with a loupe or a
microscope to determine the presence of asbestos fiber. After the observation, the stopwatch was stopped and the observation time and the existence (with characteristics to prove the existence of asbestos fiber) or non-existence of asbestos fiber were recorded. There were three types of determination: “non-existence of any fibers (non-ACMd),”
“existence of some fibers that were not asbestos (non-ACMd),” and “existence of some typical asbestos fibers
(ACMd).” The total number of determinations was 625 (five
experimenters, 125 samples each).
3.4. Asbestos Content
Asbestos content in CDWP was measured after visual
observation. The object minerals for measurement were chrysotile, amosite, crocidolite, tremolite, actinolite, and anthophyllite. Qualitative analysis was conducted by JIS A 1481-7.1 and 7.2 (XRD and phase-contrast microscope). Quantitative analysis was conducted by JIS A 1481-10 (X-ray diffraction) and the minimum determination limit was 0.1 w%. It is not the intent of this study to discuss the types and accuracies of qualitative and quantitative analyses.
4. Experimental Results
4.1. Sample Characteristics
The average particle sizes of the shortest, medium, and longest sides were 5.9 cm, 4.0 cm, and 1.4 cm, respectively, and the average weight was 74 g (n = 125).
4.2. Determination of ACM by Visual Observation
The results of determination and the average determination time using a loupe or a microscope are shown in Table 1. The average number of CDWPs found to contain some asbestos
fibers using the microscope (49) was larger than that using the loupe (44). The average determination time by the microscope (56.3 s) was longer than that by the loupe (26.3 s).
Table 1. Experimental results.
Ave.
Experimenter No.
1 2 3 4 5
Loupe
Existence
number* 44 39 56 45 44 36
Average
time (s) 26.3 38.0 19.2 25.5 27.1 21.5
Microsc ope
Existence
number* 49 48 53 46 52 46
Average
time (s) 56.3 68.5 53.8 54.1 46.4 58.6
*The number of CDWPs found to contain asbestos fiber by an experimenter.
0.0 0.2 0.4 0.6 0.8 1.0
0 5 10 15 20
Dfn
(‒
)
Cn(%) a: loupe
simulated measured
0.0 0.2 0.4 0.6 0.8 1.0
0 5 10 15 20
Dfn
(‒
)
Cn(%)
b: microscope
simulated
measured
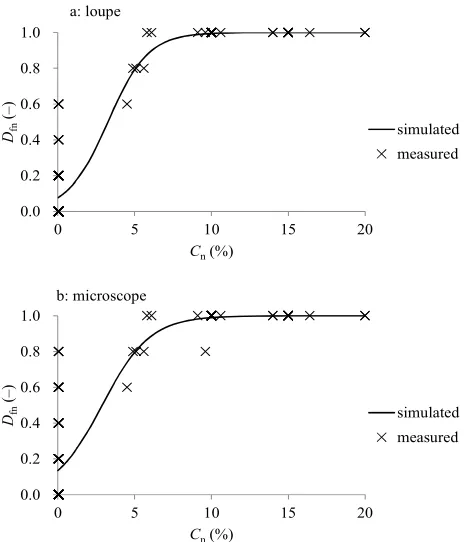
Figure 5. Relationships between asbestos content and identification rate (a: loupe method, b: microscope method).
The relationships between asbestos content and determination time are shown in Fig. 6. The determination times tended to be short and long in the areas with high and low asbestos contents, respectively. The obtained coefficients of the determination time by curve fitting of measured and simulated values using (2) are also shown in Table 2.
0 20 40 60 80 100 120
0 5 10 15 20
tn
(s
)
Cn(%)
a: loupe
simulated measured
0 20 40 60 80 100 120
0 5 10 15 20
tn
(s
)
Cn(%)
b: microscope
simulated measured
Figure 6. Relationships between asbestos content and determination time (a: loupe method, b: microscope method).
Table 2. Obtained coefficients of identification rate and determination time.
Loupe Microscope
Identification rate
Dfn = 1 / {1 + aexp(bCn)}
a 12.03 6.363
b −0.765 −0.643
Determination time
tn = {c / (Cn−d)} + e
c d e
23100 2980
−137 −31.4
−139 −31.0
5. Discussion
5.1. Determination Error
In this study, the determination error is defined by “determination of CDWP containing asbestos at > 0.1 w% as
non-ACMd” and “determination of CDWP containing asbestos
at < 0.1 w% as ACMd.” However, as visual observation was
carried out on only the sample cross section, the determination result would be “non-ACMd” if asbestos fibers existed only
within CDWP even though the content was > 0.1 w%.
Similarly, the determination result would be “ACMd” if
asbestos fibers were found on the sample cross section even though the content was < 0.1 w%. Thus, the determination error defined in this study contains not only human error, but also the error derived from visual observation of only the cross section.
The determination errors of “non-ACMd” even though the
asbestos content was > 0.1 w% are shown in Table 3. The numbers of samples determined erroneously were 4 and 5 for the loupe method and the microscope method, respectively. Using the loupe method, two samples were determined as “non-existence of any fibers (NE)” and two samples, as “existence of some fibers that were not asbestos (EF).” Using the microscope method, four samples were determined as NE and one, as EF. There were no cases of NE or EF identified by the loupe method and “existence of some typical asbestos fiber (TP)” identified by the microscope method in the same CDWP sample. The reason that the number of NEs by the
microscope method was larger than that by the loupe method would be the narrowness of the visual field of the microscope. Non-asbestos and typical asbestos fibers existed on the cross section of the CDWP sample determined as EF (sample no.
92).
The number of samples erroneously determined as ACMd
even though the asbestos content was < 0.1 w% was 26 for the loupe method and 32 for the microscope method. Independent or uniform fibers existed on most of the CDWP samples that
were erroneously determined.
Table 3. Determination errors of “non-ACMd” even though asbestos content was> 0.1w%.
Sample No. Experimenter No.: comment Authors’ comment
Loupe Microscope
9 5: NE TP
26 4: NE 2: NE TP
28 5: EF 2: NE TP
92 4: EF, 5: EF 1: EF, 3: EF TP+ EF
106 4: NE 5: NE TP
NE: non-existence of any fibers, EF: existence of some fibers that were not asbestos, TP: typical asbestos fiber
5.2. Simulation for Asbestos Content in Sorted CDW
The authors considered sorting CDW containing ACM. CDW was assumed to be composed of 1000 CDWPs, and all
particles were assumed to have uniform weight. A distribution of Cn along with n was set optionally. In actuality, CDWPs
with various asbestos contents should exist. For simplification of simulation, particle number n was set in order of low asbestos content for 1000 CDWPs. In actuality, CDWPs with
extremely low asbestos contents, i.e., non-ACM, would account for a large percentage and a small percentage of ACM would be mixed. Thus, considering the relationship between particle number n and Cn mentioned above:
Cn = Cmax / {1 + xexp(yn)}, (6)
where Cmax is the maximum asbestos content in CDWPs [w%],
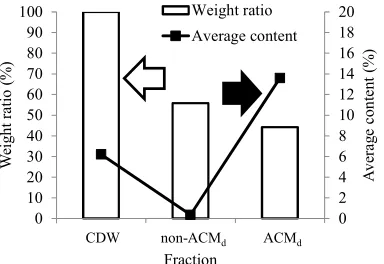
and x and y are the coefficients of the logistic curve. Three conditions of content distribution (C1 – C3) were assumed. The coefficients of x and y were 106 and −0.02 for C1, 107 and −0.02 for C2, and 107 and −0.017 for C3, respectively (Fig. 7). The weight and asbestos content of CDW before and after sorting were obtained using the model mentioned above. Simulation results of sorting by the loupe method are shown in Table 4 (C1 – C3) and Fig. 8 (C1). Overall separation efficiency (OSE) was also calculated using (7) (Table 4) [15].
OSE = Recovery ratio of objective component– Recovery ratio of non-objective component (7)
The low asbestos content in the non-ACMd fraction (CnonA)
compared to that of CDW before sorting could be represented. However, 0.35 w% of asbestos still remained in the non-ACMd fraction, i.e., the content was > 0.1 w%. Then, the
major part of CDWPs that constituted the remaining asbestos
in the non-ACMd fraction was investigated. The contribution
ratio of the asbestos content to the non-ACMd fraction was
calculated by dividing CDWPs into three groups (Group low:
< 0.1 w%, Group middle: 0.1 – 5 w%, Group high: ≥ 5 w%) according to their asbestos contents, as shown in Fig. 7. The
results obtained by the loupe method (C1) are 3% for Group low, 53% for Group middle, and 44% for Group high, respectively. Asbestos contained in Group middle accounted for 53 w% of the total asbestos in the non-ACMd fraction, i.e.,
that was the major reason for the remaining asbestos. Then, considering the relationship between asbestos content and identification rate shown in Fig. 5, the identification rate increased drastically from 0 to 1 in the range of Group middle. If the identification rate were 0 or 1, CDWPs would be sorted
specifically into the non-ACMd or ACMd fraction,
respectively. On the other hand, as CDWPs would be sorted
into both non-ACMd and ACMd fractions in the identification
rate range of 0 to 1, asbestos content in the non-ACMd fraction
would increase. However, CDWPs assignable to Group middle
used in this study did not exist, as shown in Fig. 5, and actual construction materials that have that asbestos content, i.e., Group middle, also did not exist according to database for asbestos-containing material [16]. Thus, because CDWP
assignable to Group middle that did not actually exist increased the asbestos content in the non-ACMd fraction, if the
distribution model around Group middle were elaborated, the calculated asbestos content in the non-ACMd fraction would
decrease. 0 2 4 6 8 10 12 14 16 18 20
0 500 1000
A sb es to s co n te n t (w % ) particle No. C1 C2
C3 Group high: ≥ 5 w%
Group middle: 0.1‒5 w%
Group low: < 0.1 w%
Figure 7. Assumed distributions of asbestos content in CDWPs.
0 2 4 6 8 10 12 14 16 18 20 0 10 20 30 40 50 60 70 80 90 100
CDW non-ACMd ACMd
A v er ag e co n te n t (% ) W ei g h t ra ti o ( % ) Fraction Weight ratio Average content
CDW non-ACMd ACMd
Figure 8. Simulation results of sorting (loupe, C1).
Table 4. Simulation results of sorting by loupe method.
CDW non-ACMd ACMd
C1
Weight ratio w% 100 56 44
Ave. asbestos content w% 6.20 0.35* 13.59**
OSE − 0.56
Sorting time h·person/particle 6.5×10⁻³
C2 Weight ratio w% 100 66 34
CDW non-ACMd ACMd
OSE − 0.64
Sorting time h·person/particle 7.2×10⁻³
C3
Weight ratio w% 100 78 22
Ave. asbestos content w% 1.45 0.29* 5.62**
OSE − 0.64
Sorting time h·person/particle 7.9×10⁻³
*CnonA, **CA
5.3. Simulation for Necessary Resources of ACM Sorting
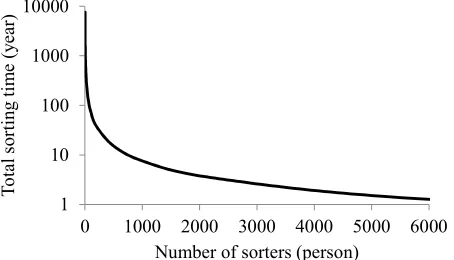
As many buildings constructed with ACM were destroyed by the Great East Japan earthquake (March 11th, 2011), the disaster waste would contain ACM. Therefore, the necessary resources (only labor cost) were calculated from the time required for ACM sorting in disaster waste.
Assuming that CDW accounted for 53 w% of all disaster wastes (1.9×10⁷ t) [17] and W of average weight of CDWP was
500 g/particle, the total weight of CDW would be 1.0×10⁷ t and the number of CDWPs, 1.0×10¹⁰. According to the
results of this study, as the time required for C1 was 6.5×10⁻³ (h person)/particle, the relationship between the number of sorters and total sorting time Ttotal would be obtained, as
shown in Fig. 9. Assuming that the labor cost was 10,000 yen/(d person) (98 yen/US$, Oct.23th, 2013) , 27.7 billion yen would be required, i.e., the necessary resources for sorting were immense.
1 10 100 1000 10000
0 1000 2000 3000 4000 5000 6000
T
o
ta
l
so
rt
in
g
t
im
e
(y
ea
r)
Number of sorters (person)
Figure 9. Relationship between number of sorters and total sorting time Ttotal (loupe, C1).
5.4. Efficient Sorting
From Fig. 9, it was found that a very long sorting time and a large number of sorters of the disaster waste were required. The very long sorting time should be due to the use of the check-all-particles method for the determination and sorting. We surmised that the sorting time would be shortened if the exploration (random walk) method were adopted. In addition, many CDWP samples used in this study looked alike. If the
determination were conducted after presorting of the same types of CDWP, the sorting time would be shortened as well.
6. Conclusions
After participating in a short training course for asbestos-containing material (ACM) determination, persons
who did not have any knowledge of the determination of asbestos fiber were able to determine ACM in construction and demolition waste (CDW) by visual observation. Using the results of visual observation, an ACM sorting model was formulated. The model enabled simulation of asbestos content after sorting by inputting asbestos content distribution into CDW before sorting. The asbestos content in the non-ACM fraction after sorting was > 0.1 w%. One of the reasons was that CDWP was assumed to have an unrealistically low
asbestos content (0.1 – 5 w%).
The relationship between the number of sorters and the total sorting time for the disaster waste from the Great East Japan earthquake was shown. It was found that a very long time and a large number of people were required for sorting. As the very long sorting time should be due to the use of the check-all-particles method, the sorting time would be shortened if the exploration (random walk) method were adopted.
By adopting the results obtained from disaster waste sorting sites, the necessary resources (number of sorters and sorting time) would be estimated. In addition, the results can be used to prepare a manual for ACM removal at building demolition sites and intermediate treatment facilities for CDW, and for the estimation of sorting accuracy.
Acknowledgements
The authors thank the Ministry of Environment for a “Grant-in-Aid for Scientific Research on Waste Treatment” under the project “Establishment of screening methods of asbestos-containing construction materials, and safety assessment of recycled crushed stone (FY 2011 to 2013).”Special thanks are extended to Ecotest Company Limited for analyzing the asbestos content.
References
[1] Saitama Japan Industrial Waste Association (ed.), 2011. Safety management manual for aggregate recycling. Saitama, Japan (in Japanese).
[2] Bishop, K., Ring, S.J., Zoltai, T., Manos, C.G., Ahrens, V.D., Lisk, D.J., 1985. Identification of asbestos and glass fibers in municipal sewage sludges. Bulletin of Environmental Contamination and Toxicology 34 (1), 301–308.
[4] Plescia, P., Gizzi, D., Benedetti, S., Camilucci, L., Fanizza, C., De Simone, P., Paglietti, F., 2003. Mechanochemical treatment to recycling asbestos-containing waste. Waste Management 23 (3), 209–218.
[5] Min, S., Maken, S., Park, J., Gaur, A., Hyun, J., 2008. Melting treatment of waste asbestos using mixture of hydrogen and oxygen produced from water electrolysis. Korean Journal of Chemical Engineering 25 (2), 323–328.
[6] Zaremba, T., Peszko, M., 2008. Investigation of the thermal modification of asbestos wastes for potential use in ceramic formulation. Journal of Thermal Analysis and Calorimetry 92 (3), 873–877.
[7] Gualtieri, A.F., Giacobbe, C., Sardisco, L., Saraceno, M., Gualtieri, M.L., Lusvardi, G., Cavenati, C., Zanatto, I., 2011. Recycling of the product of thermal inertization of cement–asbestos for various industrial applications. Waste Management 31 (1), 91–100.
[8] Osada, M., Takamiya, K., Manako, K., Noguchi, M., Sakai, S., 2013. Demonstration study of high temperature melting for asbestos-containing waste (ACW). Journal of Material Cycles and Waste Management 15 (1), 25–36.
[9] Radvanec, M., Tuček, Ľ., Derco, J., Čechovská, K., Németh Z., 2013. Change of carcinogenic chrysotile fibers in the asbestos cement (eternit) to harmless waste by artificial carbonatization: Petrological and technological results. Journal of Hazardous Materials 252–253, 390–400.
[10] Ruud, C.O., Barrett, C.S., Russell, P.A., Clark, R.L., 1969. Selected area electron diffraction and energy dispersive X-ray
analysis for the identification of asbestos fibres, a comparison. Micron 7 (2), 115–132.
[11] Pooley, F.D., 1975. The identification of asbestos dust with an electron microscope microprobe analyser. The Annals of Occupational Hygiene 18 (3), 181–186.
[12] Taylor, D.G., Baron, P.A., Shulman, S.A., Carter, J.W., 1984. Identification and counting of asbestos fibers. American Industrial Hygiene Association Journal 45 (2), 84–88. [13] Bard, D., Yarwood, J., Tylee, B., 1997. Asbestos fibre
identification by Raman microspectro scopy. Journal of Raman Spectroscopy 28 (10), 803–809.
[14] Bassani, C., Cavalli, R.M., Cavalcante, F., Cuomo, V., Palombo, A., Pascucci, S., Pignatti, S., 2007. Deterioration status of asbestos-cement roofing sheets assessed by analyzing hyperspectral data. Remote Sensing of Environment 109 (3), 361–378.
[15] Asakura, H., Watanabe, Y., Ono, Y., Yamada, M., Inoue, Y., Alfaro, A.M., 2010. Characteristics of fine processed construction and demolition waste in Japan and method to obtain fines having low gypsum component and wood contents. Waste Management and Research 28, 634–646.
[16] Japan ML (Ministry of Land, Infrastructure and Transport in Japan) (ed.), 2006. Database for asbestos containing material, Tokyo, Japan (in Japanese).