Tracer Study Of Graduates Of The College Of
Industrial Technology
Dr. Philip Y. Del Rosario
Batangas State University – Pablo Borbon Main II
College of Industrial Technology Batangas City, Batangas, 4200 Philippines [email protected]
Abstract: People live in a rapidly changing world with the diverse demands and challenges. They additionally call on universities to
facilitate the shift to cognizance-predicated economy and high-technology through efficacious linkages between research and industry to ascertain that their countries have a competitive edge in the ecumenical market. This study used the descriptive method of research and survey questionnaire as the main data gathering instrument to trace the Batangas State University-College of Industrial Technology graduates of the Bachelor of Industrial Technology program from 2013-2016. Based from the findings, the Bachelor of Industrial Technology graduates mostly were male, 20-24 years old, single and graduates of Instrumentation and Control Technology. In term of educational profile, the Bachelor of Industrial Technology graduates across major of specialization have no professional examination but they are willing to pursue advance studies for professional development. In terms of employment, BIT graduates were mostly employed, end of contract was the reason for unemployment, they get their jobs for 2-5 months, they have one job after graduation, permanent in status, locally employed in non-government organizations for less than 7 months, and most jobs were relevant to their major of specialization. Lastly, the proposed recommendations to further enhance the employability Bachelor of Industrial Technology focused mainly on National Certifications, attendance to seminars and training, and meeting with advisory councils.
Keywords: employment, graduates, professional development, profile, tracer study.
1.
Introduction
Preparing adolescent people to enter the labor market has therefore become a critical responsibility for universities. However, the pertinence of their program and employability of their graduates are posing an incrementing challenge for the universities, concretely in view of two sets of statistics: enrollment and youth unemployment rates. Since Batangas State University is the only state university located in Batangas, it plays a significant role in the upliftment of employment, and thus helps the government. The Batangas State University, like all other universities aspires for the effective performance of its students. It is true to its vision of being a center of higher learning committed to the promotion of wisdom, excellence, human dignity and national pride in the Filipino. [1] However, given the wide comprehension of employability, perceive that the nature of a college graduate is not only an impression of the nature of the educational modules and its supporting academic environment. It also reflects the demands of the industry and also the competence of the regulating body in shaping the characteristics of higher education graduates. It might be excessively oversimplified to note that universities are encouraged, if not pressured, to produce employable graduates. In addition, professional-level training is constantly included inside Higher Education, and as a rule in graduate schools, since many postgraduate academic disciplines are both vocationally, professionally, and the erotically research oriented, such as in the law, medicine, pharmacy, dentistry, and veterinary medicine. A basic requirement for entry into these graduate-level programs is almost always a bachelor's degree, although alternative means of obtaining entry into such programmers may be accessible at some universities. The Bachelor of Industrial Technology program offers students with knowledge in the manufacturing process, electronic and mechanical components and systems, quality assurance and control, materials science, packaging, production and operations management, and manufacturing and design. Each specialization, cumulated with a certificate and/or
betterment of the college and attainment of its program goals.
2.
Objectives of the Study
The primary purpose of the study is to trace the Bachelor of Industrial Technology graduates of 2013-2016. Specifically, it attempts:
1. To describe the profile of the respondents in terms of sex, age, civil status, and major of specialization. 2. To determine the educational profile in terms of
professional examination passed, advanced studies, and reasons of pursuing advance studies.
3. To determine the employment, reasons not employed, number of months before getting first job, number of jobs after graduation, nature of employment, place of work, nature of work, length of service, and relevance of job to course.
4. To propose recommendation to further enhance the employability of Bachelor of Industrial Technology graduates.
3.
Methodology
The study used the descriptive method for the 1193 graduates or 79 percent of the total 1519 graduates were traced. Survey questionnaire was used as the main data gathering instrument. The list of graduates was requested from the University Registrar and gathering was done from November to February 2017.
4.
Results and Discussions
4.1 Profile of the BIT Graduates
The profile of BIT graduates were described in terms of sex, age, civil status, and major of specialization.
Sex. Figure 1 and 2 shows the distriution of BIT gradautes according to sex. It can be gleaned from the figure that there is gender and equality in the technology courses of the College of Industrial Technology.
Figure 1. Distribution of Graduates According to Sex per Major of Specialization
Figure 2. Distribution of Graduates According to Sex
The College of Industrial Technology was able to educate male and female students with 86 and 14 percent respectively. Thus, the technical field of education is more enticing on the male population. [5] But the Gender and Development encourages incoming students to consider the technical fields for their career opportunities.
Age. Figure 3 and 4 shows the distribution of graduates according to age.
Figure 3. Distribution of Graduates According to Age per Major of Specialization
Figure 4. Distribution of Graduates According to Age
27 1 14 8
56 45 28
10 81
7 17 4 6 21 535
45 209
20 28 2 26 3
0 100 200 300 400 500 600
M F M F M F M F M F M F M F M F M F M F M F
AT CvT CpT DT ElT ElxT FT ICT MT MxT WFT
Fre
q
u
en
cy
Major of Specialization
23 5 0 16 5 1 45 45 11 33 3 2
72
15 1 14 4 3 25 2 0 494
84
2 192
37
0 15 12 3 23 6 0
0 100 200 300 400 500 600
20-24
30
and
above
25-29
20-24
30
and
above
25-29
20-24
30
and
above
25-29
20-24
30
and
above
25-29
20-24
30
and
above
25-29
20-24
30
and
above
AT CvT CpT DT ElT ElxT FT ICT MT MxT WFT
Fre
q
u
en
cy
Based of the tracer study, most of the CIT graduates were 20-24 years old with 80 percent of the total population and they were considered ideal age for the need of the labor market. Accordingly, these age ranges were more on competitive, talented, and can be developed for future productive workforce. [6]
Civil Status. Figure 5 and 6 shows the distribution of graduates according to civil status.
Figure 5. Distribution of Graduates According to Civil Status per Major of Specialization
Figure 6. Distribution of Graduates According to Civil Status
With 94 percent and 6 percent of the total population, it is very clear that most of the BIT graduates were single and married, respectively. These imply that most graduates can increase their attachments and engagement in work. [7] They are more flexible to perform jobs that may be assigned from time to time.
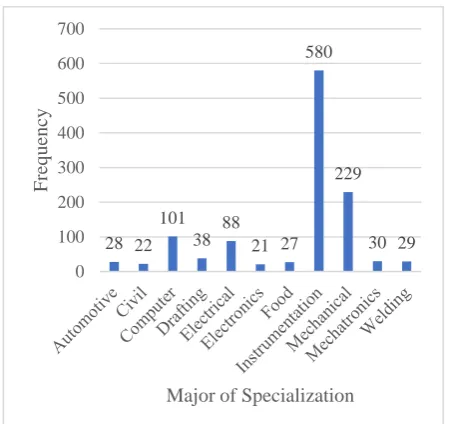
Major of Specialization. Figure 7, 8, and 9 shows that distribution of graduates according to major or specialization.
Figure 7. Distribution of Graduates According to Major of Specialization
Figure 8. Distribution of Electrical Technology Graduates
Figure 8. Distribution of Instrumentation and Control Technology Graduates
Based on the gathered data, Electrical Technology and Instrumentation and Control Technology only have 96 and 72 percent of traced graduates, respectively. One of the main reasons given by the researchers were the unresponsiveness 27
1 21 1 94
7 31 7 81
7 19 2 25 2 563
17 212
17 28 2 25 4
0 100 200 300 400 500 600 S ingl e M a rr ied S ingl e M a rr ied S ingl e M a rr ied S ingl e M a rr ied S ingl e M a rr ied S ingl e M a rr ied S ingl e M a rr ied S ingl e M a rr ied S ingl e M a rr ied S ingl e M a rr ied S ingl e M a rr ied
AT CvT CpT DT ElT ElxT FT ICT MT MxT WFT
Fre
q
u
en
cy
Major of Specialization
28 22 101
38 88
21 27 580
229
30 29
0 100 200 300 400 500 600 700 Fre q u en cy
of the graduates. Thus, BatStateU-Alumni Office was having a massive companign in terms of tracer studies. They have Alumni Orientation Programs to educate graduates regarding the importance of said Tracer Study.
4. 2 Educational Profile of BIT Graduates
The educational profile was presented in terms of professional examination passed, advanced studies, and reasons of pursuing advance studies.
Professional Examination Passed. Figure 10 shows the education profile of BIT graduates according to professional examination passed.
Figure 10. Education Profile of BIT Graduates According to Professional Examination Passed
Based on the data presented, most of the CIT graduates were no professional examination at 81 percent. This result was already been addressed by the department and required students to take any professional examination related to their field of specialization. [8]
Advance Studies. The educational profile of BIT graduates in terms of advanced studies was presented in figure 11.
Figure 11. Education Profile of BIT Graduates According to Advance Studies
The Bachelor of Industrial Technology graduates were willing to have advance education at 55 percent of the total population. These figures suggets that BIT graduates continuously search for advancement in their professional career. Moreover, the search for advance studies will help them to become more acquianted to advance technology and processes that will be applicable to industrial settings.
Reasons of Pursuing Advance Studies. Figure 12 shows the educational profile according to the reason of pursuing advance studies.
Figure 12. Education Profile of BIT Graduates According to the Reasons of Pursuing Advance Studies
It can be observed that there are 62, 31, and 7 percent distribution of Bit graduates pursue advance education for professional development, unresponsive, and promotion. The goal of BIT graduates to professionally develop was also evident with their enthusiasm to become top executives of their own field of specialization. [9]
4.3 Employment of BIT Graduates
In terms of employment, BIT graduates were traced according to their reasons of unemployment, number of months before getting first job, number of jobs after graduation, nature of employment, place of work, nature of work, length of service, and relevance of job to course.
Employment Status. The employment status of BIT graduates was presented in figure 13 and 14.
Figure 13. Employment Status of BIT Graduates According to Year Graduated
0 50 100 150 200 250
2013 2014 2015 2016
Fre
q
u
en
cy
Year Graduated
Figure 14. Employment Status of BIT Graduates
Sixty-eight percent of the total population were employed while only 26 percent were still searching for jobs. This figure is still above the 2016 national employment rate of the Department of Labor and Employment. [10] Thus, BIT graduates were employable and was able to impart in the national economy.
Reasons for Unemployment. Figure 15 presents the reasons why BIT graduates were not employed.
Figure 15. Reasons of BIT Graduates for Unemployment
Most of the reasons of BIT graduates of unemployment is end of contract with 287 of the total responsdents and the least was pregnancy for female graduates. The issue of end of contract was very evident both in manufatcuring and service industries and this also hampers the career development and security of tenure of most of the working professionals. [11] On the other hand, the new government policy of Endo was significant to BIT graduates for them to be able to have continuous employment.
Number of Months before Getting First Job. Figure 16 and 17 shows the number of months before a BIT graduate can get his or her first job.
Figure 16. Number of Months before Getting First Job According to Year Graduated
Figure 17. Number of Months before Getting First Job
Most of the graduates or 42 percent was able to find jobs in 2-5 months after graduation. Only six (6) percent find jobs in more than 1 year. This figures suggests the employability of BIT graduates and how easy they can find jobs related to their field.
Number of Jobs after Graduation. Figure 18 and 19 present the number of jobs BIT graduates have after graduation.
6 3 7 287
25 3 6
210 250
50 21
2 7 4
0 50 100 150 200 250 300 350
Fre
q
eu
n
cy
Reasons
0 20 40 60 80 100 120 140 160
2013 2014 2015 2016
Fre
q
u
en
cy
Year Graduated
Figure 18. Number of Jobs after Graduation According to Year Graduated
Figure 19. Number of Jobs after Graduation
Based on the figure above, BIT graduates mostly have 1 job while the leaast were 5 jobs with 39 and 1 percent, respectively after graduation. Job satisfaction, promotion, and professional advancement were some of the reasons why the graduates were able to stay in a certain employment. [12]
Nature of Employment. Figure 20 and 21 shows the nature of employment of BIT graduates.
Figure 20. Nature of Employment According to Year Graduated
Figure 21. Nature of Employment
Thirty-four percent of the total population were permanent, 29 percent contratual, 17 percent no employment, 10 percennt temporary, four percent casual, self-employed and 2 percent were job orders. These figures were significant in the employment statuts of BIT graduates since the permanent status indicates security of tenure. [13]
Place of Work. The place of work is presented in figure 22 and 23.
Figure 22. Place of Work According to Year Graduated
Figure 23. Place of Work
0 50 100 150 200
2013 2014 2015 2016
Fre
q
u
en
cy
Year Graduated
None 1 2 3 4 5 No Reponse
0 50 100 150
2013 2014 2015 2016
Fre
q
u
en
cy
Year Graduated
Permanent Temporary
Self-employed Casual
Contractual Job Order
None
191 199 217
312
88
53
96
37
0 50 100 150 200 250 300 350
2013 2014 2015 2016
Fre
q
u
en
cy
Year Gradauted
Sevety-seven percents of the BIT graduates were employed in local companies and 23 percent were in abroad. It is also evident that the international labor market considers hiring and employing BIT graduates. Thus, the graduates were also flexible in terms of place of work and were able to adopt to different nationalities and competencies needed in their jobs. [14]
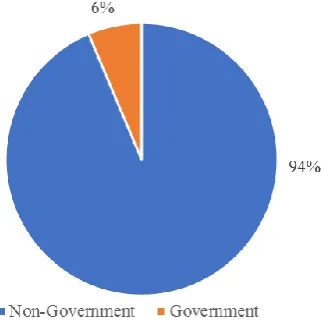
Nature of Work. Figure 24 and 25 shows the nature of work of BIT graduates.
Figure 24. Nature of Work According to Year Graduated
Figure 25. Nature of Work
Based on the figure above, BIT graduates were mostly employed in non-government institution like private organizations and companies with 94 percent and 6 percent only for governemnt organization. These employment were substantive since their on-the-job trainings were also done in manufacturing/ private companies. The massive need of technologiest and technicians in the private organizationas paves the way for BIT graduates to look for employment in non-government orgnaization. [15] Likewise, there is high income opportunities in private organization as compared to public. [16]
Length of Service. Figure 26 and 27 shows the length of service of BIT graduates in their present job.
Figure 24. Length of Service According to Year Graduated
Figure 27. Length of Service
With regards to the length of service to present job, most of the BIT graduates were less than 7 months with 33 percent of the total population. On the other hand, 18 percent for no lenth of service yet, 17 percent for more than 24 months, 15 percent for 7-12 months, 10 percent for 13-18 months, and 7 percent for 19-24 months. The length of service BIT graduates rendered in their present job implies job satisfaction and expertise. [17]
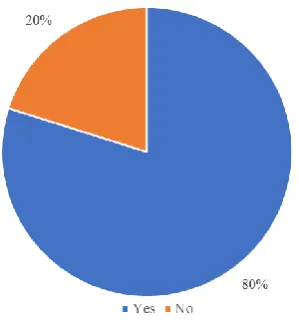
Relevance of Job to Course. Figure 28 and 29 shows the relevance of job to course as perceived by BIT graduates.
22 10 24 20
256
241
287
331
0 50 100 150 200 250 300 350
2013 2014 2015 2016
Fre
q
u
en
cy
Year Graduated
Government Non-Government
43 49
90
214
46
35
59
43
28 34
54
1
24 30
18
7 104
47
40
14 34
57 52
70
0 50 100 150 200 250
2013 2014 2015 2016
Fre
q
u
en
cy
Year Graduated
Less than 7 months 7-12 months
13-18 months 19-24 months
Figure 28. Relevance of Job to Course According to Year Graduated
Figure 28. Relevance of Job to Course
Eighty percent of the BIT graduates from 2013 to 2016 said that their program was related to the present job while only 20 percent were not related. Most of the traced-graduates uttered that they were satisfied and motivated to do their job. This affirms that BIT graduates were able to adopt to the changing need of the workforce and can able to withstand challenges in the industrial sector. [18]
4.4 Proposed Recommendations to Further Enhance the Employability Bachelor of Industrial Technology Graduates
1. The College of Industrial Technology may require all incoming fourth-year students to take and pursue TESDA-National Certification II or III whichever is applicable based on the major of specialization.
2. The Bachelor of Industrial graduates were encouraged to attend seminar and pursue post-graduate studies to further enhance their knowledge and skill and to respond to the challenges and demands of global market.
3. CIT may use the result of the study in the Industry Advisory Council meeting to determine the most appropriate strategies to meet industry demands.
5.
Conclusions
Based from the findings, the following conclusions are drawn:
1. The Bachelor of Industrial Technology graduates mostly were male, 20-24 years old, single and graduates of Instrumentation and Control Technology.
2. In term of educational profile, the Bachelor of Industrial Technology graduates across major of specialization have no professional examination but they are willing to pursue advance studies for professional development. 3. In terms of employment, BIT graduates were mostly
employed, end of contract was the reason for unemployment, they get their jobs for 2-5 months, they have one job after graduation, permanent in status, locally employed in non-government organizations for less than 7 months, and most jobs were relevant to their major of specialization.
4. The proposed recommendations to further enhance the employability Bachelor of Industrial Technology focused mainly on National Certifications, attendance to seminars and training, and meeting with advisory councils.
References
[1]The Dual Training System [Internet] Available
at:http://batstate-u.edu.ph/college-of-industrial-technology (Accessed October 2016)
[2]TESDA Competency Assessments [Internet] Available at: http://www.finduniversity.ph/majors/bs-in-industrial-technology-philippines/ (Accessed October 2016)Bagano, April Jane S. and de Ocampo, M. Banxuela.(2012). Culture of Entrepreneurship versus Employment. Retrieved from October 9, 2016 from ddh.epage.au.edu.tw/bin/downloadfile.php?file
[3]Ilagan, Phillip Angelo H., Noga, Renz Walter D., and Vergara, Maurey D. (2016). Tracer Study of BIT Instrumentation and Control Technology Graduates of Batangas State University.
[4]CHED Graduate Tracer. (2013) www.ched.gov.ph/wp-content/uploads/2013/05/CHED-00000016.pdf
[5]Graduate Employability in Asia. Retrieved From http://unesdoc.unesco.org/images/0021/002157/215706E. pdf
[6]Oak, M. (2010). Preference of Employers in the Advancement of the Skills of their Employees Journal of Competency.
[7]Millington (n.d.). The use of tracer studies for enhancing relevance and marketability in online and distance education. Retrieved June, 01 2010 from http://-wikieducator.org/-images/e/e1/-PID_424.pdf
[8]Fitzpatrick, Joyce J. ,PhD, MBA, RN, FAAN, Kazer, Meredith, PhD, APRN, A/GNP-BC (2011). Encyclopedia of Nursing Research, Third Edition. Springer Publishing Company, 2011.
[9]Dinio, R. and Pagoso, C., (2006). Labor Economics (updated edition) Francisco, Z., (2012) Teaching and
216 207
261 269
64
44 52
80
0 50 100 150 200 250 300
2013 2014 2015 2016
Fre
q
u
en
cy
Year Gradauted
Learning. Principle and Methods of Teaching. National Bookstore Publishing.
[10] Colinares, N., (2010). 21stCentury Trends, Issues and Challenges in Philippine Education
[11] Noe, R., (2010). Employee Training and Development
[12] Philippines Unemployment Rate, (2016). Retrieved from:http://www.tradingeconomics.com/philippines/une mployment-rate
[13] De Castro, R., Mendoza, N.J., Pasague, R., (2013) Employment Status of Industrial Technology major in Mechanical Technology Graduates from 2007 – 2011
Civil Technology, retrieved from:
http://www.lcc.edu/design/civil/
[14] Improving Higher Education Quality, a Daydream,
(May, 2011). retrieved from:
https://dokterphi.wordpress.com/tag/tracer-study/
[15] Employment Rate[Internet] Available at:
http://wikiprogress.org/articles/jobs-and-work/employment-rates/ (Accessed December 2016)
[16] Employment Status[Internet] Available at: http://www.acas.org.uk/index.aspx?articleid=5071(Acces sed December 2016)
[17] Industrial Technology[Internet] Available at: http://www.finduniversity.ph/majorsbs-in-industrial-technology-philippines/(Accessed December 2016)
[18] Job description[Internet] Available at: https://en.wikipedia.org/wiki/Job_description(Accessed December 2016)