http://www.sciencepublishinggroup.com/j/ajese doi: 10.11648/j.ajese.20170104.13
Application Use of Water Quality Index (WQI) and
Multivariate Analysis for Nokoué Lake Water Quality
Assessment
Josué Esdras Babadjidé Zandagba
1, *, Firmin Mahoutin Adandedji
1, Bruno Enagnon Lokonon
2,
Amédée Chabi
1, Oswald Dan
3, Daouda Mama
11
Laboratory of Applied Hydrology, University of Abomey-Calavi, Calavi, Benin
2
Laboratory of Biomathematics and Forest Estimations, University of Abomey-Calavi, Calavi, Benin
3
Laboratory of Hydraulics and Control of Water, University of Abomey-Calavi, Calavi, Benin
Email address:
zjosua@yahoo.fr (J. E. B. Zandagba), firminelite@gmail.com (F. M. Adandedji), brunolokonon@gmail.com (B. E. Lokonon), amedees2005@yahoo.fr (A. Chabi), oswalddan01@gmail.com (O. Dan), mkdaouda@yahoo.fr (D. Mama)
*
Corresponding author
To cite this article:
Josué Esdras Babadjidé Zandagba, Firmin Mahoutin Adandedji, Bruno Enagnon Lokonon, Amédée Chabi, Oswald Dan, Daouda Mama. Application Use of Water Quality Index (WQI) and Multivariate Analysis for Nokoué Lake Water Quality Assessment. American Journal of Environmental Science and Engineering. Vol. 1, No. 4, 2017, pp. 117-127. doi: 10.11648/j.ajese.20170104.13
Received: November 21, 2017; Accepted: December 4, 2017; Published: January 3, 2018
Abstract:
Due to its location and multiple uses, Nokoué Lake, is subject to multiple attacks impairing water quality. The present work aims at assessing the water quality index (WQI) on this surface water, by monitoring twenty sampling locations for a period of rainy and dry season in 2016. For calculating the WQI, seven parameters, namely, pH, dissolved oxygen, turbidity, electrical conductivity, Biochemical oxygen demand, nitrite and nitrate were considered. Statistical tests and conclusions were made on the basis of a multiparametric model. Thus, to evaluate significant differences among the sites for all water quality variables, data was analyzed using one-way analysis of variance (ANOVA) at 0.05% level of significance. Multivariate analysis of the water quality data sets was performed using Hierarchical Cluster analysis (HCA) and Principal Component Analysis (PCA). The results showed that WQI values ranged from 93.96 (good water quality) in rainy season to 100.73 (bad water quality) in dry season. The values of physicochemical parameters significantly increased from rainy to dry season. Water quality of Nokoué Lake can be categorized into "Good water" during the rainy season to "Poor water" during the dry season. Application of the WQI is suggested as a very helpful tool that enables decision makers to evaluate water quality.Keywords:
Lake, Water Quality, WQI, Multivariate Analysis1. Introduction
Water is one of the most vital natural resources for all life on Earth. Water is also considered to be one of the most abundant commodities in nature but also misuse one. Today surface water is most vulnerable to pollution due to its easy accessibility for disposal of pollutants and wastewater [1]. The need (essentiality and importance) of water in the lives of living organisms can never be undermined for its supportive role. Indeed, the availability and quality of water have always played an important part in determining not only where people can live, but also their quality of life [2]. It is therefore necessary that the quality of water is checked at
regular time intervals, because the human population can suffer from a variety of waterborne diseases due to contaminated drinking water.
Quantitative assessment of water quality is an essential aspect of efficient water resource management. In recent era, evaluation of water quality has become a serious issue because of the grave concern that fresh water will be a scarce resource in the future [3]. Meeting water quality expectations for streams and rivers is also a pre-requisite to protect ground water resources [4]. So Water quality in an aquatic ecosystem is determined by many physical, chemical and biological factors [5].
large number of measured variables [6], and high variability due to anthropogenic and natural influences [7]. There are a number of methods to analyze water quality data that vary depending on informational goals, the type of samples, and the size of the sampling area. Research in this area has been extensive, as indicated by the number of methods proposed or developed for classification, modeling and interpretations of monitoring data [8] [9]. Moreover, it has been realized that the use of individual water quality variable in order to describe the water quality for common public is not easily understandable [10] [11].
To address the above concerns, the concept of water quality index (WQI) has been developed in many countries and found to be simple as well as effective in evaluating composite water pollution level [4].
Indeed, WQI has the capability to reduce the bulk of the information into a single value to express the data in a simplified and logical form [12]. It takes information from a number of sources and combines them to develop an overall status of a water system [13] [14]. They increase the understanding ability of highlighted water quality issues by the policy makers as well as for the general public as users of the water resources [15].
The nonlinear nature of environmental data makes spatio-temporal variations of water quality often difficult to interpret and for this reason statistical approaches are used for providing representative and reliable analysis of the water
quality [16]. Multivariate statistical techniques such as cluster analysis (CA) and factor analysis (FA) have been widely used as unbiased methods in analysis of water quality data for drawing out meaningful conclusions [17] [18]. Also it has been widely used to characterize and evaluate water quality for analyzing spatio-temporal variations caused by natural and anthropogenic processes [19] [20].
Lake Nokoué, the object of this study, because of its location and its exploitation undergoes human aggression. Indded the waterside populations brought in the lake an important quantity of wooden discharges of all kinds which added to the important mass of sand drained by erosion led to its filling. The decomposition of this huge amount of boughs discharged every year in our streams requiring an important quantity of dissolved oxygen for their degradation is the cause of the insufficient dissolved oxygen quantity for the halieutic species. The consequence in short- or long-term is the anoxia of the environment, which can lead to halieutic species death. The deposits of these boughs impact negatively not only the traffic but also the swimming.
The objective of this paper is, therefore, to study the suitability of Nokoué’s water for multiple purposes, using the data obtained through quantitative analysis and water quality standards. The study will also employ Cluster and Principal Components Analysis as complementary tool to delineate areas with water quality deterioration and possible sources of pollution in the study area.
2. Materials and Methods
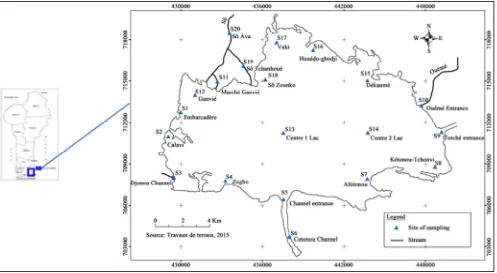
2.1. Description of the Study Area
Figure 1. Nokoué’s location map and the sampling sites.
located in the south of Benin, between Latitude 6 ° 25 and 6 ° 30 North and longitude 2 ° 20 and 2 ° 40 East. (Figure 1). It is characterized by a subtropical climate, and undergoes two rainy seasons and two dry seasons of unequal duration. The average annual rainfall is 1309 mm, the average temperature of 27.7°C, with maximums up to 33°C and minimums at 23°C. This lake is connected to Porto-Novo lagoon at the East by the Totche Canal, at south by the Atlantic Ocean through the channel of Cotonou, and at north by the river Sô and Ouémé stream on which it depends [21]. This communication, together with the impact of natural flood of Sô and Ouémé stream, causes very significant seasonal variations of salinity which is parameter of that the variations during the year are the most important [22]. The lake could be considered ranging from shallow (0.4 to 3.4 m).
2.2. Sampling and Analysis of Water Samples
In order to assess the surface water quality, twenty different sampling stations were selected on the basis of the position (inlet, center and outlet of the lake), location of
probable impact areas and selected effluent discharge points. The Figure 1 shows surface water sampling locations, while their details have been mentioned.
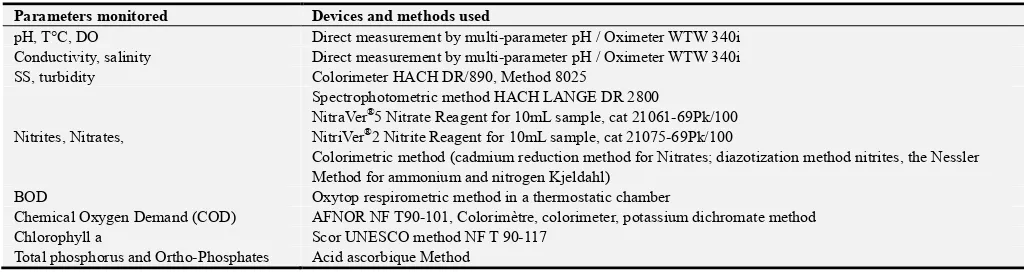
Water samples were collected in sterilized glass bottles for various physico-chemical analysis; the pre-cleaned plastic polyethylene bottles were used. Prior to sampling, the entire sampling containers were washed and rinsed thoroughly with lake water to be taken for analysis. The collected surface water samples were collected from these twenty locations in a 1.5 L pre-cleaned polyethylene bottles for a period of one year from February to November 2016. In situ parameters like Potential Hydrogen (pH), Suspend Solid (SS), Dissolved Oxygen (DO), salinity and temperature (T°C) were measured in the field immediately after sampling. The standard analytical procedures as recommended by the American Public Health Association were employed in the present study. In laboratory, the nutrients as Nitrite (NO3-), Nitrate (NO2-), Biochemical oxygen demand (BOD), and Orthophosphates (PO43-), etc, were analyzed (Table 1).
Table 1. Standardized methods for physico-chemical parameters analysis.
Parameters monitored Devices and methods used
pH, T°C, DO Direct measurement by multi-parameter pH / Oximeter WTW 340i Conductivity, salinity Direct measurement by multi-parameter pH / Oximeter WTW 340i SS, turbidity Colorimeter HACH DR/890, Method 8025
Nitrites, Nitrates,
Spectrophotometric method HACH LANGE DR 2800
NitraVer®5 Nitrate Reagent for 10mL sample, cat 21061-69Pk/100 NitriVer®2 Nitrite Reagent for 10mL sample, cat 21075-69Pk/100
Colorimetric method (cadmium reduction method for Nitrates; diazotization method nitrites, the Nessler Method for ammonium and nitrogen Kjeldahl)
BOD Oxytop respirometric method in a thermostatic chamber
Chemical Oxygen Demand (COD) AFNOR NF T90-101, Colorimètre, colorimeter, potassium dichromate method Chlorophyll a Scor UNESCO method NF T 90-117
Total phosphorus and Ortho-Phosphates Acid ascorbique Method
2.3. Water Quality Index (WQI) Computing
Weighted arithmetic water quality index method classified the water quality according to the degree of purity by using the most commonly measured water quality variables. The method has been widely used by the various scientists [23] [24] [25] [26]. The index is a numeric expression used to transform large number of variables data into a single number, which represents the water quality level.
The calculation and formulation of the WQI involved the following steps:
1) In the first step. Each of the seven parameters has been assigned a weight (AWi) ranging from 1 to 4 depending on the collective expert opinions taken from different previous studies. The mean values for the weights of each parameter along with the references (Table 2). However a relative weight of 1 was considered as the least significant and 4 as the most significant.
2) In the second step, the relative weight (RW) was calculated by using the following equation:
RW=
1
i n
i AW
AW
∑
(1)
n: numbers of parameters AW: Assigned Weight RW: Relative Weight
3) In the third step, a quality rating scale (Qi) for all the parameter except pH and DO was assigned by dividing its concentration in each water sample by its respective standard according to the drinking water guideline recommended by the Ifremer, the result was then multiplied by 100.
Qi= i i C
S (2)
Ci: concentration obtained from laboratory analysis Si: Standard value (recommended for good water quality)
Qi(pH and DO) = [ i
i i
Ci V S V
−
Vi: ideal value which is considered as 7.0 for pH and 14.6 for DO.
Si: value of the water quality parameter obtained from recommended by World Health Organization
SIi=RW×Qi (4)
WQI =
∑
SIi (5)Table 2. References number adopted from literature [26].
References numbers
Mean value Parameters 10 23 34 35 36 37 38 39
pH 4 1 1 1 1 1 1 1 2.1
DO(mg/L) 4 4 4 4 4 4 4 4 4 Turb(NTU) 2 2 2 - - 4 2 - 2.4 Cond(µS/cm) 2 4 2 - 1 4 4 4 2.7 BOD(mg/L) 3 3 3 2 3 3 4 3 3 NO3-(mg/L) - 2 - 3 2 2 - 2 2.2 NO2-(mg/L) - 2 - - 2 2 - 2 2
Table 3. Assigned weight values adopted from literature [26].
Parameters Standards Weight (AW)
pH 5 - 9 2.1
DO(mg/L) 3 - 6 4.0
Turb(NTU) 5 2.4
Cond(µS/cm) 2000 2.7
BOD(mg/L) 10 3
NO3-(mg/L) 50 2.2
NO2-(mg/L) 0.06 2.0
Total - 18.4
2.4. Multivariate Statistical Methods
Factor analysis, a multivariate statistical method, yields the general relationship between measured chemical variables by showing multivariate patterns that may be help to classify the original data. It enables the geographical distribution of the resulting factors to be determined. The geological
interpretation of factors yields insight into the main processes, which may govern the distribution of hydrochemical variables. [28]
With the objective of evaluating significant differences among the sites for all water quality variables, data was analyzed using one-way analysis of variance (ANOVA) at 0.05% level of significance
Multivariate analysis of the water quality data sets was performed using Hierarchical Cluster analysis (HCA) and Principal Component Analysis (PCA). The goal of the clustering is to partition the objects into homogeneous groups, such that the within-group similarities are large compared to the between-group similarities. The Principal Components, on the other hand, are extracted to represent the patterns encoding the highest variance in the data set and not to maximize the separation between groups of samples directly.
The Statistical Package for R 3.3.2. Software was used for both the HCA and the PCA.
Arc Gis mapping software was used to represent the spatial and temporal distribution of some monitored parameters.
3. Results and Discussion
3.1. Application of Water Quality Index (WQI)
WQI is valuable and unique rating to depict the overall water quality status in a single term that is helpful for the selection of appropriate treatment technique to meet the concerned issues. WQI has been calculated for twenty sites on Nokoué lake.
The following figures indicate respectively the variation of the WQI at the sampling sites both in wet and dry periods
Figure 2. Water quality index variation in rainy season.
From the figure 2, it can be seen that during this period, none of the stations indicated poor quality water. The majority of the stations have a quality index between 50 and 100. Only stations 1, 3, 8, 9 and 10 have a quality index that is beyond the good quality of the water. The highest index is observed at point 10 and the lowest is observed in point 5.
The figure 3 reveals that in dry periods, sites 9 and 10 are
close to the classification of poor quality water. The majority of sites are within acceptable limits.
Figure 3. Water quality index variation in dry season.
The analysis of the figure 4 indicates that, considering all the seasons, only one site (site 3) exceeds the limit of very poor quality water, whereas the quality water is poor at the sites 5, 7, 8, 10 and 12. All the other sites, in contrary, present water of acceptable quality.
Figure 4. Global Water quality index variation.
Taking into consideration all the stations, it was observed the computed seasonal WQI is different from one season to another. The values are ranged from 93.96 in rainy season to 100.73 in dry season during the study period. So the water quality of Nokoué Lake can be categorized into "Good water" during the rainy season to "Poor water" during the dry season.
Several other studies based on WQI for untreated natural water conducted in India have also reported poor quality of water in summer and monsoon compared to the winter season [2]. [29] have also observed this situation in Ambazaria Lake.
3.2. Spatial and Seasonal Variation of Some Parameters Indicators of Pollution
It consisted in following the variation of a several parameters from one season to another
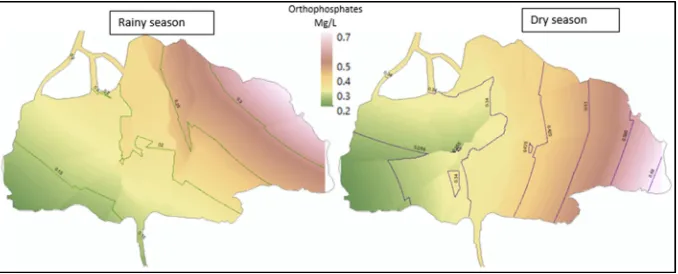
3.2.1. Orthophosphates
Analysis of the figure 5 reveals a seasonal average of 0.21 mg / L in rainy season and 0.41 mg / L in dry season. The highest values are observed in the Northwest, while the lowest values are in the South East. This indicates a probable source of pollution at the north of the lake.
According to [30], it comes from the runoff of rainwater on the continent, which drains the nutrient salts resulting from the remineralization of terrestrial plants, by an atmosphere rich in dust [31], but also by anthropogenic inputs (wastewater discharges, etc.), an internal origin could result from the mineralization of organic matter from dead algae and aquatic macrophytes [32].
The enrichment of surface waters of phosphorus may also be a consequence of the resuspension of bottom sediments by wind, by the fungus behavior of certain species of fish or by human activity [33]. The low concentration observed in dry
season would probably be due to high consumption by phytoplankton biomass [34].
3.2.2. Dissolved Oxygen (DO)
Its value tells us the degree of pollution and its presence in surface waters plays a preponderant role in the self-purification and maintenance of aquatic life. The concentration of dissolved oxygen evolves essentially under the influence of the biological activity of the microorganisms present along the water column.
Figure 6. Spatial and seasonal variation of dissolved oxygen.
The spatial and seasonal variation of dissolved oxygen (figure 6) shows higher concentrations in the rainy season with a spatial mean of 4.5 mg / L compared to 3.4 mg / L in the dry period. The highest values are observed in the central part of the lake during the dry period, unlike the rainy period during which these values are observed at zogbo, Afotonou, Dékanmè and ouedogbaji.
The low values observed are certainly due to the high activity of microorganisms. This situation leads the aquatic environment to be reducing. This has very serious consequences on aquatic species and is in concordance with the results of [35] [36] in Benin, as well as the disadvantages of acadjas practices.
The low oxygenation recorded in the dry period would also be linked not only to the high temperature rise and the salinity which limits the solubility of oxygen but also to the
respiration of living aquatic organisms (fauna, submerged flora) and hydrodynamic calm, illustrated by the decline in trade flows, which prevent the mixing of water [37].
These low concentrations of dissolved oxygen would indicate the presence of a significant organic matter load in the waters [38] and show an increased pollution of the waters of Lake Nokoué and the existence of ideal conditions for the proliferation of macrophytes [39].
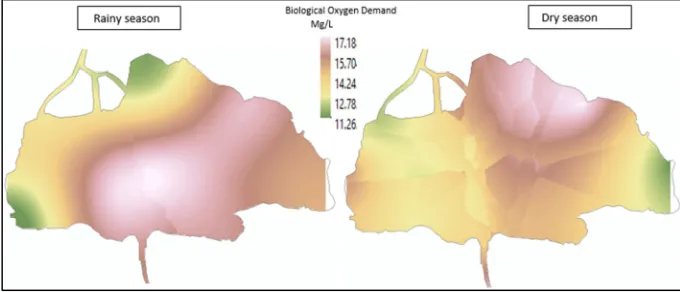
3.2.3. Biological Oxygen Demand (BOD)
The figure 7 indicates that BOD values range from 21 to 2.5 mg / L in the rainy season and between 21.33 and 11 mg / L in the dry season. The highest values are observed in S4, S5, S14, S16 and S15 during the rainy season, followed by S15, S16, S17 and S18 in dry periods.
High concentrations are therefore observed over a large part of the lake during wet periods (almost ¾). The mean concentration over the lake during the rainy season (14.07 mg / L) is lower than in the dry season (15.3 mg / L). This is in line with which observed by [21] on the same lake and [35] on Ahémé Lake.
According to [40] Beaux (1998), water bodies with BOD concentrations above 10 mg / L are considered mediocre.
The high levels of BOD obtained are certainly due to the high discharge of waste water directly into the water bodies. This important contribution of organic matter could lead to the asphysis of fish species.
3.3. Multivariate Analysis
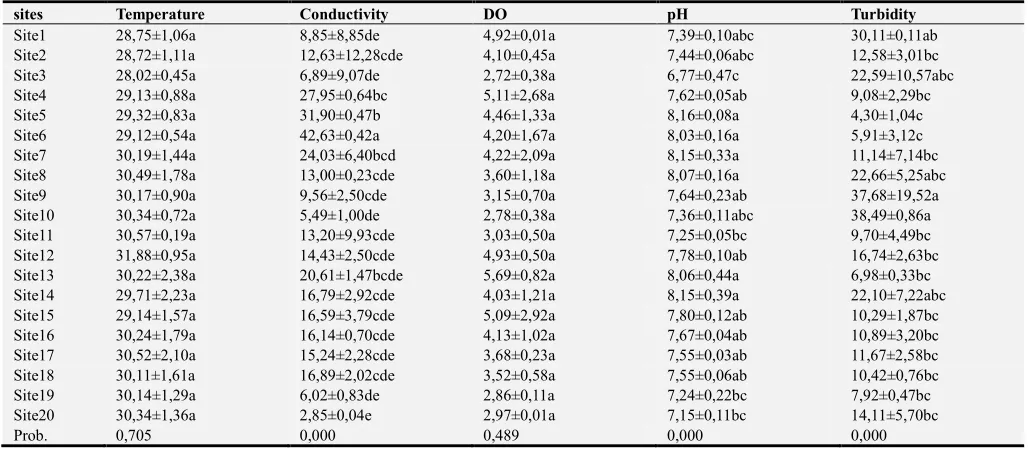
3.3.1. Effect of Sites on Physico-Chemical Parameters Table 4 presents the mean values of the physicochemical parameters measured at the various sites. The analysis of this
table shows that there is a highly significant difference (Prob ≤ 0.001) between sites when considering 4 physicochemical parameters ie conductivity, pH, turbidity and salinity.
The cotonou channel is the site with the highest average conductivity and the highest average salinity. As regards pH, it should be noted that all the sites have an average pH value greater than 7 except the Djonou channel whose mean pH is 6.77. The Totche and Ouémé entries are remarkable for the high value of turbidity. Apart from the 4 physico-chemical parameters above, no significant difference (Prob> 0.05) was observed between the sites with respect to the other physicochemical parameters.
Moreover, the SNK test allowed to classify the sites according to each parameter, thus, in the same column of table 4, the values of the same letter are for stations of the same group (that is to say that their values are not statistically different).
Table 4. Results of analysis of variance showing the effect of sites on physico-chemical parameters.
sites Temperature Conductivity DO pH Turbidity
Site1 28,75±1,06a 8,85±8,85de 4,92±0,01a 7,39±0,10abc 30,11±0,11ab
Site2 28,72±1,11a 12,63±12,28cde 4,10±0,45a 7,44±0,06abc 12,58±3,01bc
Site3 28,02±0,45a 6,89±9,07de 2,72±0,38a 6,77±0,47c 22,59±10,57abc
Site4 29,13±0,88a 27,95±0,64bc 5,11±2,68a 7,62±0,05ab 9,08±2,29bc
Site5 29,32±0,83a 31,90±0,47b 4,46±1,33a 8,16±0,08a 4,30±1,04c
Site6 29,12±0,54a 42,63±0,42a 4,20±1,67a 8,03±0,16a 5,91±3,12c
Site7 30,19±1,44a 24,03±6,40bcd 4,22±2,09a 8,15±0,33a 11,14±7,14bc
Site8 30,49±1,78a 13,00±0,23cde 3,60±1,18a 8,07±0,16a 22,66±5,25abc
Site9 30,17±0,90a 9,56±2,50cde 3,15±0,70a 7,64±0,23ab 37,68±19,52a
Site10 30,34±0,72a 5,49±1,00de 2,78±0,38a 7,36±0,11abc 38,49±0,86a
Site11 30,57±0,19a 13,20±9,93cde 3,03±0,50a 7,25±0,05bc 9,70±4,49bc
Site12 31,88±0,95a 14,43±2,50cde 4,93±0,50a 7,78±0,10ab 16,74±2,63bc
Site13 30,22±2,38a 20,61±1,47bcde 5,69±0,82a 8,06±0,44a 6,98±0,33bc
Site14 29,71±2,23a 16,79±2,92cde 4,03±1,21a 8,15±0,39a 22,10±7,22abc Site15 29,14±1,57a 16,59±3,79cde 5,09±2,92a 7,80±0,12ab 10,29±1,87bc Site16 30,24±1,79a 16,14±0,70cde 4,13±1,02a 7,67±0,04ab 10,89±3,20bc Site17 30,52±2,10a 15,24±2,28cde 3,68±0,23a 7,55±0,03ab 11,67±2,58bc Site18 30,11±1,61a 16,89±2,02cde 3,52±0,58a 7,55±0,06ab 10,42±0,76bc
Site19 30,14±1,29a 6,02±0,83de 2,86±0,11a 7,24±0,22bc 7,92±0,47bc
Site20 30,34±1,36a 2,85±0,04e 2,97±0,01a 7,15±0,11bc 14,11±5,70bc
Prob. 0,705 0,000 0,489 0,000 0,000
Table 4. Continued.
sites MES BDO Salinity COD Chlorophyll A
sites MES BDO Salinity COD Chlorophyll A Site19 18,50±16,26a 12,75±1,77a 3,15±1,98bc 61,86±35,03a 87,47±61,91a Site20 18,92±13,31a 12,50±0,71a 1,43±1,17c 46,59±19,77a 84,90±39,53a
Prob. 0,965 0,118 0,001 0,674 0,815
3.3.2. Effect of Seasons on Physico-Chemical Parameters Table 5 shows the mean values of physico-chemical parameters measured during the seasons. Analysis of this table shows that most of these parameters have significantly different values (Prob <0.05) from one season to the next
except for conductivity, pH, turbidity and BOD. The combined analysis of both Tables 1 and 2 shows that conductivity, pH and turbidity are parameters whose values are statistically constant during the seasons whereas the sites have statistically different values of these parameters
Table 5. Results of analysis of variance showing the effect of seasons on physico-chemical parameters.
seasons Temperature Conductivity DO pH Turbidity MES BOD Salinity
saison 1 28,99±0,83 15,88±9,70 3,38±0,92 7,64±0,29 16,87±12,12 35,81±9,85 14,77±2,63 10,34±5,04 saison 2 30,71±1,14 16,28±10,94 4,54±1,29 7,64±0,52 14,67±9,55 13,30±9,43 14,08±4,38 6,55±4,44
Prob 0,000 0,903 0,002 0,964 0,526 0,000 0,549 0,016
Table 5. Continued.
seasons COD ChlorophyllA Total Phosphorus Orthophosphate Nitrite Nitrate Ammonium
season1 145,90±70,40 94,30±86,20 2,56±1,07 0,40±0,27 0,02±0,01 1,18±0,61 0,71±0,26 season2 55,77±37,71 626,00±621,00 4,77±2,86 0,21±0,17 0,01±0,01 0,21±0,20 0,38±0,15
Prob 0,000 0,000 0,002 0,012 0,008 0,000 0,000
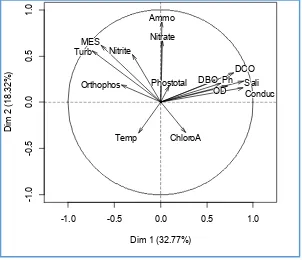
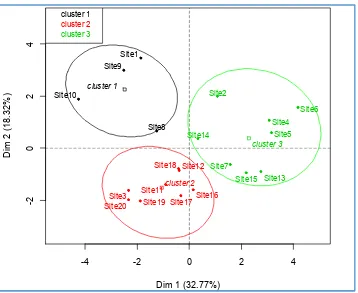
3.3.3. Classification of Sites According to Physico-Chemical Parameters
The results of the Principal Component Analysis reveal that the first two axes account for 51.09% of the variability in the influence of physicochemical parameters on the sites. The analysis of the correlation between physicochemical parameters and their contributions to the axes (Figure 8) shows that nitrite, MES, turbidity and orthophosphate
correlate negatively with axis 1 and positively with axis 2. The projection of the different groups from the ascending hierarchical classification in the plane of the factorial axes shows that group 1 (cluster 1) formed by the landing sites (site1, site8, Site9, Site10) is also negatively correlated with axis 1 and positively with axis 2 (figure 9). Thus, sites 1, 8, 9 and 10 record high MES values, nitrite, turbidity and orthophosphate and low values of other parameters.
Figure 8. Projection of physico-chemical parameters on the factorial planes axes 1 and 2.
As for temperature and chlorophyll a (Figure 8), these parameters are located on the same side as group 2 (cluster2)
formed from the following sites (Figure 9): sites 3, 11, 12, 16, 17, 18, 19 and 20. Therefore, these sites have high values
-1.0 -0.5 0.0 0.5 1.0
-1 .0 -0 .5 0 .0 0 .5 1 .0
Dim 1 (32.77%)
of temperature and chlorophyll a. However, other parameters such as Conductivity, DO, pH, BOD, Salinity, COD and total phosphorus are located on the same side as group 3. Therefore the Calavi sites (Site 2), Zogbo (Site 4), Channel Channel In (site 5), Cotonou Channel (Site 6), Afotonou
podji (Site 7), Lake Center 1 (Site 13) (site 15) have high values for Conductivity, DO, pH, BOD, Salinity, COD and total. On the other hand, groups 1 and 3 have high nitrate and ammonium values, whereas the opposite group 2 is low in these parameters.
Figure 9. Projection of stations and groups on factorial axes 1 and 2.
4. Conclusion
In this paper, a seasonal variation of water pollutants in terms of WQI at Nokoué Lake was study in 2016. The relation between spatio-temporal variability and water quality using multivariate statistics was also assessed
The application of WQI to assess temporal variations in surface water quality was therefore found satisfactory. WQI values revealed that the present status of water quality is not suitable for drinking purposes, and therefore water should be treated properly before use.
Most of the surface water sampling locations were found to have satisfactory water quality with a several exceptions and water quality of Nokoué Lake can be categorized into "Good water" during the rainy season to "Poor water" during the dry season. It has also been observed that both the seasons and the spatial distribution of sites have an influence on the physicochemical parameters of the lake.
It is recommended that more surveys be conducted covering more areas, to develop water treatment and purification plants in specific locations, and to propagate public health education. The results of this study are expected to be a helpful tool for the public and for water quality management.
Acknowledgements
This study was funded by International Foundation for Science (IFS) (Karlavägen 108, 5th floor, SE-115 26 Stockholm, Sweden), by the scholarship agreement N°W/5706-1.
References
[1] Manjare SA, Vhanalakar SA, Muley DV. Analysis of water quality using physico-chemical parameters, Tamdalge tank in Kohlapur District, Maharashtra. Int J Adv Biotechnol Res 2010; 1:115-9.
[2] Poonia S, Singh TS, Tsering DC. Application of water quality index for the assessment of suitability of natural sources of water for drinking in rural areas of east Sikkim, India. Indian J Public Health 2015;59:153-5.
[3] Ongley, E. Modernization of water quality programs in developing countries: issues of relevancy and cost efficiency. Water Qual. Int., 1998, 37–42.
[4] T. Banerjee and R. K. Srivastava. Water quality index for surface water quality assessment. Water Science & Technology, WST 60.8. 2009.
-4 -2 0 2 4
-2
0
2
4
Dim 1 (32.77%)
D
im
2
(
1
8
.3
2
%
) Site10
Site9
Site3
Site20 Site19
Site1
Site8
Site11
Site18 Site12
Site17 Site16 Site14
Site2
Site7
Site15 Site13 Site4
Site5 Site6 cluster 1
cluster 2
cluster 3
[5] Sargaonkar and V. Deshpande, “Development of an Overall Index of Pollution for Surface Water Based on a General Classification Scheme in Indian Context,” Environmental Monitoring and Assessment, Vol. 89, No. 1, 2003, pp. 43-67. [6] H. Boyacioglu, “Surface Water Quality Assessment Using
Factor Analysis,” Water SA, Vol. 32, No. 3, 2006, pp.389-394. [7] V. Simeonov, J. W. Einax, I. Stanimirova and J. Kraft, “Environmetric Modeling and Interpretation of River Water Monitoring Data,” Analytical and Bioanalytical Chemistry, Vol. 374, No. 5, 2002, pp. 898-905.
[8] M. Nasirian, “A New Water Quality Index for Environmental Contamination Contributed by Mineral Processing: A Case Study of Amang (Tin Tailing) Processing Activity,”Journal of applied sciences, Vol. 7, No. 20, 2007, pp.2977-2987. [9] H. Boyacioglu and H. Boyacioglu, “Surface Water Quality
Assessment by Environmetric Methods,” Environmental Monitoring and Assessment, Vol. 131, No. 1-3, 2007, pp. 371-376.
[10] Parparov, A., Hambright, K. D., Hakanson, L. & Ostapenia, A. 2006 Water quality quantification: basics and implementation. Hydrobiologia 560, 227–237.
[11] A. Sargaonkar and V. Deshpande, “Development of an Overall Index of Pollution for Surface Water Based on a General Classification Scheme in Indian Context,” Environmental Monitoring and Assessment, Vol. 89, No. 1,2003, pp. 43-67. [12] Babaei Semiromi, F., Hassani, A. H., Torabian, A., Karbassi, A. R.
and Hosseinzadeh Lotfi, F., “Water quality index development using fuzzy logic: A case study of the Karoon river of Iran”, African J. Biotech.., 10(50). 10125-10133. 2011.
[13] Karbassi, A. R., Mir Mohammad Hosseini, F., Baghvand, A. and Nazariha, M., “Development of water quality index (WQI) for Gorganrood River”, Int. J. Environ. Res., 5(4). 1041-1046. Autumn 2011.
[14] Chowdhury R. M., Muntasir S. Y. and Hossain M. M., “Study on ground water quality and its suitability or drinking purpose in Alathur block -Perambalur district”, Archiv. Appl. Sci. Res., 4(3). 1332-1338. 2012.
[15] Nasirian. M., “A new water quality index for environmental contamination contributed by mineral processing: A case study of Amang (tin tailing) processing activity”, J. Appli. Sci., 7(20). 2977-2987. 2007.
[16] W. Dixon and B. Chiswell, “Review of aquatic monitoring program design,” Water Research, vol. 30, no. 9, pp. 1935– 1948, 1996.
[17] V. Simeonov, J. A. Stratis, C. Samara et al., “Assessment of the surface water quality in Northern Greece,” Water Research, vol. 37, no. 17, pp. 4119–4124, 2003.
[18] K. P. Singh, A. Malik, D. Mohan, and S. Sinha, “Multivariate statistical techniques for the evaluation of spatial and temporal variations in water quality of Gomti River (India): a case study,” Water Research, vol. 38, no. 18, pp. 3980–3992, 2004. [19] B. Helena, R. Pardo, M. Vega, E. Barrado, J. M. Fernandez,
and L. Fernandez, “Temporal evolution of groundwater composition in an alluvial aquifer (Pisuerga River, Spain) by principal component analysis,” Water Research, vol. 34, no. 3, pp. 807–816, 2000.
[20] S. A. Bhat, G. Meraj, S. Yaseen, A. R. Bhat, and A. K. Pandit, “Assessing the impact of anthropogenic activities on spatiotemporal variation of water quality in Anchar lake, Kashmir Himalayas,” International Journal of Environmental Sciences, vol. 3, no. 5, pp. 1625–1640, 2013.
[21] Mama, D. Méthodologie et résultats du diagnostic de l’eutrophisation du lac Nokoué (Bénin). Mémoire de Thèse de l’Université de Lausanne, Lausanne, 157 p.2010.
[22] Dehotin, U. A., Laleye, P. A., Dauta, A. and Moreau, J. Facteurs ecologiques et diversité piscicole d’une lagune Ouest Africaine: Le lac Nokoué au Bénin. Journal of Afrotropical Zoology, Special Issue, 49-55. 2007.
[23] Chauhan, A. and Singh, S. “Evaluation of Ganga water for drinking purpose by water quality index at Rishikesh, Uttarakhand, India”, Report Opinion, 2(9). 53-61.2010. [24] Chowdhury, R. M., Muntasir, S. Y. and Hossain, M. M.,
“Water quality index of water bodies along Faridpur-Barisal road in Bangladesh”, Glob. Eng. Tech. Rev., 2(3). 1-8.2012. [25] Rao, C. S., Rao, B. S., Hariharan, A. V. L. N. S. H. and
Bharathi, N. M., “Determination of water quality index of some areas in Guntur district Andhra Pradesh”, Int. J. Appl. Bio. Pharm. Tech., I(1). 79-86.2010.
[26] Balan, I. N., Shivakumar, M. and Kumar, P. D. M. “An assessment of ground water quality using water quality index in Chennai, Tamil Nadu, India”, Chronicles Young Scient., 3(2). 146-150. 2012.
[27] Abdul Hameed M. Jawad Alobaidy, Haider S. Abid, Bahram K. Maulood. Application of Water Quality Index for Assessment of Dokan Lake Ecosystem, Kurdistan Region, Iraq. Journal of Water Resource and Protection, 2010, 2, 792-798.
[28] Liu KH, Kuo YM, Application of factor analysis in the assessment of ground water quality in a blackfoot disease area in Taiwan. Sci Total Environ 313:77–89.2003.
[29] P. J. Puri, M. K. N. Yenkie, D. B. Rana and S. U. Meshram. Application of water quality index (WQI) for the assessment of surface water quality (Ambazari Lake). European Journal of Experimental Biology, 2015, 5(2):37-52.
[30] Thomas S. Les différents producteurs primaires d’un petit barrage tropical africain: dynamiques et interactions (Brobo, Côte d’Ivoire). Thèse de Doctorat d’Etat, Université Paris 6. 246 p.2000.
[31] Lemoalle, J. Azote et phosphore dans les eaux de pluie à Fort Lamy. Cahiers ORSTOM série Hydrobiologie. 7: 95-116.1973.
[32] Gnohossou P. M. La faune benthique d’une lagune Ouest Africaine (le lac Nokoué au Benin), diversité, abondance, variations temporelles et spatiales, place dans la chaine trophique. Thèse de Doctorat, INP de Toulouse, France, 2006, 184p.
[33] Mainstone, G., Glson, J et PRR, W. Phosphate in fresh water, Standards for nature conservation. English Nature Research Reports 73,91p 1993.
[35] Dèdjiho, C. A. Évaluation de la chaine trophique d’une aire marine protégée en relation avec sa physico-chimie: Cas de Gbèzoumè dans la commune de Ouidah. Mémoire de DEA. FAST/UAC, Bénin.2011.
[36] Dovonou, F. La pollution des plans d’eau au Benin. Mémoire de DEA en Environnement, Santé et Développement; Géographie à l’Université d’Abomey-Calavi. 70.2008. [37] Lacaze J. C. « L’eutrophisation des eaux marines et
continentales ». Ed. Ellipses.181 p.1996.
[38] Monjid J., Cohen N, Fadloui: Contribution a l’evaluation de la qualite physicochimique du cours d’eau merzeg (Periurbain de Casablanca, Maroc. 21p.2014.
[39] Adamou R., Alhou B. et Garba Z. Impact de la pollution anthropique du fleuve Niger sur la proliferation de la jacinthe d’eau, article scientifique, 14p. 2015.
![Table 2. References number adopted from literature [26].](https://thumb-us.123doks.com/thumbv2/123dok_us/8483835.1714687/4.595.138.458.499.656/table-references-number-adopted-from-literature.webp)