Food Insecurity, Health, and
Development in Children Under Age
Four Years
Chloe R. Drennen, MD,aSharon M. Coleman, MS, MPH,bStephanie Ettinger de Cuba, MPH,cDeborah A. Frank, MD,c Mariana Chilton, PhD, MPH,dJohn T. Cook, PhD,cDiana B. Cutts, MD,eTimothy Heeren, PhD,cPatrick H. Casey, MD,f Maureen M. Black, PhDg,h
abstract
BACKGROUND AND OBJECTIVES:Food insecurity and pediatric obesity affect young children. Weexamine how food insecurity relates to obesity, underweight, stunting, health, and development among children,4 years of age.
METHODS:Caregivers of young children participated in a cross-sectional survey at medical
centers in 5 US cities. Inclusion criteria were age of,48 months. Exclusion criteria were severely ill or injured and private health insurance. The Household Food Security Survey Module defined 3 exposure groups: food secure, household food insecure and child food secure, and household food insecure and child food insecure. Dependent measures were obesity (weight-age.90th percentile), underweight (weight-age,5th percentile), stunting (height/length-age,5th percentile), and caregiver-reported child health and developmental risk. Multivariable logistic regression analyses, adjusted for demographic confounders, maternal BMI, and food assistance program participation examined relations between exposure groups and dependent variables, with age-stratification: 0 to 12, 13 to 24, 25 to 36, and 37 to 48 months of age.
RESULTS:Within this multiethnic sample (N= 28 184 children, 50% non-Hispanic African
American, 34% Hispanic, 14% non-Hispanic white), 27% were household food insecure. With 1 exception at 25 to 36 months, neither household nor child food insecurity were associated with obesity, underweight, or stunting, but both were associated with increased odds of fair or poor health and developmental risk at multiple ages.
CONCLUSIONS:Among children ,4 years of age, food insecurity is associated with fair or poor
health and developmental risk, not with anthropometry. Findings support American Academy of Pediatrics recommendations for food insecurity screening and referrals to help families cope with economic hardships and associated stressors.
WHAT’S KNOWN ON THIS SUBJECT:Food insecurity and obesity are significant public health problems. Among children,4 years of age, food insecurity is associated with poor health, hospitalizations, developmental risk, and behavioral problems. Associations with obesity are inconsistent.
WHAT THIS STUDY ADDS:In age-stratified analyses among 28 184 multiethnic, young children, food insecurity was associated with fair or poor health and developmental risk, not with obesity. Screening and referrals may help families cope with economic hardships and associated stressors.
To cite:Drennen CR, Coleman SM, Ettinger de Cuba S, et al. Food Insecurity, Health, and Development in Children Under Age Four Years.Pediatrics. 2019;144(4): e20190824
aSchool of Medicine, University of Maryland, Baltimore, Maryland;bBiostatistics and Epidemiology Data Analytics
Center and Department of Biostatistics, School of Public Health andcDepartment of Pediatrics, School of Medicine, Boston University, Boston, Massachusetts;dDepartment of Health Management and Policy, Dornsife
School of Public Health, Drexel University, Philadelphia, Pennsylvania;eHennepin County Medical Center,
Minneapolis, Minnesota;fDepartment of Pediatrics, College of Medicine, University of Arkansas for Medical
Sciences, Little Rock, Arkansas;gDepartment of Pediatrics, School of Medicine, University of Maryland, Baltimore,
Maryland; andhRTI International, Research Triangle Park, North Carolina
Food insecurity, defined as“limited or uncertain availability of nutritionally adequate and safe foods or limited or uncertain ability to acquire
acceptable foods in socially
acceptable ways,”1is a national public health problem. The US Department of Agriculture estimates that 16.4% of households with children,6 years of age experienced food insecurity in 2017, with higher rates among households headed by single, African American, or Hispanic parents.1,2 Food insecurity among young children is associated with poor overall health, hospitalizations, developmental risk, and behavioral problems.2–6Associations between food insecurity and young children’s weight status have been inconsistent, with reports of underweight,
overweight, and no relation with weight.7,8
Infancy, toddlerhood, and early preschool (0–4 years) represent a period of rapid growth and brain development. Variability in children’s early nutritional status can have lifelong consequences extending into the subsequent generation.9Stunting (length/height-for-age.2 SDs below the median) increases the risk for low school achievement, cognitive deficits, and chronic disease in adulthood.10–12Overweight increases the risk for obesity and associated comorbidities throughout childhood and adulthood.13National data reveal a 20% increase in obesity among kindergarteners from 1998 to 2010, with children of low socioeconomic status at highest risk.14
Adequate nutrition, crucial to support healthy growth and development during early childhood, could be threatened by food insecurity.15 Previous researchers suggest
a nonlinear relationship between food insecurity and weight status among adults: moderate food insecurity leads to reductions in food quality that may result in overweight,16 whereas severe food insecurity leads to reductions in food quality and
quantity that could result in
overweight or underweight in varying contexts.17–19
Research addressing food insecurity among children,4 years of age has not been stratified by age, potentially masking important developmental differences in young children’s experience of food insecurity and susceptibility to growth alterations. Young children’s diets, meal patterns, and response to household stress differ significantly by age, suggesting that the experience of food insecurity may vary across developmental stages.20Most research among families of young children has been focused on household food insecurity rather than child food insecurity, which is a more severe form of food insecurity that directly impacts availability of food to children. Efforts aimed at addressing how household and child food insecurity are associated with young children’s growth and development may inform the prevention of food insecurity and both underweight and obesity.21,22
This study uses a large sample of children in low-income families stratified by ages 0 to 12, 13 to 24, 25 to 36, and 37 to 48 months to assess age-specific relations between household and child food insecurity and children’s growth, health, and development. We hypothesize that household and child food insecurity are associated with increased age-specific odds of obesity, underweight, stunting, fair or poor health, and developmental risk.
METHODS
Sample
Cross-sectional data were collected from Children’s HealthWatch, an ongoing 5-city network that monitors how economic hardships, including food insecurity, and participation in public assistance programs relate to the health, growth, and development of young children. Between January 1,
2009, and December 31, 2017, caregivers of children,4 years of age were surveyed in emergency
departments and primary care clinics in Baltimore, Boston, Little Rock, Minneapolis, and Philadelphia. Children were weighed and measured. Inclusion criteria were English, Spanish, or (Minneapolis only) Somali speaking; state resident where the interview was conducted; and knowledge of the child’s health and development. Critically ill or injured children were excluded. This analysis excluded nonbiological mothers and caregivers with private insurance. Institutional review board approval was obtained before data collection and renewed annually at each site. The total number of interviews representing individual children was 34 739; 433 were excluded because of missing data, 2856 caregivers were not the biological mother, and 3266 had private insurance, with afinal sample of 28 184 (Fig 1).
Measures
The following measures were used:
Demographics: Caregivers provided information on their age, self-identified race and/or ethnicity, country of origin, marital and employment status, highest level of education, and number of
household members and children’s age, sex, health insurance, and breastfeeding history.
and no more than 1 child-specific question was endorsed; and household food insecure and child food insecure (HFI/CFI) if
household food insecure criteria were met and$2 of 8 child-specific questions were endorsed.
Growth: Children’s weight and length (height for children.age 2 years) were obtained from medical records. Weight-for-age percentiles and length/height-for-age
percentiles were calculated on the basis of World Health Organization and Centers for Disease Control and Prevention standards.24,25 Because of missing length/height (n= 14 339), obesity was defined as weight-age.90th percentile as recommended when length/height was unavailable.26Underweight
was defined as weight-age less thanfifth percentile and stunting as length/height-age less thanfifth percentile.
Health: Caregiver-reported child health was measured with a question from the 2011–2012 National Survey of Children’s Health for children age 0 to 17 years27:“In general, would you say your child’s physical health is excellent, good, fair, or poor?” Responses were categorized as excellent/good or fair/poor.
Development: Caregivers reported on their child’s development using the Parents’Evaluation of
Developmental Status, a validated 10-item caregiver-reported screening instrument.28Caregivers
reported any concerns (no, yes, or a little) in response to questions about the child’s development in expressive and receptive language,
fine and gross motor skills, behavior, social and emotional, self-help, and preschool performance, and to open-ended questions about concerns in global and cognitive development and“other.”Because the Parents’Evaluation of Developmental Status has been validated with children.3 months of age, caregivers with infants 0 to 3 months of age were not surveyed with this measure. Children with
$2 concerns were classified as at developmental risk.29
Food assistance: Caregivers
responded to questions about their participation in food assistance programs, including the Special Supplemental Nutrition Program for Women, Infants, and Children (WIC) and the Supplemental Nutrition Assistance Program (SNAP). Because both programs can reduce food insecurity among families with young children and improve aspects of diet quality,30,31 we adjusted for WIC and SNAP participation. We also asked about participation in other programs (Low Income Housing and Energy Assistance Program and
Temporary Assistance for Needy Families).
Statistical Analysis
x2tests and analysis of variance were used to characterize the sample. We stratified age into 4 categories: 0 to 12, 13 to 24, 25 to 36, and 37 to 48 months. To examine age-related patterns without considering food security status, we used multivariable logistic regression models to
determine if obesity, underweight, stunting, health status, and
developmental risk varied by age. The models were run initially without covariates and were then run controlling for covariates previously associated with the dependent FIGURE 1
measures in our published research, including site; maternal age, education, race and/or ethnicity, marital status, and employment; and child age, birth weight, and food assistance participation.32Obesity and underweight models also included maternal BMI.
Multivariable logistic regressions models were used to determine associations between food security group and obesity, underweight, stunting, fair or poor health, and developmental risk. Analyses were stratified by age category. As the reference, the food-secure group was compared with the HFI/child secure and the HFI/CFI groups. We did not adjust for multiple
comparisons because our dependent variables were unique,
hypothesized, and measured by multiple methods.33Analyses were performed by using 2-sided tests and a significance level ofP,.05, with SAS software (version 9.3; SAS Institute, Inc, Cary, NC).
RESULTS
Sample Characteristics
Characteristics of study participants were stratified by food security status (Table 1). Of the 28 184 caregiver-child dyads, 72.7% were classified as FS, 14% as HFI/child secure, and 13.3% as HFI/CFI. In this ethnically diverse sample (50% non-Hispanic African American, 34% Hispanic, and 14% non-Hispanic white), 25% of mothers were non-US born, 74% completed high school, 27% met criteria for obesity, 41% were employed, 23% reported depressive symptoms, 65% reported SNAP participation, and 76% reported WIC participation. Children’s mean age was 18.5 months (SD 13.3 months), 46% were female, 14% weighed ,2500 g at birth, 64% had been breastfed, 16% were obese, 8% were underweight, and 12% were stunted. Mothers reported that 11% were in fair or poor health and 12% at
developmental risk. Food security groups differed on rates of fair or poor health and developmental risk but not on rates of obesity,
underweight, or stunting.
Age-Specific Patterns of Obesity, Stunting, Underweight, Health, and Development
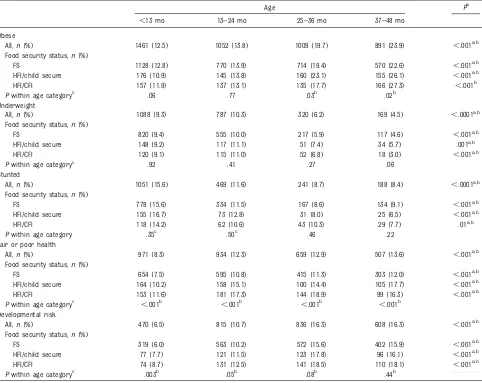
In unadjusted analyses (Table 2), rates of all dependent measures (obesity, underweight, stunting, fair or poor health, and developmental risk) differed by age category (P, .001), generally increasing for obesity, fair or poor health, and
developmental risk and decreasing for underweight and stunting. In multivariable analyses, 0 to 12 months was the reference. The adjusted odds of obesity were higher among older children, with significant results among the 3 oldest age categories (13 to 24 months: adjusted odds ratio [aOR], 1.1; 95% confidence interval [CI]: 1.01–1.21; 25 to 36 months: aOR, 1.71; 95% CI:
1.55–1.88; and 37 to 48 months: aOR, 2.17; 95% CI: 1.97–2.40) (Table 3). The odds of underweight were higher in the 13 to 24 months category (aOR, 1.19; 95% CI: 1.07–1.3) and
significantly lower in the 2 oldest categories, 25 to 36 months (aOR, 0.68; 95% CI: 0.59–0.78) and 37 to 48 months (aOR, 0.49; 95% CI: 0.41–0.78). The odds of stunting were significantly lower across the 3 oldest age categories. The odds of fair or poor health and developmental risk were significantly higher for the 3 older age categories, reaching the greatest odds at 37 to 48 months, fair or poor health (aOR, 1.93; 95% CI: 1.34–2.01), and developmental risk (aOR, 3.44; 95% CI: 3.00–3.95).
Age-Specific Odds of Obesity, Underweight, Stunting, Health, and Development by Food Security Status
In unadjusted analyses (Table 2), rates of obesity did not differ by food security status at 0 to 12 or 13 to 24 months but rates did differ among the 2 older categories at 25 to 36 and
37 to 48 months. Rates of underweight and stunting did not differ by food security status for any age categories. Rates of fair or poor health differed significantly by food security status among all age categories, with the FS group reporting the lowest rate. Rates of developmental risk differed among the 2 youngest categories, with the lowest rate in the FS group.
In adjusted analyses (Table 3), the FS group was the reference for each age category. There was 1 significant
finding related to obesity and none related to underweight or stunting. The adjusted odds of obesity were significantly elevated in the 25 to 36 month category among the HFI/ child secure group (aOR, 1.24; 95% CI: 1.01–1.52) but not in the HFI/CFI group. The adjusted odds of fair or poor health were elevated in each of the age categories and across both the HFI/child secure group and the HFI/ CFI group. The adjusted odds of developmental risk were elevated in the 0 to 12 month category for the HFI/CFI group (aOR, 1.49; 95% CI: 1.11–1.98) and in the 37 to 48 month category for both the HFI/child secure group (aOR, 1.32; 95% CI: 1.02–1.72) and the HFI/CFI group (aOR, 1.44; 95% CI: 1.12–1.85).
DISCUSSION
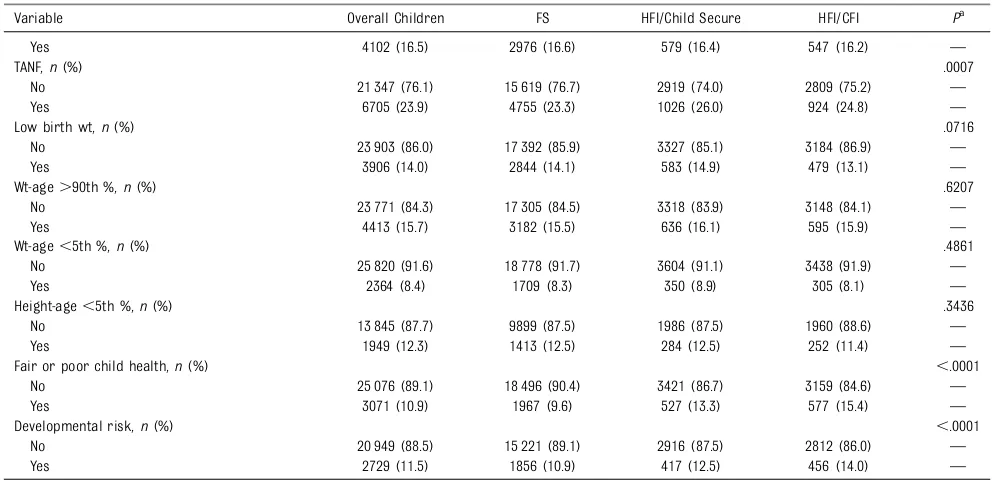
TABLE 1Characteristics of Sample by Food Security Status (January 1, 2009, to December 31, 2017)
Variable Overall Children FS HFI/Child Secure HFI/CFI Pa
Total,N(%) 28 184 (100) 20 487 (72.7) 3954 (14.0) 3743 (13.3) —
Site,n(%) ,.0001
Baltimore 5073 (18.0) 3965 (19.4) 642 (16.2) 466 (12.4) —
Boston 5648 (20.0) 3682 (18.0) 948 (24.0) 1018 (27.2) —
Little Rock 6114 (21.7) 4629 (22.6) 774 (19.6) 711 (19.0) — Minneapolis 4814 (17.1) 2983 (14.6) 838 (21.2) 993 (26.5) — Philadelphia 6535 (23.2) 5228 (25.5) 752 (19.0) 555 (14.8) —
Mothers’place of birth,n(%) ,.0001
US born 21 051 (74.8) 16 067 (78.5) 2766 (70.1) 2218 (59.3) — Immigrant 7099 (25.2) 4395 (21.5) 1181 (29.9) 1523 (40.7) — Child sex,n(%)
Female 13 107 (46.5) 9517 (46.5) 1869 (47.3) 1721 (46.0) .5055 Male 15 077 (53.5) 10 970 (53.5) 2085 (52.7) 2022 (54.0) —
Child age, mo ,.0001
Mean (SD) 18.5 (13.3) 18.1 (13.2) 18.9 (13.6) 20.5 (13.5) — Median (25th, 75th %) 16.4 (7, 28) 15.9 (7, 28) 16.6 (7, 30) 19.2 (9, 31) —
Mother ethnicity,n(%) ,.0001
Hispanic 9345 (33.5) 6204 (30.6) 1511 (38.5) 1630 (44.1) — African American non-Hispanic 13 826 (49.5) 10 582 (52.1) 1744 (44.5) 1500 (40.6) — White non-Hispanic 3799 (13.6) 2842 (14.0) 525 (13.4) 432 (11.7) —
Other 950 (3.4) 673 (3.3) 140 (3.6) 137 (3.7) —
Married or partnered,n(%) ,.0001
No 18 801 (66.8) 13 811 (67.5) 2684 (67.9) 2306 (61.7) —
Yes 9344 (33.2) 6644 (32.5) 1268 (32.1) 1432 (38.3) —
Maternal education,n(%) ,.0001
Never, elementary, or some high school 7420 (26.4) 4978 (24.3) 1206 (30.5) 1236 (33.1) — High school 11 131 (39.6) 8306 (40.6) 1473 (37.3) 1352 (36.3) — Technical school, college, master’s degree 9582 (34.1) 7171 (35.1) 1270 (32.2) 1141 (30.6) —
Mothers ,.0001
N 28 080 20 415 3945 3720 —
Age, mean (SD) 27.0 (5.9) 26.5 (5.8) 27.5 (6.2) 28.8 (6.2) — Age, median (25th, 75th %) 26.0 (22, 31) 25.0 (22, 30) 26.0 (23, 32) 28.0 (24, 33) —
Maternal BMI ,.0001
N 22 351 16 486 3153 2712 —
Mean (SD) 27.5 (5.3) 27.3 (5.3) 27.9 (5.3) 27.9 (5.3) —
Median (25th, 75th %) 27.0 (23, 31) 26.6 (23, 31) 27.5 (24, 32) 27.8 (24, 32) —
Maternal BMI category,n(%) ,.0001
Underweight (,18.5) 514 (2.3) 400 (2.5) 60 (1.9) 54 (2.0) — Healthy wt (18.5–24.9) 7376 (33.4) 5628 (34.5) 942 (30.2) 806 (30.0) — Overweight (25–29.9) 7067 (32.0) 5225 (32.0) 981 (31.5) 861 (32.0) — Obesity ($30) 7157 (32.4) 5059 (31.0) 1132 (36.3) 966 (36.0) —
Mother employed,n(%) ,.0001
No 16 584 (58.9) 11 727 (57.3) 2427 (61.5) 2430 (65.0) —
Yes 11 557 (41.1) 8729 (42.7) 1522 (38.5) 1306 (35.0) —
Child breastfed,n(%) ,.0001
No 10 146 (36.0) 7861 (38.4) 1272 (32.2) 1013 (27.1) —
Yes 18 022 (64.0) 12 615 (61.6) 2682 (67.8) 2725 (72.9) —
Depression,n(%) ,.0001
No 21 653 (76.9) 16 830 (82.3) 2593 (65.6) 2230 (59.6) —
Yes 6494 (23.1) 3622 (17.7) 1360 (34.4) 1512 (40.4) —
SNAP,n(%) .0004
No 9889 (35.3) 7086 (34.9) 1382 (35.2) 1421 (38.2) —
Yes 18 089 (64.7) 13 242 (65.1) 2548 (64.8) 2299 (61.8) —
WIC,n(%) .1689
No 6822 (24.4) 5019 (24.6) 930 (23.7) 873 (23.5) —
Yes 21 194 (75.6) 15 346 (75.4) 3001 (76.3) 2847 (76.5) —
Current subsidized housing,n(%) .2748
No 22 869 (81.1) 16 669 (81.4) 3192 (80.7) 3008 (80.4) —
Yes 5315 (18.9) 3818 (18.6) 762 (19.3) 735 (19.6) —
LIHEAP,n(%) .8363
were higher among older children (age 37 to 48 months), and rates of underweight were lower, adding to the growing body of research revealing that excess weight gain begins early in life.36The increase in excess weight gain among infants and toddlers continues to be a significant concern, especially in low-income households.36
With 1 exception, neither household nor child food insecurity was related to obesity in any age category, consistent with authors of studies that did not examine age
stratification.37The exception occurred in the 25 to 36 month category: children in the household but not child food insecure group experienced a 24% increase in the odds of obesity when compared with the FS group. Although thefinding could have occurred by chance, a possible explanation is that children aged 25 to 36 months are
transitioning from infant-friendly foods to conventional household foods, which, in food-insecure households, may be low-cost, low nutrient-dense food.38In addition,
this age period is characterized by variability in children’s appetite and weight gain.25Pickiness and hesitancy to try new foods are transient behaviors that peak in this age group and may be associated with excess snack foods.39,40The
association with increasing obesity rates among all groups at 37 to 48 months of age is consistent with
findings from a 2015 to 2016 national study that.60% of preschoolers aged 24 to 48 months exceed saturated fat guidelines, increasing their risk of obesity.41
The overall lack of association between food insecurity and obesity may be partially due to the increasing rates of obesity overall, suggesting that growing up in a low-income environment exposes many young children to obesogenic factors such as lack of access to healthy grocery stores, overabundance of fast food outlets, and increased screen time, regardless of food security status.42–44It is also possible that chronic stress that can cause inflammation and cycles of
overconsumption and restriction, due
to the cyclic nature of food insecurity along with the timing of receipt of public nutrition benefits, creates metabolic alterations associated with subsequent weight gain.45
Stunting and underweight were not related to either household or child food insecurity in any age category. Thesefindings are consistent with previous studies46and suggest that food insecurity experienced in the United States generally does not result in caloric deficits chronic enough to cause stunting even among children in households reporting child food insecurity.
The health risks associated with food insecurity were demonstrated by increased odds of fair or poor health at every age and increased
developmental risk at all ages except 25 to 36 months. Possible
explanations are that the poor quality of food in food-insecure households increases the risk for micronutrient deficiencies, which can undermine children’s health and cognitive development47,48; that children are exposed to the stress and anxiety that families experience in not having TABLE 1 Continued
Variable Overall Children FS HFI/Child Secure HFI/CFI Pa
Yes 4102 (16.5) 2976 (16.6) 579 (16.4) 547 (16.2) —
TANF,n(%) .0007
No 21 347 (76.1) 15 619 (76.7) 2919 (74.0) 2809 (75.2) —
Yes 6705 (23.9) 4755 (23.3) 1026 (26.0) 924 (24.8) —
Low birth wt,n(%) .0716
No 23 903 (86.0) 17 392 (85.9) 3327 (85.1) 3184 (86.9) —
Yes 3906 (14.0) 2844 (14.1) 583 (14.9) 479 (13.1) —
Wt-age.90th %,n(%) .6207
No 23 771 (84.3) 17 305 (84.5) 3318 (83.9) 3148 (84.1) —
Yes 4413 (15.7) 3182 (15.5) 636 (16.1) 595 (15.9) —
Wt-age,5th %,n(%) .4861
No 25 820 (91.6) 18 778 (91.7) 3604 (91.1) 3438 (91.9) —
Yes 2364 (8.4) 1709 (8.3) 350 (8.9) 305 (8.1) —
Height-age,5th %,n(%) .3436
No 13 845 (87.7) 9899 (87.5) 1986 (87.5) 1960 (88.6) —
Yes 1949 (12.3) 1413 (12.5) 284 (12.5) 252 (11.4) —
Fair or poor child health,n(%) ,.0001
No 25 076 (89.1) 18 496 (90.4) 3421 (86.7) 3159 (84.6) —
Yes 3071 (10.9) 1967 (9.6) 527 (13.3) 577 (15.4) —
Developmental risk,n(%) ,.0001
No 20 949 (88.5) 15 221 (89.1) 2916 (87.5) 2812 (86.0) —
Yes 2729 (11.5) 1856 (10.9) 417 (12.5) 456 (14.0) —
LIHEAP, Low Income Home Energy Assistance Program; TANF, Temporary Assistance for Needy Families;—, not applicable.
a consistent source of food4; and that mothers recognize developmental problems among their children particularly as they age.28
Although authors of individual studies have found food insecurity to be associated with reduced diet quality and quantity with nutrient deficiencies among young
children,49–51authors of a recent systematic review found inconsistent relations between food insecurity and children’s nutritional status across studies, suggesting the possibility of non-nutritional factors.52Mealtimes
in food-insecure households have been described as having increased risk for disruptions in planning and structure.15Food insecurity has been negatively associated with mealtime behavior, increasing the prevalence of restrictive and pressuring styles that preclude the establishment of healthy eating practices.46,53,54It is also possible that parents’stress and anxiety associated with food insecurity characterize parent-child interactions beyond mealtime because parents who are anxious, depressed, or stressed tend to be less
responsive,55and infants of mothers with depressive symptoms, including mothers with previous experiences of adversity and violence exposure are at increased risk for developmental problems.56,57In a longitudinal investigation among infants and toddlers, food insecurity was associated with an increased risk of maternal depression, which was linked to children’s poor health.46
Several methodologic issues should be considered. The cross-sectional design does not enable causal interpretations, and the urban sample TABLE 2Unadjusted Rates of Obesity (Wt-Age.90th Percentile), Underweight (Wt-Age Less Than Fifth Percentile), Stunted (Height-Age Less Than Fifth
Percentile), Fair or Poor Health, Developmental Risk by Age, and Food Security Status
Age Pa
,13 mo 13–24 mo 25–36 mo 37–48 mo Obese
All,n(%) 1461 (12.5) 1052 (13.8) 1009 (19.7) 891 (23.9) ,.001a,b Food security status,n(%)
FS 1128 (12.8) 770 (13.9) 714 (19.4) 570 (22.6) ,.001a,b HFI/child secure 176 (10.9) 145 (13.8) 160 (23.1) 155 (26.1) ,.001a,b HFI/CFI 157 (11.9) 137 (13.1) 135 (17.7) 166 (27.3) ,.001b
Pwithin age categoryc .06 .77 .03b .02b
Underweight
All,n(%) 1088 (9.3) 787 (10.3) 320 (6.2) 169 (4.5) ,.0001a,b
Food security status,n(%)
FS 820 (9.4) 555 (10.0) 217 (5.9) 117 (4.6) ,.001a,b
HFI/child secure 148 (9.2) 117 (11.1) 51 (7.4) 34 (5.7) .001a,b HFI/CFI 120 (9.1) 115 (11.0) 52 (6.8) 18 (3.0) ,.001a,b
Pwithin age categoryc .92 .41 .27 .06
Stunted
All,n(%) 1051 (15.6) 469 (11.6) 241 (8.7) 188 (8.4) ,.0001a,b Food security status,n(%)
FS 778 (15.6) 334 (11.5) 167 (8.6) 134 (9.1) ,.001a,b
HFI/child secure 155 (16.7) 73 (12.8) 31 (8.0) 25 (6.5) ,.001a,b HFI/CFI 118 (14.2) 62 (10.6) 43 (10.3) 29 (7.7) .01a,b
Pwithin age category .35c .50c .46 .22
Fair or poor health
All,n(%) 971 (8.3) 934 (12.3) 659 (12.9) 507 (13.6) ,.001a,b Food security status,n(%)
FS 654 (7.5) 595 (10.8) 415 (11.3) 303 (12.0) ,.001a,b
HFI/child secure 164 (10.2) 158 (15.1) 100 (14.4) 105 (17.7) ,.001a,b
HFI/CFI 153 (11.6) 181 (17.3) 144 (18.9) 99 (16.3) ,.001a,b Pwithin age categoryc ,.001b ,.001b ,.001b ,.001b
Developmental risk
All,n(%) 470 (6.5) 815 (10.7) 836 (16.3) 608 (16.3) ,.001a,b Food security status,n(%)
FS 319 (6.0) 563 (10.2) 572 (15.6) 402 (15.9) ,.001a,b HFI/child secure 77 (7.7) 121 (11.5) 123 (17.8) 96 (16.1) ,.001a,b HFI/CFI 74 (8.7) 131 (12.5) 141 (18.5) 110 (18.1) ,.001a,b
Pwithin age categoryc .003b .05b .08b .44b
N= 23 678.
aComparisons across age categories. bValue reached significance.
seeking health care for their children is not representative of the national population. In addition, food security, children’s health status, and
children’s developmental risk were reported by mothers, increasing the possibility of shared method variance. However, the use of standardized instruments, systematic data collection, and trained interviewers reduces the possibility of bias. The timing of food insecurity is imprecise because the questions in the HFSSM refer to the previous year, suggesting overlap of timing of food insecurity between categories of age groups. Additional poverty factors related to
weight gain, such as limited
opportunities for safe play, were not fully captured and controlled. Furthermore, the inclusion of households with marginal food insecurity within the FS group (endorsement of 1 or 2 HFSSM items) and the adjustment for participation in food assistance programs may underestimate food insecurity risks.58 We did not adjust for multiple comparisons, increasing the possibility of false-positivefindings (type I errors). However, for our main
finding that obesity in early life is not associated with food insecurity, the concern is with type II errors, and
thus not adjusting for multiple comparisons is conservative. Finally, our focus on obesity, stunting, and underweight reflects the growth parameters associated with
subsequent health and development risks and not with anthropometric changes within the normal range.
CONCLUSIONS
In addition to the urgent need for strategies to eliminate food insecurity, future research should be used to investigate the mechanisms that link food insecurity to adverse health and developmental risk among young TABLE 3aORs and 95% CIs of Obesity (Wt-Age.90th Percentile), Underweight (Wt-Age Less Than Fifth Percentile), Stunted (Height-Age Less Than Fifth
Percentile), Fair or Poor Health, and Developmental Risk by Age and Food Security Status
,13 mo 13–24 mo 25–36 mo 37–48 mo Obese (all)a 1.00 1.11 (1.01–1.21)b 1.71 (1.55–1.88)b 2.17 (1.97–2.40)b
Reference .02 ,.001 ,.001
Food security statusc
FS (reference) 1.00 1.00 1.00 1.00
HFI/child secure 0.85 (0.71–1.01) 0.99 (0.82–1.22) 1.24 (1.01–1.52)b 1.18 (0.95–1.47) HFI/CFI 0.93 (0.77–1.12) 0.94 (0.77–1.16) 0.83 (0.67–1.04) 1.17 (0.94–1.44)
Underweight (all)a 1.00 1.19 (1.07–1.32)b 0.68 (0.59–0.78)b 0.49 (0.41–0.78)b
Reference .001 ,.001 ,.001
Food security statusc
FS (reference) 1.00 1.00 1.00 1.00
HFI/child secure 0.89 (0.73–1.09) 1.03 (0.83–1.29) 1.37 (0.98–1.90) 1.14 (0.74–1.75) HFI/CFI 0.98 (0.78–1.24) 1.08 (0.86–1.36) 1.22 (0.87–1.72) 0.58 (0.34–1.00)
Stunted (all)a 1.00 0.69 (0.61–0.78)b 0.48 (0.41–0.56)b 0.50 (0.42–0.60)
Reference ,.001 ,.001 ,.001
Food security statusc
FS (reference) 1.00 1.00 1.00 1.00
HFI/child secure 0.98 (0.79–1.20) 1.06 (0.79–1.42) 0.92 (0.61–1.41) 0.63 (0.39–1.02) HFI/CFI 0.95 (0.76–1.20) 0.91 (0.67–1.23) 1.18 (0.80–1.74) 0.82 (0.53–1.27)
Fair or poor health (all)a 1.00 1.59 (1.44–1.75)b 1.68 (1.51–1.88)b 1.93 (1.71–2.19)b
Reference ,.001 ,.001 ,.001
Food security statusc
FS (reference) 1.00 1.00 1.00 1.00
HFI/child secure 1.42 (1.18–1.71)b 1.53 (1.25–1.87)b 1.37 (1.07–1.75)b 1.73 (1.34–2.23)b HFI/CFI 1.66 (1.36–2.03)b 1.91 (1.58–2.32)b 1.85 (1.48–2.32)b 1.55 (1.20–2.01)b Developmental risk (all)a 1.00 1.90 (1.68–2.15)b 3.28 (2.88–3.72)b 3.44 (3.00–3.95)b
Reference ,.001 ,.001 ,.001
Food security statusc
FS (reference) 1.00 1.00 1.00 1.00
HFI/child secure 1.12 (0.85–1.47) 1.12 (0.90–1.39) 1.23 (0.98–1.54) 1.32 (1.02–1.72)b
HFI/CFI 1.49 (1.11–1.98)b 1.22 (0.98–1.53) 1.35 (1.08–1.69)b 1.44 (1.12–1.85)b
Analyses controlled for site; maternal age, education, race and/or ethnicity, marital status, and employment; and child age, birth wt, and food assistance participation. Obesity and underweight models also included maternal BMI.N= 23 678.
aComparisons across age categories with 0–12 as the reference. bSignificant associations.
children. It is possible that young children in food-insecure households are experiencing stress reactivity, as in reports from older children and adolescents.59,60Research is also needed on strategies to protect families with young children who are experiencing economic hardships from food insecurity.
With these studyfindings, we illustrate that although children in low-income families and communities continue to experience
disproportionately high rates of obesity early in life, in most cases, this disparity is not directly associated with food insecurity. On the other hand, rates of household and child food insecurity are associated with adverse health and developmental conditions among young children. Although some young children in homes experiencing
household food insecurity may be shielded from the lack of food availability through caregivers’ positive coping strategies and nutrition assistance programs,1,61,62 patterns of detrimental health and development outcomes persist. These
findings reveal the importance of considering nonnutritional factors, including caregiver stress and history of adversity, depression, and anxiety, which often co-occur with food insecurity.4,46,55,63Screening questions (Hunger Vital Sign) rather than anthropometric criteria should be used to identify food insecurity, as recommended by the American Academy of Pediatrics.64 Using such screening questions can help health professionals refer caregivers to nutrition assistance programs and other supports that can help families cope with economic
hardships and their associated stressors.
ABBREVIATIONS
aOR: adjusted odds ratio CI: confidence interval FS: food secure
HFI/CFI: household food insecure and child food insecure HFI/child secure: household food
insecure and child food secure
HFSSM: Household Food Security Survey Module
SNAP: Supplemental Nutrition Assistance Program WIC: Special Supplemental Nutrition Program for Women, Infants, and Children
authors reviewed and revised the manuscript, approved thefinal manuscript, and agree to be accountable for all aspects of the work.
DOI:https://doi.org/10.1542/peds.2019-0824 Accepted for publication Jun 17, 2019
Address correspondence to Maureen M. Black, PhD, Department of Pediatrics, University of Maryland School of Medicine, 737 W Lombard St, Room 161, Baltimore, MD 21201. E-mail: mblack@som.umaryland.edu
PEDIATRICS (ISSN Numbers: Print, 0031-4005; Online, 1098-4275). Copyright © 2019 by the American Academy of Pediatrics
FINANCIAL DISCLOSURE:The authors have indicated they have nofinancial relationships relevant to this article to disclose.
FUNDING:Supported by multiple foundations and donors listed on www.childrenshealthwatch.org. Dr Drennen was partially supported by a training grant from the National Institute of Diabetes, Digestive, and Kidney Diseases (T35 DK095737) and Dr Black was partially supported by a grant from the National Institute of Diabetes, Digestive, and Kidney Diseases (R01 DK106424). Funded by the National Institutes of Health (NIH).
POTENTIAL CONFLICT OF INTEREST:The authors have indicated they have no potential conflicts of interest to disclose.
COMPANION PAPER:A companion to this article can be found online at www.pediatrics.org/cgi/doi/10.1542/2019-2430.
REFERENCES
1. Coleman-Jensen A, Rabbitt MP, Gregory C, Singh A; United States Department of Agriculture. Household food security in the United States in 2017. 2017. Available at: https://www. ers.usda.gov/webdocs/publications/9 0023/err-256.pdf. Accessed January 4, 2019
2. Schmeer KK, Piperata BA. Household food insecurity and child health.
Matern Child Nutr. 2017;13(2):e12301
3. Cook JT, Frank DA, Berkowitz C, et al. Food insecurity is associated with adverse health outcomes among human infants and toddlers.J Nutr. 2004;134(6):1432–1438
4. Gundersen C, Ziliak JP. Food insecurity and health outcomes.Health Aff (Millwood). 2015;34(11):1830–1839
5. Rose-Jacobs R, Black MM, Casey PH, et al. Household food insecurity: associations with at-risk infant and
toddler development.Pediatrics. 2008; 121(1):65–72
6. Shankar P, Chung R, Frank DA. Association of food insecurity with children’s behavioral, emotional, and academic outcomes: a systematic review.J Dev Behav Pediatr. 2017;38(2): 135–150
obesity in children and adolescents? A summary of studies, 1995-2009.Obes Rev. 2011;12(5):e73–e83
8. Morales ME, Berkowitz SA. The relationship between food insecurity, dietary patterns, and obesity.Curr Nutr Rep. 2016;5(1):54–60
9. Kaati G, Bygren LO, Pembrey M, Sjöström M. Transgenerational response to nutrition, early life circumstances and longevity.Eur J Hum Genet. 2007;15(7):784–790
10. De Onis M, Branca F. Childhood stunting: a global perspective.Matern Child Nutr. 2016;12(suppl 1):12–26
11. Dewey KG, Begum K. Long-term consequences of stunting in early life.
Matern Child Nutr. 2011;7(suppl 3):5–18
12. Sudfeld CR, McCoy DC, Danaei G, et al. Linear growth and child development in low- and middle-income countries: a meta-analysis.Pediatrics. 2015;135(5). Available at: www.pediatrics.org/cgi/ content/full/135/5/e1266
13. Cunningham SA, Kramer MR, Narayan KM. Incidence of childhood obesity in the United States.N Engl J Med. 2014; 370(5):403–411
14. Datar A, Chung PJ. Changes in socioeconomic, racial/ethnic, and sex disparities in childhood obesity at school entry in the United States.JAMA Pediatr. 2015;169(7):696–697
15. Fiese BH, Gundersen C, Koester B, Jones B. Family chaos and lack of mealtime planning is associated with food insecurity in low income households.
Econ Hum Biol. 2016;21:147–155
16. Nackers LM, Appelhans BM. Food insecurity is linked to a food environment promoting obesity in households with children.J Nutr Educ Behav. 2013;45(6):780–784
17. Dhurandhar EJ. The food-insecurity obesity paradox: a resource scarcity hypothesis.Physiol Behav. 2016;162: 88–92
18. Dinour LM, Bergen D, Yeh M-C. The food insecurity-obesity paradox: a review of the literature and the role food stamps may play.J Am Diet Assoc. 2007;107(11): 1952–1961
19. Moradi S, Mirzababaei A, Dadfarma A, et al. Food insecurity and adult weight abnormality risk: a systematic review
and meta-analysis.Eur J Nutr. 2019; 58(1):45–61
20. Centers for Disease Control and Prevention. Learn the signs. Act early. 2018. Available at: https://www.cdc.gov/ ncbddd/actearly/milestones/index.html. Accessed July 2, 2018
21. Behrman P, Demirci J, Yanez B, Beharie N, Laroche H. Society of Behavioral Medicine (SBM) position statement: SBM urges Congress to preserve and increase thefinancing of federally funded nutrition assistance programs and services.Transl Behav Med. 2019; 9(1):170–174
22. Holben DH, Marshall MB. Position of the academy of nutrition and dietetics: food insecurity in the United States.J Acad Nutr Diet. 2017;117(12):1991–2002
23. Bickel G, Nord M, Price C, et al Guide to measuring household food security. 2000. Available at: https://fns-prod. azureedge.net/sites/default/files/ FSGuide.pdf. Accessed August 20, 2019
24. Kuczmarski RJ, Ogden CL, Grummer-Strawn LM, et al. CDC growth charts: United States.Adv Data. 2000;(314):1–27
25. World Health Organization Multicentre Growth Reference Study Group. WHO Child Growth Standards: methods and development. 2006. Available at: www. who.int/childgrowth/standards/ technical_report/en/. Accessed July 2, 2018
26. Gamliel A, Ziv-Baran T, Siegel RM, Fogelman Y, Dubnov-Raz G. Using weight-for-age percentiles to screen for overweight and obese children and adolescents.Prev Med. 2015;81:174–179
27. The Child and Asolescent Health Measurement Initiative. 2011–2012 National Survey of Children’s Health child health indicator and subgroups SAS codebook, version 1.0.Data Resource Center for Child and Adolescent Health.2013. Available at: www.childhealthdata.org. Accessed May 1, 2019
28. Glascoe FP. Evidence-based approach to developmental and behavioural surveillance using parents’concerns.
Child Care Health Dev. 2000;26(2): 137–149
29. Glascoe FP.Collaborating With Parents: Using Parents’Evaluation of
Developmental Status to Detect and
Address Developmental and Behavioral Problems. Nashville, TN: Ellsworth & Vandermeer Press; 1998
30. Carlson A, Senauer B. The impact of the special supplemental nutrition program for women, infants, and children on child health.Am J Agric Econ. 2003;85(2):479–491
31. Ratcliffe C, McKernan SM, Zhang S. How much does the supplemental nutrition assistance program reduce food insecurity?Am J Agric Econ. 2011;93(4): 1082–1098
32. Ettinger de Cuba S, Chilton M, Bovell-Ammon A, et al. Loss of SNAP is associated with food insecurity and poor health in working families with young children.Health Aff (Millwood). 2019;38(5):765–773
33. Savitz DA, Olshan AF. Multiple comparisons and related issues in the interpretation of epidemiologic data.
Am J Epidemiol. 1995;142(9):904–908
34. Martin JA, Hamilton BE, Osterman MJK, Driscoll AK, Drake P. Births:final data for 2017.Natl Vital Stat Rep. 2018;67(1): 1–55
35. Chawanpaiboon S, Vogel JP, Moller AB, et al. Global, regional, and national estimates of levels of preterm birth in 2014: a systematic review and modelling analysis.Lancet Glob Health. 2019;7(1):e37–e46
36. Ogden CL, Carroll MD, Kit BK, Flegal KM. Prevalence of childhood and adult obesity in the United States, 2011-2012.
JAMA. 2014;311(8):806–814
37. Metallinos-Katsaras E, Must A, Gorman K. A longitudinal study of food insecurity on obesity in preschool children.J Acad Nutr Diet. 2012;112(12): 1949–1958
38. Jansen EC, Kasper N, Lumeng JC, et al. Changes in household food insecurity are related to changes in BMI and diet quality among Michigan Head Start preschoolers in a sex-specific manner.
Soc Sci Med. 2017;181:168–176
39. Birch LL, Fisher JA. Appetite and eating behavior in children.Pediatr Clin North Am. 1995;42(4):931–953
41. Bailey RL, Catellier DJ, Jun S, et al. Total usual nutrient intakes of US children (under 48 months):findings from the Feeding Infants and Toddlers Study (FITS) 2016.J Nutr. 2018;148(9S): 1557S–1566S
42. Beaulac J, Kristjansson E, Cummins S. A systematic review of food deserts, 1966-2007.Prev Chronic Dis. 2009;6(3):A105
43. Kumanyika S, Grier S. Targeting interventions for ethnic minority and low-income populations.Future Child. 2006;16(1):187–207
44. Cooksey-Stowers K, Schwartz MB, Brownell KD. Food swamps predict obesity rates better than food deserts in the United States.Int J Environ Res Public Health. 2017;14(11):1366
45. Laraia BA. Food insecurity and chronic disease.Adv Nutr. 2013;4(2):203–212
46. Bronte-Tinkew J, Zaslow M, Capps R, Horowitz A, McNamara M. Food insecurity works through depression, parenting, and infant feeding to influence overweight and health in toddlers.J Nutr. 2007;137(9):2160–2165
47. Park K, Kersey M, Geppert J, et al. Household food insecurity is a risk factor for iron-deficiency anaemia in a multi-ethnic, low-income sample of infants and toddlers.Public Health Nutr. 2009;12(11):2120–2128
48. Black MM. Micronutrient deficiencies and cognitive functioning.J Nutr. 2003; 133(11 suppl 2):3927S–3931S
49. Bernal J, Frongillo EA, Rivera JA. Food insecurity reported by children, but not by mothers, is associated with lower quality of diet and shifts in foods consumed.Matern Child Nutr. 2016; 12(3):546–557
50. Eicher-Miller HA, Mason AC, Weaver CM, McCabe GP, Boushey CJ. Food insecurity is associated with iron deficiency anemia in US adolescents.Am J Clin Nutr. 2009;90(5):1358–1371
51. Maillot M, Darmon N, Darmon M, Lafay L, Drewnowski A. Nutrient-dense food groups have high energy costs: an econometric approach to nutrient profiling.J Nutr. 2007;137(7):1815–1820
52. Hanson KL, Connor LM. Food insecurity and dietary quality in US adults and children: a systematic review.Am J Clin Nutr. 2014;100(2):684–692
53. Bauer KW, MacLehose R, Loth KA, et al. Eating- and weight-related parenting of adolescents in the context of food insecurity.J Acad Nutr Diet. 2015; 115(9):1408–1416
54. Gross RS, Mendelsohn AL, Fierman AH, Racine AD, Messito MJ. Food insecurity and obesogenic maternal infant feeding styles and practices in low-income families.Pediatrics. 2012;130(2): 254–261
55. Hurley KM, Black MM, Papas MA, Caulfield LE. Maternal symptoms of stress, depression, and anxiety are related to nonresponsive feeding styles in a statewide sample of WIC
participants [published correction appears inJ Nutr. 2008;138(10):1982].
J Nutr. 2008;138(4):799–805
56. Liu H, Umberson D. Gender, stress in childhood and adulthood, and trajectories of change in body mass.
Soc Sci Med. 2015;139:61–69
57. Sun J, Patel F, Rose-Jacobs R, et al. Mothers’adverse childhood
experiences and their young children’s
development.Am J Prev Med. 2017; 53(6):882–891
58. Cook JT, Black M, Chilton M, et al. Are food insecurity’s health impacts underestimated in the U.S. population? Marginal food security also predicts adverse health outcomes in young U.S. children and mothers.Adv Nutr. 2013; 4(1):51–61
59. Fram MS, Frongillo EA, Jones SJ, et al. Children are aware of food insecurity and take responsibility for managing food resources.J Nutr. 2011;141(6): 1114–1119
60. Nord M, Hanson K. Adult caregiver reports of adolescents’food security do not agree well with adolescents’own reports.J Hunger Environ Nutr. 2012; 7(4):363–380
61. Black MM, Quigg AM, Cook J, et al. WIC participation and attenuation of stress-related child health risks of household food insecurity and caregiver depressive symptoms.Arch Pediatr Adolesc Med. 2012;166(5):444–451
62. Metallinos-Katsaras E, Gorman KS, Wilde P, Kallio J. A longitudinal study of WIC participation on household food insecurity.Matern Child Health J. 2011; 15(5):627–633
63. Sun J, Knowles M, Patel F, et al. Childhood adversity and adult reports of food insecurity among households with children.Am J Prev Med. 2016; 50(5):561–572
DOI: 10.1542/peds.2019-0824 originally published online September 9, 2019;
2019;144;
Pediatrics
Casey and Maureen M. Black
Frank, Mariana Chilton, John T. Cook, Diana B. Cutts, Timothy Heeren, Patrick H.
Chloe R. Drennen, Sharon M. Coleman, Stephanie Ettinger de Cuba, Deborah A.
Food Insecurity, Health, and Development in Children Under Age Four Years
Services
Updated Information &
http://pediatrics.aappublications.org/content/144/4/e20190824
including high resolution figures, can be found at:
References
http://pediatrics.aappublications.org/content/144/4/e20190824#BIBL
This article cites 55 articles, 13 of which you can access for free at:
Subspecialty Collections
http://www.aappublications.org/cgi/collection/obesity_new_sub Obesity
milestones_sub
http://www.aappublications.org/cgi/collection/growth:development_ Growth/Development Milestones
al_issues_sub
http://www.aappublications.org/cgi/collection/development:behavior Developmental/Behavioral Pediatrics
following collection(s):
This article, along with others on similar topics, appears in the
Permissions & Licensing
http://www.aappublications.org/site/misc/Permissions.xhtml
in its entirety can be found online at:
Information about reproducing this article in parts (figures, tables) or
Reprints
http://www.aappublications.org/site/misc/reprints.xhtml
DOI: 10.1542/peds.2019-0824 originally published online September 9, 2019;
2019;144;
Pediatrics
Casey and Maureen M. Black
Frank, Mariana Chilton, John T. Cook, Diana B. Cutts, Timothy Heeren, Patrick H.
Chloe R. Drennen, Sharon M. Coleman, Stephanie Ettinger de Cuba, Deborah A.
Food Insecurity, Health, and Development in Children Under Age Four Years
http://pediatrics.aappublications.org/content/144/4/e20190824
located on the World Wide Web at:
The online version of this article, along with updated information and services, is
by the American Academy of Pediatrics. All rights reserved. Print ISSN: 1073-0397.