INTERNATIONAL RESEARCH JOURNAL OF PHARMACY
www.irjponline.com
ISSN 2230 – 8407
Research Article
FORMULATION OF UREA MICROCAPSULES BY USING POLYSTYRENE:POLYCAPROLACTONE
MATRIX AND ITS CHARACTERIZATION
Muslim Suardi
1, Elfi Sahlan Ben
1, Netty Suharti
1, Khairinisa Septiana
2, Dira Pratiwi Kastianingsih
2,
Rika Sari Lalfari
3, Idris Sutan Sati
4, Akmal Djamaan
1*
1Faculty of Pharmacy, University of Andalas, Padang, Indonesia
2
School of Pharmacy, STIFARM, Padang, Indonesia
3
Department of Chemistry, Faculty of Sciences, University of Andalas, Padang, Indonesia
4
Buluah Sarumpun Farmer Group, Jorong Sungai Buluah, NagariBatagak, Agam, Indonesia
*Corresponding Author Email: [email protected]
Article Received on: 05/08/18 Approved for publication: 22/10/18
DOI: 10.7897/2230-8407.0911255
ABSTRACT
Microencapsulation is one of the pharmaceutical technologies that could be implemented in other fields of study. Previous researchers haveformulated fertilizer microcapsules using polystyrene (PS):polycaprolactone (PCL) as matrix. Microcapsules were prepared by a solvent evaporation method using PS:PCL(2:1). Characterization of microcapsules produced including spectroscopicanalysis by Fourier Transform Infra Red (FTIR) analysis, Scanning Electron Microscope (SEM), particle size distribution, determination of urea content in microcapsules, release test, and kinetics model of active substance release. Results showed that the FT IR analysis confirmed no chemical interaction between urea and PCL during the microencapsulation process. SEM results showed the microcapsules obtainedwere spherical in shape. The particle size distribution of urea microcapsules was in the range of 50-400 μm. The microencapsulation efficiency and release efficiencywere 86.75 ± 1.56%, and 46.54%, respectively. The urea release kinetics from the microcapsules following the Langenbucher equation. It means the release mechanism was based on diffusion and erosion.
Keywords: microencapsulation, urea, polystyrene, polycaprolactone, slow release.
INTRODUCTION
Consideration of the development of pharmaceutical technology depends on several factors. These factors are including effectiveness, safety, and acceptability. Its have a major influence on the development of drug delivery technology so that many new drug formulations were found and examined which have the properties and ideal delivery systems1.2.
Microencapsulation technology as one of developed pharmaceutical technology related to the delayed release of active substances is an attract great attention in various fields of studies. Not only in the pharmaceutical, but also in other fields such as agriculture, cosmetics, veterinary, and even textiles. Several reasons in application of microencapsulation is to reduce the reactivity of the active substances with external environment (e.g light, oxygen, and water), reduce the rate of evaporation of the substances, facilitate handling of core materials, inhibit the release of the substancesuntil used, mask the taste of the substances, and dissolve the substances slowly when used to achieve equitable distribution3,4,5.
Urea fertilizers commonly used in agriculture have ineffective in their application to plants. 20-70% of conventional urea fertilizer used pollutes the environment because of the leaching by water and the evaporation process. It can cause a greenhouse effect. While only 30-50% of urea absorbed by plants. It will increase production costs due to repeated using of fertilizer6,7,8. Excessive fertilization will alsoincrease the cost, susceptible to diseases, delayed flower formation and damage to the environment9. The application of microencapsulation method is very useful in
release fertilizer (SRF) or controlled release fertilizer (CRF)10,11,12. SRF/CRF fertilizers were designed to control the release of active substances in fertilizers, a delayed in providing nutrients that are synchronized with sequential plant nutrient requirements. These fertilizers improve the efficiency of the use of nutrients and increasethe production of crops14,15.
The potential benefits of this fertilizer including the efficient use of nitrogen by plants, reducing evaporation and washing of nitrogenous substances, minimizing fertilizer costs, avoiding the possibility of "root-burning" due to excessive fertilizer application and easierin the application of fertilizer. Previous researchers have formulated a slow release of fertilizer preparations using the microencapsulation method. Microencapsulation is a coating technology or coating of a core substance with a polymer layer in small micro-sized particles. Another goal of this microencapsulation, mainly in agriculture, is to slow the release of fertilizer by reducing the ability to dissolve into groundwater16.
In this research, the single biopolymer was replaced with bioblend materials, a mixture of PCL and PS. PS is one of polymer that widely used in rigid, hard, and difficult to be decomposed by microorganisms. PS is usually known as styrofoam. PS type plastic packaging often causes environmental problems due to difficult to be biotransformed and as well as recycled19,20. PSwas chosen because of very economical in terms of price and easy to obtain. The presence of the bioblend mixture is expected to reduce production costsand has an important role in reprocessing PS waste.
Slow-release fertilizer is often used in woody plants due to reduced application frequency and leaching problem compared with conventional fertilizers. New formulas and types of slow-release fertilizer preparations have developed in recent years so special attention needs to be paid to evaluation at several levels, methods, circumstances and different application environments21. Based on the above consideration, formulation of urea microcapsule was prepared using PS/PCL bioblend matrix followed by characterization and the evaluation of urea release.
MATERIALS AND METHODS
Apparatus and Materials
Apparatus used were Fourier Transform Infrared (Perkin Elmer FT-IR Spectrophotometer Frontier), UV-Vis Spectrophotometer (Shimadzu UV-1700), Scanning Electron Microscopes (JEOL, Japan), analytical scales (Shimadzu AUX 220, Japan), Magnetic heating stirrer (IKA, Germany), microscopes and Optic Viewers, fume hoods, glassware usual used in the laboratory. While, materials used were urea (PT Fertilizer Sriwijaya, Indonesia), urea (Merck, Germany), biopolymer polycaprolactone (Aldrich Chemical), styrofoam (waste), Span 80, liquid paraffin, chloroform and n-hexane (PT. Brataco, Indonesia), para-dimethyl-aminobenzaldehyde, concentrated HCl, ethanol pa, media, spring onion, and distilled water.
Evaluation of Raw Materials
Examination of urea, PS, PCL, and other excipients and additives wasperformed according to the requirements stated in the United States Pharmacopeia, Handbook of Pharmaceutical Excipient and Martindale 36thEdition2,3.
Preparation of Microcapsules
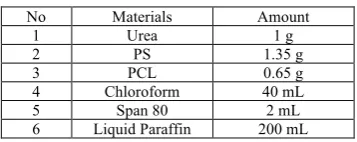
Preparation of microcapsules was adopted from the method used by Benet al (2016)3. The formula chosen was PCL:PS at a ratio of 1:2, as shown in Table 1.
Table 1: Formulation of microcapsules produced3
No Materials Amount
1 Urea 1 g
2 PS 1.35 g
3 PCL 0.65 g
4 Chloroform 40 mL
5 Span 80 2 mL
6 Liquid Paraffin 200 mL
PCL and PS were dissolved in chloroform and added with crushed urea. The mixture was added slowly into the solution of Span 80 in liquid paraffinand stirred at rate of 700 RPM until all chloroform evaporates. The microcapsules formed were collected, washed with n-hexane until free from liquid paraffin and Span 80, filtered, and dried at room temperature3.
Characterization of Microcapsules Produced
IR Spectroscopy Analysis
The infrared spectra of dried microcapsules form were observed using Fourier Transform Infrared (FT-IR) in the range of wave number of 400 to 4000 cm-¹.
SEM (Scanning Electron Microscope)
The sample was placed in the aluminum holder at a thickness of 10 nm. Samples were observed at various magnification usinganSEM (Phenom pro-X, Netherlands). Voltage and current were set at 5 kV and 12 mA, respectively.
Particle Size Distribution
Particle size distribution was observed using a microscope and an Optilab viewer mounted on the lens of the ocular microscope. The microcapsules were suspended in liquid paraffin and observed under a microscope that connected to a monitor. At least 300 particles were observed and estimated easier from the monitor3,13.
Determination of Urea Content in Microcapsules
Determination of the Maximum Absorption Wavelength of Urea
The urea standard solution was prepared by dissolving 50 mg of urea into 10 mL of distilled water to obtain a concentration of 0.5% w/v. 7.5 mL solution was diluted in a 25 mL volumetric flask, added 1 mL Ehrlich reagent, and added with distilled water to the boundary markers. The maximum wavelength of the solution was measured usinga UV-Vis spectrophotometer.
Preparation of Urea Calibration Curve
A series of standard solutions contains Ehrlich reagent were prepared at a variation concentration of 0.05, 0.075, 0.1, 0.125; 0.150; 0.175% w/v. The absorption of the solution was measured at the maximum wavelength of urea obtained previously. The LOD and LOQ values were estimated. SDR was calculated using formula SDR = √{Σ(Y-yi)²}/(n-2)). Where Σ(Y-yi)² is standard deviation value, and N is the number of samples. Limit of Detection Limit (LOD) and Limit of Quantification (LOQ)was calculated using the following equation: LOD = (3 x SDR)/b, and LOQ = (10 x SDR)/b, respectively.
Determination of Urea Content
50 mg of microcapsules was weighed exactly, crushed and placed into a 25 mL volumetric flask and dissolved with distilled water, added with 1 mL of Ehrlich reagent, added with distilled water until 25 mL, and mixed. Absorbance of solutions were measured at wavelengths of maximum absorption using a UV-Vis spectrophotometer (n=3)3,9,17.
Determination of the Percentage of Fertilizer Loading, Yield, and Microencapsulation Efficiency
The Release of Urea from Microcapsules in water
3 g of urea microcapsules was added a glass bottle volume 100mL. Sample solutions were withdrawn every day until day 5. The absorbance of the sample solution was measured using a spectrophotometer.
Data Analysis
The data obtained was the result of microcapsule evaluation. The release kinetic model was estimated from the release of active ingredients from microcapsules. The data were analyzed statistically by the F test and continued with the Duncan test.
RESULTS AND DISCUSSION
This study was conducted to determine the effectiveness of urea microcapsules using formula obtained by researchers’ groups previously. The evaluation of the active ingredients and excipient usedwas performed to ensure the materials used meet the requirements. In the organoleptic examination, urea was crystalline in shape, white and odorless that fulfilled the requirements. The solubility of PS and PCL raw materials met the requirements.The additive materials such as chloroform, liquid paraffin, Span 80, and n-hexane also met the requirements.
The solvent evaporation emulsification method used for the manufacture of urea microcapsules was chosen because of the polymer dissolved in volatile solvents such as chloroform. In addition, the advantages of the method areeasy and efficient in the process, requiring a short time and low costs22. Microcapsules are prepared using oil in oil (O/O) system because the active substance, urea, is very soluble in water, so the carrier phase is replaced with mineral oil such as liquid paraffin23.
PS and PCL were dissolved in chloroform then added with crushed urea. Scouring is done to reduce the size of urea. Span 80 as an emulgator that helps stabilize the emulsion formed that useful to assist the microencapsulation process and liquid paraffin as a carrier medium mixed in another container, then rotated with Magnetic Stirrer Heating as a homogenizer with a rate of 700 rpm for 6 hours. According to Djamaan et al. (2015)9 at a rate of 700 rpm for 6 hours, the spherical particle size was obtained. The particle size of microcapsules that fulfill the requirements and dissolution rate was the slowest compared to the speed of 400 rpm and 900 rpm. In addition, in a previous studyusing solvent evaporation emulsification method at a rate of mixing of 700 rpm, microcapsulesformed were almost spherical inshape, and particle size range between 0-1000 μm. During this stirring, a mixture of urea and bioblend in chloroform is dripped which will form urea and bioblend emulsions, while chloroform will evaporate so that the emulsion begins to break and microcapsules form in the carrier phase24. The process was performed in the fume hood due to toxicity characteristic of solvent used23.
The spectra of urea raw material showed the presence of N-H bonds at wave numbers of 3430, 3330, and 1598 cm-1 (Figure 1). At wave number of 2830, 1679, and 1043 cm-1 indicated the presence of C-H bond, C = O, and C-N group, respectively. Based on the literature, the NH, C = O, and CN group appears in the region of the wave number of 3000-3700, 1640-1820, and 900-1300 cm-125. It can be assumed that urea used as a raw material fulfilled the requirements.
Figure 1: IR spectra of urea raw material (Functional groups of urea: 3430 N-H, 3330 N-H, 2830 C-H, 1679 C = O, 1598 N-H, 1043
C-N).
The spectra of PS showed the presence of C-H group was found at wave numbers of 3028 and 2921 cm-1 (Figure 2). C = C and C-C groups were existed in wave numbers of 2217 and 1179, respectively. Whereas O-H groups of microcapsules existed at wave numbers of 3355, 3219 and 1374 cm-1. The C-H and C-C groups appeared at 2922 and 1179 cm-1.
Figure 2: IR spectra of polystyrene (Wavenumbers and functional groups: 3550 O-H, 2936 C-H, 1721 C = O, 1289 C-O, 1368 O-H,
1045 C-N, 1170 C-C, 1236 C-N).
The spectra of PCL used showed the C-H, C-C, C=O, and CO groups appear at the wave number of 2936, 1170, 1721, 1289 cm-1, respectively (Figure 3). While CN groups appear at wave numbers of 1045 and 1236 cm-1. According to the references, CH groups appear at the wave number in the range of 2800-3000 or 1550-1330 cm-1. The CC, C=O, and CO groups appear at the wave number range of 1450-1600; 1640-1820 or 1700-2000; and 900-1300 cm-1, respectively25. Compared with literature, the spectra PCL used fulfilled the requirements.
Figure 3: IR Spectra of polycaprolactone (Wavenumbers and functional groups: 3550 O-H2936 C-H, 1721 C = O, 1289 C-O, 1368
O-H, 1045 C-N, 1170 C-C, 1236 C-N).
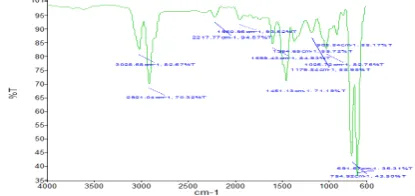
Figure 4: IR spectra of urea microcapsules using PS-PCL as matrix (Wavenumbers and functional groups: 3355 O-H, 3219 O-H, 2922
C-H, 2219 C = C, 1606 N-H, 1163 C-C, 1048 C-O, 1374 O-H).
Scanning Electron Microscopic (SEM) of microcapsules placebo and urea microcapsules with at two different magnifications is shown in Figure 5-7. The SEM of urea microcapsules showed there was a smooth surface of the outer layer of microcapsules and more rounded in shape. The picture showed that microcapsules formed aggregates and there were several microcapsules which are fused to each other due to a less perfect drying process. The rough surface of the microcapsules was caused by the presence of urea attached to the surface of the microcapsules3,14.
Figure 5: Placebo microcapsules surface shape and morphology observed using Scanning Electron Microscopy (SEM) at 30.000x
magnification.
Figure 6: Surface shape and morphology of urea microcapsules observed using Scanning Electron Microscopy (SEM) at 1000x
magnification.
Figure 7: Surface shape and morphology of urea microcapsules observed using a Scanning Electron Microscope (SEM) ata
magnification of 30000x
The distribution of urea microcapsule particle size was analyzed using a microscope and Optilab viewer mounted on a microscope eyepiece with a magnification of 10 times. Particles counted as many as 300 particles. The number of particles that must be calculated is around 300-500 particles to get a good estimate of the distribution2,12. The average size of urea microcapsules was 173.8 μm as seen in Table 2. The size of microcapsule particles increased with the increasing of PCL amount used due to an increase in the viscosity of the solution which will increase the size of the emulsion droplet. Increasing the number of coating materials, the thickness of microcapsule wall will increase and microcapsule size will increase18. All microcapsule size results obtained by solvent evaporation emulsification method meet the requirements in a range of 5 to 5000 μm16.
Table 2: The urea microcapsulesusing PS-PCL matrix particles size distribution
Range of size (μm) Particle Size Distribution Frequency (%)
0-50 8.3
100.1-150 36
150.1-200 28.3
200.1-250 19.8
250.1-300 4
300.1-350 2
350.1-400 1.6
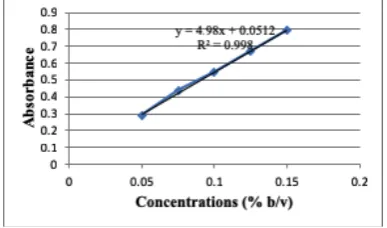
Urea calibration curve was created from the absorbance of a series standard solution of 0.05, 0.075; 0.1; 0.125, and 0.15%. The maximum absorption wavelength in distilled water and soil medium were 418.5, and 416 nm, respectively (Figure 8). The linear regression equation in distilled water and soil media were y=4.98x-0.0512 (R²=0.998) and y=4.66x+0.0612 (R²=0.997), respectively. It showed that there was a linear relationship between the concentration of urea in distilled water and absorbance.
Figure 8: The urea calibration curve in distilled water.
The recovery of urea in microcapsules was 99.58%. The weight of the urea microcapsules obtained was less than the supposed weight. It can be caused by washing and filtering process, and also the attachment of microcapsules to the filter paper. The urea content in microcapsules can be seen in Table 3-5. The level of urea obtained was 14.370 mg.
Table 3: The weight of urea microcapsules obtained
Amount of microcapsules
obtained (g)
Amount of microcapsules theoretically (g)
% Yield
89.63 90 99.58
Table 4: Determination of urea content in microcapsules
Repetition Amount (mg)
Average of Amount ±SD (mg)
1 16.15 14.37 ± 1.75
Table 5: Loading Efficiency and Coating Efficiency of Urea Microcapsules
Repetition Loading
(%) Efficiency Coating (%)
1 33.30 64.61
2 25.30 50.60
3 28.62 57.24
Average ± Standard
Deviation (SD) 28.74 ± 2.38 86.75 ± 1.56
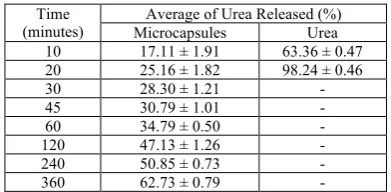
The release of urea from conventional urea in water can be seen in Table 6 and urea microcapsules in Table 7. After 6 hours the active substance released from the microcapsules was 62.73±0.79%. The active substance release from plain urea after 20 minutes was 98.24±0.46%.
Table 6: The release of urea from urea microcapsules in water medium
Time (minutes) Average of Urea Released ± SD (%)
10 17.11 ± 1.91
20 25.16 ± 1.82
30 28.30 ± 1.21
45 30.79 ± 1.01
60 34.79 ± 0.50
120 47.13 ± 1.26
240 50.85 ± 0.73
360 62.73 ± 0.79
The release of urea from uncoated urea and urea microcapsules looks were very different because urea is a very water-soluble substance and the release will be easy. While in urea microcapsules, urea is coated with PCL and coating walls has hydrophobic in nature, as a result of the penetration of water to diffuse is difficult, slower and smaller. Therefore, the time needed to release urea is longer2,28.
Table 7: The release of urea from urea microcapsules and uncoated urea in water
Time
(minutes) Microcapsules Average of Urea Released (%) Urea 10 17.11 ± 1.91 63.36 ± 0.47 20 25.16 ± 1.82 98.24 ± 0.46
30 28.30 ± 1.21 -
45 30.79 ± 1.01 -
60 34.79 ± 0.50 -
120 47.13 ± 1.26 -
240 50.85 ± 0.73 -
360 62.73 ± 0.79 -
The release profile of urea from microcapsules was fixed with the equation of zero-order, first-order, Higuchi, Korsmeyer Peppas, and Langenbucher kinetics to determine the release mechanism of urea. The release profile of urea from microcapsules prepared followed a zero-order indicated a constant release over time. The dosage release profile that follows the first-order kinetics showed the release rate of active substances depends on the concentration of the active substance in microcapsules29. The Higuchi kinetic explains the release of drugs which depend on the roots of time . The Kors Meyer Peppas kinetics depends on the value of n. n value of > 0.45 the drug release occurs based on the Fickian diffusion mechanism, 0.45 <n <0.89 the drug release occurs based on the non-Fickian diffusion mechanism. For n = 0.89 the mechanism of drug release following the zero order also called the case II transport. While n value > 0.89 drug release called super case II transport. Langenbucher release kinetics depend on the b value. The Langenbucher equation shows curve characteristics. Value b = 1, the curve following exponential, b value > 1, in the form of S or sigmoid, while b <1, is in the form
of a parabola, with a high initial slope and then exponentially shaped2,12.
Of the five models, the Langenbucher equation showed the largest and linear correlation coefficient on urea microcapsules with b values smaller than one. It means the dissolution profile tends to form exponentially, indicating no slow initial release or lag time. It can be assumed that the release of urea from microcapsules following the Langenbucher equation . Following Langenbucher release kinetics model diffusion occurred, and erosion of the fertilizer then accumulated in the fraction of the solution. It means that there was no pause before the release process7.
The release efficiency analysis was then processed statistically using the F test. The variance homogenecity test with Levene Statistics was 2.297 (p>0.05). It means the variance of the third release efficiency of the microcapsule formula was not different so that the ANOVA test using the F test can be done. The ANOVA analysis showed that the F value = 41.25 (p<0.05). It means that the four concentrations of fertilizer are different. The effect of fertilizer on the height of the stem analyzed by univariate was highly significant (<0.01). It means the effect of the four treatment of urea was very significant. Univariate analysis of the effect of fertilizer on leaf width showed was highly significant different (<0.01). It means the effect of the four treatment of urea was very significant.
CONCLUSION
FT IR analysis confirmed no chemical interaction between urea and PCL during the micro encapsulation process using PS-PCl as matrix. SEM results showed the microcapsules obtainedwere spherical in shape. The particle size distribution of urea microcapsules was in the range of 50-400 μm. The microencapsulation efficiency and release efficiency were 86.75 ± 1.56%, and 46.54%, respectively. The urea release kinetics from the microcapsules following the Langenbucher equation. It means the release mechanism was based on diffusion and erosion.
AKNOWLEDGMENT
The authors would like to say special thanks to The Rector of Andalas University for his support this research under Professor Research Grant Project, Andalas University, Fiscal Year 2018, with Contract Number: 29/UN.16.17/PP.RGB/LPPM/2018 (ELFI SAHLAN BEN).
REFERENCES
1. Muslim S, Salman, Fitriani, Suharti N, Erizal Z, Febriyenti, Aldi Y,Akmal D. Use of bioblend polystyrene/Starch for coating urea granules as slow release fertilizer. J. Chem. Pharm. Res, 2015; 7(11):478-484.
2. Ben E S, Suardi M, Suharti N, Kastianingsih D P, Lalfari R S, Djamaan A. Application of microcapsule technology on urea coating formulation using polystyrene/ polycaprolactone bioblend polymer matrix and its effectiveness in planta on
Allium porrum L, Int. J. Pharm. Res. Allied Sci, 2018; 7(3): 183-188.
3. Suharti N, Salman, Suardi M, Dwisari D, Febriyenti, Idris,Akmal D. Coating of urea granules for slow release fertilizer using bioblendpolystyrene/polycaprolactone Res. J. Pharm. Biol. Chem. Sci, 2016; 7(1):1691-1699.
4. Suherman, Anggoro D D. Producing slow release urea by coating with starch/acrylic acid in fluid bed spray drying. Int. J. Eng. Technol, 2011; 11(6):62-66.
as matrix of urea slow release fertilizer. J. Chem. Pharm. Res, 2015; 7(7):558-563.
6. Chien S H, Prochnow L I, Cantarella. Recent developments of fertilizer production and use to improve nutrient efficiency and minimize environmental impacts, Adv. in Agr, 2009; 102: 267-322. https://doi.org/10.1016/S0065-2113(09)01008-6
7. Costa M M, Cabral-Albuquerque E C, Alves T L, Pinto J C, Fialho R L. Use of polyhydroxybutyrate and ethyl cellulose for coating of urea granules. J. Agric. Food Chem., 2013; 61(42):9984-9991. https://doi.org/10.1021/jf401185y 8. Xiaoyu N, Yuejin W, Zhengyan W, Lin W, Guannan Q,
Lixiang Y. A novel slow-release urea fertilizer: physical and chemical analysis of its structure and study of its release mechanism. Biosyst. Eng, 2013; 115(3): 274-282. https://doi.org/10.1016/j.biosystemseng.2013.04.001 9. Djamaan A, Afrina D L, Fitriani L, Asiska P D, Netty S,
Muslim S, Ben E S, Erizal Z. Use of biopolymer of polycaprolactone as a matrix of verapamil hydrochloride microcapsule. J. Chem. Pharm. Res. (2015); 7(8), 683-689. 10.Guo M, Liu M, Hu Z, Zhan F, Wu L. Preparation and
properties of a slow release NP compound fertilizer with superabsorbent and moisture preservation. J. App. Polym. Sci,
2005; 96:2132–2138. https://doi.org/10.1002/app.21140 11.Han X, Chen S, Hu X. Controlled-release fertilizer
encapsulated by starch /polyvinyl alcohol coating. Desalination, 2009; 240(1):21-26. https://doi.org/ 10.1016/j.desal.2008.01.047
12.Ben E S, Suardi M, Suharti N, Rahmadani F, Oktavia V S, Dewi A P, Arief S, Lalfari R S, Djamaan A. Slow release fertilizer: production of urea microcapsules using polycaprolactone as a coating material. J. Chem. Pharm. Res. 2017; 9(11):81-86.
13.Costa M M, Cabral-Albuquerque E C, Alves T L, Pinto JC,Fialho R L. Use of polyhydroxy-butyrate and ethyl cellulose for coating of urea granules. J. Agric. Food Chem, 2013; 61(42): 9984-9991. https://doi.org/10.1021/jf401185y 14.Kumar K P S, Tejbe S K, Banu S, Lakshmi P N, Bhowmik D.
Microencapsulation Technology. Indian J. Res.in Pharm. Biotech. 2013; 1(3): 324-328.
15.Azeem B, Kushaari K, Man Z B, Basit A, Thanh T H. Review onmaterials and methods to produce controlled release coated urea fertilizer. J. Contr. Rel, 2014; 181: 11-21. https://doi.org/10.1016/j.jconrel.2014.02.020
16.Sri S J, Seethadevi A, Prabha K S, Muthuprasanna P, Pavitra P. Microencapsulation: A review. Int. J. Pharm. Biosci, 2012; 3(1): 509-531.
17.Woodruff M A, Hutmacher D W. The return of a forgotten polymer polycaprolactone in the 21st century. Progr.
Polymer Sci, 2010; 35(10): 1217-1256. https://doi.org/ 10.1016/j.progpolymsci.2010.04.002
18.Gaur P K, Mishra S, Bajpai M. Formulation and evaluation of controlled release of telmisartan microspheres: In vitro/in vivo study, J. Food Drug An, 2014; 22(4): 542-548. https://doi.org/10.1016/j.jfda.2014.05.001
19.Aarthi N, Ramana K V. Identification and characterization of polyhydroxybutyrate producing Bacillus cereus and Bacillus mycoides strains. Int. J. Environ. Sci, 2011; 1(5): 744-756 20.Suardi M, Wangi Q A, Salman, Zaini E, Akmal D. 2016,
Microencapsulation of verapamil hydrochloride using poly(3-hydroxybutyrate) as Coating Materials by Solvent evaporation method research, J. Pharm. Biol. Chem. Sci, 2016; 7(1): 1725-1732.
21.Panda S. Formulation and evaluation of zidovudine loaded olibanum resin microcapsules: Exploring the use of natural resins as biodegradable polymeric materials for controlled release. Asian J. Pharm. Clin. Res. 2013; 6(3): 23-28. 22.Tiwari S, Verma P. Microencapsulation technique by solvent
evaporation method (study of effect of process variables).
Int.J. Pharm. Life Sci. 2011; 2(8): 998-1005.
23.Li M, Rouaud O, Poncelet D. Microencapsulation by solvent evaporation: State of the art for process engineering approaches. Int. J. Pharm, 2008; 363(1): 26-39. https://doi.org/10.1016/j.ijpharm.2008.07.018
24.Benita S. Microencapsulation, methods and industrial applications. 2016; New York Marcel Dekker, Inc.
25.Beckett A H,Stenlake J B. Practical pharmaceutical chemistry Ed 4. 1988; London: The Athlone Press.
26.Tadudari A, Thadkala K, Kumar Devara R, Aukunuru J. Formulation, Characterisation and evaluation of sustained release microcapsules of gemifloxacin. 2014.
27.Park S J, Kim K S. Effect of oxygen plasma treatment on the release behaviors of poly (ɛ-caprolactone) microcapsules containing tocopherol. colloids and surfaces B: Biointerfaces. 2005; 43(3): 138-142. https://doi.org/10.1016 /j.colsurfb.2005.04.006
28.Woodruff MA, Hutmacher DW. The return of a forgotten polymer polycaprolactone in The 21st.century. Progr. Polym. Sci. 2010; 35(10): 1217-1256. https://doi.org/10.1016 /j.progpolymsci.2010.04.002
Cite this article as:
Muslim Suardi et al. Formulation of urea microcapsules by using Polystyrene:Polycaprolactone matrix and its characterization. Int. Res. J. Pharm. 2018;9(11):42-47 http://dx.doi.org/10.7897/2230-8407.0911255
Source of support: The Rector of Andalas University, Conflict of interest: None Declared