United States Birth Weight Reference Corrected For
Implausible Gestational Age Estimates
WHAT’S KNOWN ON THIS SUBJECT: Population-based references of birth weight for gestational age are useful indices of birth size in clinical and research settings.
WHAT THIS STUDY ADDS: This article uses 2009–2010 US natality data and corrects for likely errors in gestational age dating to yield an up-to-date birth weight for gestational age reference.
abstract
OBJECTIVES:To provide an updated US birth weight for gestational age reference corrected for likely errors in last menstrual period (LMP)-based gestational age dating, as well as means and SDs, to enable calculation of continuous and categorical measures of birth weight for gestational age.
METHODS: From the 2009–2010 US live birth files, we abstracted singleton births between 22 and 44 weeks of gestation with at least 1 nonmissing estimate of gestational age (ie, LMP or obstetric/clinical) and birth weight. Using an algorithm based on birth weight and the concordance between these gestational age estimates, implausible LMP-based gestational age estimates were either excluded or corrected by using the obstetric/clinical estimate. Gestational age– and sex-specific birth weight means, SDs, and smoothed percentiles (3rd, 5th, 10th, 90th, 95th, 97th) were calculated, and the 10th and 90th percentiles were compared with published population-based references.
RESULTS:A total of 7 818 201 (99% of eligible) births were included. The LMP-based estimate of gestational age comprised 85% of the dataset, and the obstetric/clinical estimate comprised the remaining 15%. Cut points derived from the current reference identified∼10% of births as #10th and $90th percentiles at all gestational weeks, whereas cut points derived from previous US-based references captured variable proportions of infants at these thresholds within the preterm and postterm gestational age ranges.
CONCLUSIONS:This updated US-based birth weight for gestational age reference corrects for likely errors in gestational age dating and allows for the calculation of categorical and continuous measures of birth size.Pediatrics2014;133:844–853
AUTHORS:Nicole M. Talge, PhD,aLanay M. Mudd, PhD,bAlla
Sikorskii, PhD,cand Olga Basso, PhDd,e
Departments ofaEpidemiology and Biostatistics,bKinesiology,
andcStatistics and Probability, Michigan State University, East
Lansing, Michigan; and Departments ofdObstetrics and
Gynecology, andeEpidemiology, Biostatistics, and Occupational
Health, McGill University, Montreal, Quebec, Canada
KEY WORDS
reference, growth charts, gestational age, birth weight, small for gestational age, United States
ABBREVIATIONS
LGA—large for gestational age LMP—last menstrual period SGA—small for gestational age
All authors met each of the 3 criteria for authorship as defined in thePediatricsAuthor Guidelines. Dr Talge provided significant intellectual contributions to the study conceptualization and design as well as the interpretation offindings, executed the statistical analyses, and was the primary contributor to all manuscript drafts; Dr Mudd provided significant intellectual contributions to the study conceptualization and design as well as the interpretation offindings, drafted portions of the manuscript, and provided critical revisions throughout the manuscript drafting process; Dr Sikorskii was instrumental in guiding the application and interpretation of statistical techniques that featured prominently in the manuscript (eg, 4253H, twice); and Dr Basso provided significant intellectual contributions to the study’s analytic approach, was highly involved in the interpretation of studyfindings, and provided critical revisions to the manuscript.
www.pediatrics.org/cgi/doi/10.1542/peds.2013-3285
doi:10.1542/peds.2013-3285
Accepted for publication Feb 13, 2014
Address correspondence to Nicole M. Talge, PhD, Department of Epidemiology and Biostatistics, Michigan State University, 909 Fee Rd, Room B601, East Lansing, MI 48824. E-mail: [email protected]. edu
PEDIATRICS (ISSN Numbers: Print, 0031-4005; Online, 1098-4275).
Copyright © 2014 by the American Academy of Pediatrics
FINANCIAL DISCLOSURE:The authors have indicated they have nofinancial relationships relevant to this article to disclose.
FUNDING:No external funding.
Several population-based references for measuring birth weight for gesta-tional age have been generated.1–4
These references are used by clinicians to identify at-risk infants who may have suffered from restricted or excessive fetal growth and by researchers to generate measures of birth size that are interpreted as indicators of maternal/ fetal health or risk factors for later health outcomes. Although most pre-vious studies have focused on the antecedents or sequelae of infants at the extremes of the birth weight for gestational age distribution (ie, small or large for gestational age [SGA or LGA]), researchers are increasingly making use of the entire distribution to inform their work (eg, birth weightz-scores).5
US population-based references report birth weights that correspond to per-centile thresholds (eg, 10th, 90th), but do not include the information needed to calculate continuous measures of birth weight for gestational age (ie, means, SDs).1,4Additionally, existing US
references rely solely on gestational age estimated from maternal reports of last menstrual period (LMP).1,4,6
LMP-based estimates are prone to er-ror, with the proportion of implausible estimates being particularly high be-tween 28 and 31 weeks of gestation.5,7
Sources of error in LMPs include their susceptibility to digit preference as well as imprecision among women with irregular menstrual cycles or ev-idence of early bleeding.8–10 To date,
references have relied on removal of records with implausible birth weights for gestational age to improve their accuracy.1,4 However, the widespread
inclusion of obstetric/clinical esti-mates on birth certificates has led to additional approaches for correction. Such approaches typically involve eval-uating the concordance between the LMP and obstetric/clinical estimates within a particular range (eg, 1–2 weeks), and either removing exceedingly
discrepant records or replacing likely errors in LMP with the obstetric/clinical estimate.5,11,12Birth weight for gestational
age references generated from vital re-cords have yet to reflect these advances in improving the precision of gestational age dating, despite calls to do so.11
Our purpose was to create an updated US birth weight for gestational age reference by using an algorithm based on birth weight and the concordance between LMP and obstetric/clinical ges-tational age estimates. Furthermore, we provide the information needed to cal-culate categorical and continuous measures of birth size.
METHODS
Study Population
The study population consisted of the combined 2009 and 2010 US Live Birth Files maintained by the National Center for Health Statistics (n = 8 130 051 births to US resident women). Two estimates of gestational age are avail-able in these data: (1) the LMP-based estimate (common to all states), and (2) the clinical or obstetric-based es-timate (any given state reports one or the other, depending on whether the 1989 or 2003 version of the Certificate of Live Birth, respectively, was used). The clinical and obstetric estimates of gestational age can be informed by prenatal assessments (eg, ultra-sounds), but clinical estimates also may be informed by neonatal exami-nations.13,14
We excluded nonsingleton births, re-cords missing birth weight or both estimates of gestational age, and re-cords with all available gestational age estimates either ,22 weeks or .44 weeks (n = 302 516, nonmutually ex-clusive). This resulted in 7 827 535 singleton births eligible for inclusion. The Michigan State University Institu-tional Review Board deemed this study exempt.
To identify likely errors in gestational age and generate a “corrected” data-set, we applied an algorithm developed by Basso and Wilcox.12This procedure
uses LMP and/or obstetric/clinical-based estimates of gestational age, along with birth weight, to identify records with likely errors. This algo-rithm is described in detail else-where,12 but is summarized briefly
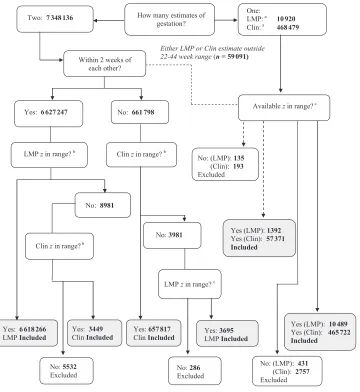
here. If both the LMP and obstetric/ clinical estimates of gestational age were available, they were checked to see if they were within 2 weeks of each other. In such cases, the birth weight z-score* based on the LMP estimate was examined to see if it was consid-ered plausible for that gestational age (Fig 1, footnotes a and b). If so, the LMP estimate was retained; if not, and if the birth weight z-score based on the obstetric/clinical estimate was within the acceptable range, the obstetric/ clinical estimate replaced the LMP. If neither the LMP nor the obstetric/ clinical birth weightz-score was within range, the record was discarded. If the LMP and obstetric/clinical estimates differed by .2 weeks, the obstetric/ clinical estimate was examined first and retained if thez-score was within range; if not, the LMP estimate was ex-amined and retained if thez-score was within range. Finally, if only 1 estimate of gestational age was available (or within the 22–44-week window), it was exam-ined to see if the z-score was within range and could be retained. This pro-cedure resulted in the exclusion of 9334 records, leaving 7 818 201 births in the corrected dataset. Next, we applied the Alexander et al1criteria (see Table 1 of
that publication) to identify additional implausible birth weights for gesta-tional age, but none were observed. We
then applied a nonlinear, resistant smoothing technique (4253H, twice) to reduce the impact of irregularities in the percentile curves across gestational age groups and obtain cross-age smoothed estimates.15 This procedure, used by
previous references to which ours is compared, is not based on distributional assumptions and altered birth weight percentile thresholds by a minimum of 0 g (23 weeks) and a maximum of 69 g (43 weeks) (data not shown).
To examine whether secular changes in perinatal outcomes explained differences
observed between previous refer-ences and our newly created one, we created a “comparison” dataset that applied the gestational age cleaning process used to obtain previous US-based references. For this purpose, we restricted our data to births with nonmissing LMP estimates of gesta-tional age between 22 and 44 weeks in the 2009 and 2010 US natality datasets (n= 7 301 492), applied the Alexander et al1criteria to identify records with
implausible birth weights for gesta-tional age (26 738 records removed,
finaln= 7 274 754), and used the 4253H, twice smoothing technique.15
Analysis Plan
Wefirst described the corrected data-set according to gestational age esti-mation method and demographic characteristics. We then calculated gestational age–specific skewness and kurtosis values to evaluate their de-parture from normality and, hence, the appropriateness of means and SDs as summaries of the birth weight dis-tributions. Next, we calculated birth FIGURE 1
weights corresponding to thresholds used to define SGA and LGA births (ie, 3rd, 5th, 10th, 90th, 95th, and 97th percentiles), along with the median (50th percentile). Descriptive statistics were then recalculated separately for males and females. We did not calcu-late race/ethnicity-specific estimates, because differences in birth weight by race/ethnicity may reflect disparities in obstetric care, environmental expo-sures, and social circumstances.16
We then compared the corrected refer-ence to those published by Alexander et al,1 based on 1991 US natality data,
and Oken et al,4based on 1999–2000 US
natality data, because both provided population-level, sex-specific estimates for most birth weight for gestational age reference measures. Specifically, the 10th and 90th percentiles derived from these references, as well as from the comparison dataset, were applied to the corrected dataset to evaluate the degree to which each captured the expected
lowest and highest 10% of births. Finally, we compared the corrected dataset ref-erence with a commonly used Canadian one that reports gestational age–and sex-specific means and SDs, which are not available in US references generated from vital records data.17The Canadian
reference is based on a national dataset (excluding Ontario) of singleton births between 1994 and 1996, with gestational age based primarily on early ultra-sounds.17We did not compare our
cor-rected reference to (1) those combining individual birth weight references under investigation here into a single refer-ence,6,18 or (2) standards, which are
generated following the exclusion of maternal/fetal health characteristics associated with alterations in birth weight (eg, congenital anomalies). Standards differ conceptually from references, and exclusion criteria used to generate them cannot be rig-orously applied given the limitations of vital records data.19–23
RESULTS
The LMP-based estimate of gestational age comprised 85% of the records in the corrected dataset, and the obstetric/clinical estimates comprised the remaining 15% (Fig 1). The per-centage of LMP-based estimates that were reassigned downward (5.4% overall) or upward (3.6% overall) or discarded (0.08% overall) at each ges-tational week is provided in the online supplement (Supplemental Table 4). The observed patterns closely re-semble those reported by Basso and Wilcox (e-Appendix),12with LMPs
reas-signed upward 11% to 42% and 1% to 6% of the time in the preterm and term ranges, respectively; LMPs were reas-signed downward 46% to 98% of the time in the postterm range (Supple-mental Table 4).
Within the corrected dataset,∼90% of births occurred at term (37–41 weeks), whereas 8% and 2% of births occurred within the preterm (,37 weeks) and postterm ranges ($42 weeks), re-spectively. Males comprised 51% of the births, and 49% of infants were fi rst-borns. With respect to maternal race/ ethnicity, non-Hispanic white was the most prevalent (54%), followed by Hispanic (24%), non-Hispanic black (15%), and Asian/other (7%). None of these characteristics varied signifi -cantly from those in the comparison dataset (Supplemental Table 5). How-ever, there were slightly higher rates of preterm (10%) and postterm (5%) births in the comparison dataset.
Gestational age–specific skewness and kurtosis values using the corrected dataset are presented in Supplemental Table 6. With the exception of a kurtosis value of 1.4 at 44 weeks, all values were near 0, indicating a good approxima-tion of the birth weight distribuapproxima-tions to normal. Because normal distributions are appropriately characterized by means and SDs, we calculated these parameters according to gestational
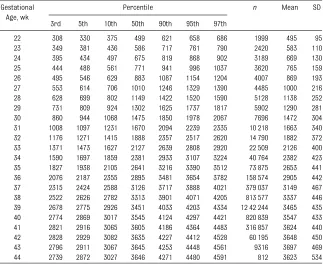
TABLE 1 Means, SDs, and Smoothed Percentiles for Birth Weight (g) for Gestational Age Within the Corrected Dataset: US Male Singleton Live Births (2009–2010)
Gestational Age, wk
Percentile n Mean SD
3rd 5th 10th 50th 90th 95th 97th
22 308 330 375 499 621 658 686 1999 495 95
23 349 381 436 586 717 761 790 2420 583 110 24 395 434 497 675 819 868 902 3189 669 130 25 444 488 561 771 941 996 1037 3620 765 159 26 495 546 629 883 1087 1154 1204 4007 869 193 27 553 614 706 1010 1246 1329 1390 4485 1000 216 28 628 699 802 1149 1422 1520 1590 5128 1138 252 29 731 809 924 1302 1625 1737 1817 5902 1290 281 30 860 944 1068 1475 1850 1978 2067 7696 1472 304 31 1008 1097 1231 1670 2094 2239 2335 10 218 1663 340 32 1176 1271 1415 1888 2357 2517 2620 14 790 1882 372 33 1371 1473 1627 2127 2639 2808 2920 22 509 2126 400 34 1590 1697 1859 2381 2933 3107 3224 40 764 2382 423 35 1827 1938 2105 2641 3216 3390 3512 73 875 2653 441 36 2076 2187 2355 2895 3481 3654 3782 158 574 2905 442 37 2315 2424 2588 3126 3717 3888 4021 379 037 3149 467 38 2522 2626 2782 3313 3901 4071 4205 813 577 3337 446 39 2678 2775 2926 3451 4033 4203 4334 12 42 244 3465 435 40 2774 2869 3017 3545 4124 4297 4421 820 839 3547 433 41 2821 2916 3065 3605 4186 4364 4483 316 857 3624 440 42 2828 2929 3082 3635 4227 4412 4528 60 195 3648 450 43 2796 2911 3067 3645 4253 4448 4561 9316 3697 469 44 2739 2872 3027 3646 4271 4480 4591 812 3623 534
The corrected dataset uses both LMP- and clinical/obstetric-based estimates of gestational age and reflects the application of the Basso and Wilcox12algorithm to correct likely errors in gestational age and excludes implausible birth weights for
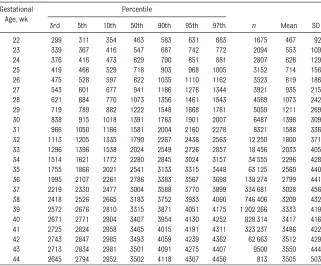
week and sex (Tables 1 and 2, re-spectively). The mean gestational age at delivery was 38.6 weeks with a SD of 2 weeks. Birth weight increased as gestational week increased, with the largest SDs observed after 33 weeks for both males and females.
Comparisons With Previous References
Male and female births in the corrected dataset were categorized into the 10th and 90th percentiles of birth weight for gestational age (ie, SGA, LGA) using cut points derived from the corrected dataset, the comparison dataset, and references published by Oken et al,4
Alexander et al,1 and Kramer et al.17
Table 3 provides the sex-specific pro-portions of these births within the preterm, term, and postterm gesta-tional age ranges.
As expected, thresholds derived from the corrected dataset capture∼10% of births below the 10th and above the
90th percentile across all gestational age categories (range: 9.1% to 10.9%). However, thresholds derived from the comparison dataset, along with those from previously published US-based references, captured varying pro-portions of SGA and LGA births with-in the corrected dataset, particularly within the preterm and postterm ranges. Among preterm births, the 10th percentiles derived from previous US references, as well as from our comparison dataset, captured 11% to 15% of SGA births in the corrected dataset; however, the 90th percentiles captured a markedly smaller pro-portion of LGA births (∼3%). Among postterm births, these cut points cap-tured a smaller proportion of SGA births in the corrected dataset (3% to 6%), and a slightly greater proportion of LGA births (11% to 16%). The Canadian-based cut points identified a larger proportion of SGA births (18%) and a smaller proportion of LGA births
(5%) in the postterm range, but∼10% of births in the preterm and term ranges.
The cut points used to identify the 10th and 90th percentiles for male singletons are displayed graphically in Fig 2 for our corrected reference, and for Oken et al,4
Alexander et al,1 and Kramer et al.17
For the 10th percentile, all references overlap considerably except at term and postterm gestations, where the Canadian reference diverges from the US ones. For the 90th percentile, the corrected and Canadian references differ from the previous US-based ref-erence most prominently at preterm gestations (especially 28–31 weeks), the range at which epidemiologic stud-ies note a bimodal birth weight distri-bution that our gestational age cleaning process eliminated (Fig 3).
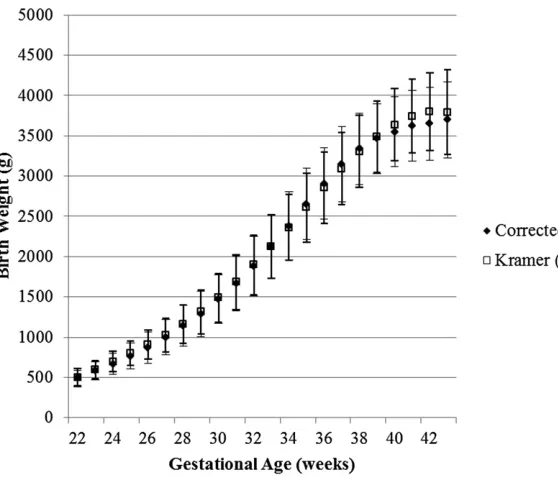
We compared gestational age–specific birth weight means and SDs from the corrected dataset with the Kramer et al17reference for males (Fig 4) and
females (data not shown). Means and SDs were similar between the 2 ref-erences, except for the term and postterm ranges, where mean birth weights from the corrected dataset were lower than the Kramer et al17
estimates.
DISCUSSION
We provide an updated US birth weight for gestational age reference following correction for implausible estimates of gestational age, along with the in-formation needed to calculate contin-uous and/or categorical measures of birth size. We used 2 recent National Center for Health Statistics natality datasets, thus generating a reference that reflects the current sociodemo-graphic composition of the United States.
The most notable difference between the current and previous US references is that LMP-based gestational age was sometimes discarded (∼1%) or reas-signed using the obstetric/clinical
TABLE 2 Means, SDs, and Smoothed Percentiles for Birth Weight (g) for Gestational Age Within the Corrected Dataset: US Female Singleton Live Births (2009–2010)
Gestational Age, wk
Percentile
3rd 5th 10th 50th 90th 95th 97th n Mean SD
22 299 311 354 463 583 631 663 1675 467 92
23 339 367 416 547 687 742 772 2094 553 109 24 376 416 473 629 790 851 881 2807 626 129 25 419 466 529 718 903 968 1005 3152 714 156 26 475 528 597 822 1035 1110 1162 3523 819 186 27 543 601 677 941 1186 1276 1344 3921 935 215 28 621 684 770 1073 1356 1461 1543 4569 1073 242 29 719 789 882 1222 1548 1668 1761 5059 1211 269 30 838 915 1018 1391 1763 1901 2007 6487 1396 309 31 966 1050 1166 1581 2004 2160 2278 8321 1588 336 32 1113 1205 1335 1790 2267 2436 2563 12 250 1800 371 33 1296 1396 1538 2024 2549 2726 2857 18 456 2033 405 34 1514 1621 1772 2280 2845 3024 3157 34 555 2296 428 35 1755 1866 2021 2541 3133 3315 3448 63 125 2560 440 36 1995 2107 2261 2786 3383 3567 3698 138 274 2799 441 37 2219 2330 2477 3004 3588 3770 3899 334 681 3028 456 38 2418 2526 2665 3183 3752 3933 4060 746 406 3209 432 39 2572 2676 2810 3315 3871 4051 4175 1 202 266 3333 419 40 2671 2771 2904 3407 3954 4130 4252 828 314 3417 416 41 2725 2824 2958 3465 4015 4191 4311 323 237 3486 422 42 2743 2847 2985 3493 4059 4239 4362 62 663 3512 429 43 2713 2834 2981 3501 4091 4275 4407 9500 3550 444 44 2645 2794 2952 3502 4118 4307 4456 813 3505 503
The corrected dataset uses both LMP- and clinical/obstetric-based estimates of gestational age and reflects the application of the Basso and Wilcox12algorithm to correct likely errors in gestational age and to exclude implausible birth weights for
estimate (∼9%) (Fig 1; Supplemental Table 4). These changes resulted in the elimination of the“second mode”in the birth weight distribution at 28 to 31
weeks, allowing for the calculation of means and SDs without further cor-rection. Previous work suggests that the second mode primarily reflects
errors in LMP dating.5,7,24However, the
accuracy of obstetric/clinical esti-mates should not be implicitly as-sumed. With ultrasound-based data,
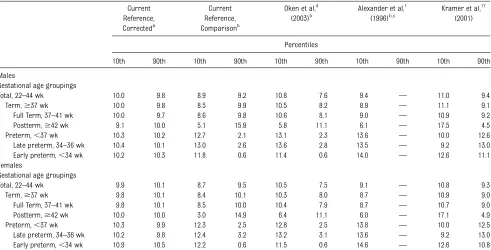
TABLE 3 Rates of Small- and Large-for-Gestational-Age Births in the 2009 and 2010 US Singleton Live Birth Population Using Current and Previously Published Criteria
Current Reference, Correcteda
Current Reference, Comparisonb
Oken et al,4
(2003)b
Alexander et al,1
(1996)b,c
Kramer et al,17
(2001)
Percentiles
10th 90th 10th 90th 10th 90th 10th 90th 10th 90th
Males
Gestational age groupings
Total, 22–44 wk 10.0 9.8 8.9 9.2 10.8 7.6 9.4 — 11.0 9.4
Term,$37 wk 10.0 9.8 8.5 9.9 10.5 8.2 8.9 — 11.1 9.1
Full Term, 37–41 wk 10.0 9.7 8.6 9.8 10.6 8.1 9.0 — 10.9 9.2
Postterm,$42 wk 9.1 10.0 5.1 15.9 5.8 11.1 6.1 — 17.5 4.5
Preterm,,37 wk 10.3 10.2 12.7 2.1 13.1 2.3 13.6 — 10.0 12.6
Late preterm, 34–36 wk 10.4 10.1 13.0 2.6 13.6 2.8 13.5 — 9.2 13.0 Early preterm,,34 wk 10.2 10.3 11.8 0.6 11.4 0.6 14.0 — 12.6 11.1 Females
Gestational age groupings
Total, 22–44 wk 9.9 10.1 8.7 9.5 10.5 7.5 9.1 — 10.8 9.3
Term,$37 wk 9.8 10.1 8.4 10.1 10.3 8.0 8.7 — 10.9 9.0
Full Term, 37–41 wk 9.8 10.1 8.5 10.0 10.4 7.9 8.7 — 10.7 9.0
Postterm,$42 wk 10.0 10.0 3.0 14.9 6.4 11.1 6.0 — 17.1 4.9
Preterm,,37 wk 10.3 9.9 12.3 2.5 12.8 2.5 13.8 — 10.0 12.5
Late preterm, 34–36 wk 10.2 9.8 12.4 3.2 13.2 3.1 13.6 — 9.2 13.0 Early preterm,,34 wk 10.9 10.5 12.2 0.6 11.5 0.6 14.6 — 12.6 10.8
aEstimates use both LMP- and obstetric/clinical-based estimates of gestational age and reflect the application of the Basso and Wilcox12algorithm to correct likely errors in gestational age
and exclude implausible birth weights for gestational age.
bEstimates are limited to births with LMP-based estimates of gestational age and reflect the application of the Alexander et al1criteria to exclude implausible birth weights for gestational age. cReference does not provide sex- and gestational age–specific thresholds at the 90th percentile.
FIGURE 2
FIGURE 3
factors that interfere with image visu-alization (eg, maternal obesity) or
in-fluence fetal size early in pregnancy (eg, maternal smoking) may lead to misclassification of gestational age.25–27
Given the potential for such systematic sources of error,28 we used an
algo-rithm that leverages all available esti-mates of gestational age to identify records with likely errors in dating.
When cut points derived from previous US references were applied to our corrected dataset, discrepancies were most apparent in the pre- and postterm ranges. Among preterm births, pre-vious LMP-based US references cap-tured a greater proportion of births below the 10th percentile and a mark-edly lower proportion of births above the 90th percentile compared with the current reference. This is likely because we were able to eliminate the second mode of the birth weight distribution in the preterm gestational age range, which resulted in a reduction in the birth weight thresholds. In fact, among early preterm births, only a small
minority of the infants falling above the 90th percentile according to our ref-erence would be identified using pre-vious references. Among postterm births, previous references capture substantially fewer births below the 10th percentile, but similar rates of births above the 90th percentile. In the corrected dataset, LMP-based gesta-tional age in the postterm range was reassigned downward using the obstetric/clinical estimate 46% to 98% of the time (Supplemental Table 4), likely resulting in the inclusion of births that would have otherwise been excluded. This may have enriched our dataset with smaller infants at these gestational ages, given that higher rates of growth restriction have been observed among postterm compared with term births.29
Importantly, cut points derived from the comparison dataset performed simi-larly to previous US references, strongly suggesting that secular changes in perinatal outcomes (eg, preterm de-livery) cannot explain the differences described above.
We also compared our reference with Kramer et al,17 as it was based
pri-marily on ultrasound estimates of gestational age. With the exception of the postterm range, our reference captured similar rates of births below the 10th and above the 90th percentile across a range of gestational ages. Kramer et al17is also the only North
American population-based reference to report gestational age–specific means and SDs. These parameters ex-hibit considerable similarity to ours, except beyond 40 weeks of gestation. Post hoc analyses revealed that when our reference was generated including only obstetric/clinical estimates of gestational age and maternal white, non-Hispanic race/ethnicity, these dis-crepancies were virtually eliminated (data not shown).
The gestational age–and sex-specific parameters provided in the current reference allow for the incorporation of both categorical and continuous measures of birth size in data analysis. Given the growing appreciation for the FIGURE 4
impact of perinatal risks across the birth weight for gestational age dis-tribution, along with the development of statistical methods allowing for lo-calization of effects within a given dis-tribution (eg, quantile regression), the time is ripe for this information to be available based on data from the US population.
However, there are some interpreta-tional caveats to consider. First, our reference, along with previous population-based references, is population-based on cross-sectional data and does not reflect the longitudinal growth trajectory of individual infants. It is possible that longitudinal assessments of fetal size, although more expensive and chal-lenging to obtain, would yield estimates that diverge from those presented here. Second, this reference does not ad-dress the fact that preterm infants are smaller than their counterparts who are in utero at the same gestational week. Thus, for preterm infants, the birth weight for gestational age per-centile derived from a reference
gen-erated by using peers born at the same gestational week is likely higher than one derived from a reference that includes in utero counterparts.30Third,
our reference does not address contro-versies surrounding population-based versus“customized”birth weight refer-ences, which take into account maternal height and demographic characteristics in the evaluation of birth size. We also do not address the conceptual differences between references and standards, the latter of which are generated following the exclusion of maternal/fetal con-ditions associated with alterations in birth weight. Discussion of conceptual differences is beyond the scope of this article, but there is mixed or scant evi-dence regarding the clinical advantages afforded by customization or standards, respectively.31–35Our reference may
in-form these important debates by en-abling comparisons that are likely unselected for the maternal/fetal characteristics of interest. Fourth, al-though we collapsed 2 years of vital records data to generate the current
reference, cell sizes are smaller at the extremes of the gestational age range. As a result, these estimates may be less reliable, particularly when stratified by other factors (eg, sex). Thus, although we have cor-rected for likely errors in gestational age, our reference must still be inter-preted considering the issues de-scribed above.
Despite these caveats, our reference is up to date, reflects the current socio-demographic composition of the United States, and applies recently developed algorithms to correct likely errors in gestational age. The need for such a reference has been specifically ex-pressed in the literature, as concerns regarding the validity of any analysis based solely on LMPs have become in-creasingly appreciated.5,7,11,24
Compar-isons with other references, along with extensive data presented here and in the online supplement, will allow researchers and clinicians to weigh the appropriateness of our reference against their specific needs.
REFERENCES
1. Alexander GR, Himes JH, Kaufman RB, Mor J, Kogan M. A United States national ref-erence for fetal growth. Obstet Gynecol. 1996;87(2):163–168
2. Alexander GR, Kogan MD, Himes JH. 1994– 1996 U.S. singleton birth weight percentiles for gestational age by race, Hispanic
ori-gin, and gender. Matern Child Health J. 1999;3(4):225–231
3. Zhang J, Bowes WA Jr. Birth-weight-for-gestational-age patterns by race, sex, and parity in the United States population.
Obstet Gynecol. 1995;86(2):200–208
4. Oken E, Kleinman KP, Rich-Edwards J, Gillman MW. A nearly continuous measure of birth
weight for gestational age using a United States national reference. BMC Pediatr. 2003;3:6
5. Qin C, Dietz PM, England LJ, Martin JA, Callaghan WM. Effects of different data-editing methods on trends in race-specific
preterm delivery rates, United States, 1990–
2002. Paediatr Perinat Epidemiol. 2007;21 (suppl 2):41–49
6. Fenton TR. A new growth chart for preterm babies: Babson and Benda’s chart updated with recent data and a new format.BMC Pediatr. 2003;3:13
7. Ananth CV. Menstrual versus clinical esti-mate of gestational age dating in the
United States: temporal trends and vari-ability in indices of perinatal outcomes.
Paediatr Perinat Epidemiol. 2007;21(suppl 2):22–30
8. Savitz DA, Terry JW Jr, Dole N, Thorp JM Jr, Siega-Riz AM, Herring AH. Comparison of pregnancy dating by last menstrual period,
ultrasound scanning, and their combina-tion. Am J Obstet Gynecol. 2002;187(6): 1660–1666
9. Gjessing HK, Skjaerven R, Wilcox AJ. Errors in gestational age: evidence of bleeding early in pregnancy. Am J Public Health.
1999;89(2):213–218
10. Alexander GR, Tompkins ME, Petersen DJ, Hulsey TC, Mor J. Discordance between LMP-based and clinically estimated gesta-tional age: implications for research, pro-grams, and policy.Public Health Rep. 1995;
110(4):395–402
11. Callaghan WM, Dietz PM. Differences in
birth weight for gestational age dis-tributions according to the measures used to assign gestational age.Am J Epidemiol. 2010;171(7):826–836
12. Basso O, Wilcox A. Mortality risk among preterm babies: immaturity versus
un-derlying pathology. Epidemiology. 2010;21 (4):521–527
13. National Center for Health Statistics. The 1989 Revision of the U.S. Standard Certifi -cates and Reports. Hyattsville, MD: National Center for Health Statistics; 1989
14. National Center for Health Statistics.Guide to completing the facility worksheets for
Fetal Death. Hyattsville, MD: National Center for Health Statistics; 2003
15. Himes JH, Hoaglin DC. Resistant cross-age smoothing of age-specific percentiles for growth reference data. Am J Hum Biol. 1989;1(2):165–173
16. Bryant AS, Worjoloh A, Caughey AB, Washington AE. Racial/ethnic disparities in obstetric outcomes and care: prevalence and determinants. Am J Obstet Gynecol. 2010;202(4):335–343
17. Kramer MS, Platt RW, Wen SW, et al; Fetal/ Infant Health Study Group of the Canadian Perinatal Surveillance System. A new and improved population-based Canadian ref-erence for birth weight for gestational age.
Pediatrics. 2001;108(2). Available at: www. pediatrics.org/cgi/content/full/108/2/e35
18. Fenton TR, Kim JH. A systematic review and meta-analysis to revise the Fenton growth chart for preterm infants. BMC Pediatr. 2013;13:59
19. Olsen IE, Groveman SA, Lawson ML, Clark RH, Zemel BS. New intrauterine growth curves based on United States data. Pedi-atrics. 2010;125(2). Available at: www.pedi-atrics.org/cgi/content/full/125/2/e214
20. Li J, Robbins S, Lamm SH. The influence of misclassification bias on the reported rates of congenital anomalies on the birth certificates for West Virginia—a conse-quence of an open-ended query. Birth Defects Res A Clin Mol Teratol. 2013;97(3): 140–151
21. Watkins ML, Edmonds L, McClearn A, Mullins L, Mulinare J, Khoury M. The surveillance of birth defects: the
useful-ness of the revised US standard birth certificate.Am J Public Health. 1996;86(5): 731–734
22. Banerjee E, Zabel E, Alexander B.
Compari-son of defects identified through Minneso-ta’s Birth Defects Information System And Vital Records, 2006–2008. J Registry Manag.Spring 2012;39(1):8–12
23. Zollinger TW, Przybylski MJ, Gamache RE.
Reliability of Indiana birth certificate data compared to medical records. Ann Epi-demiol. 2006;16(1):1–10
24. Dietz PM, England LJ, Callaghan WM, Pearl M, Wier ML, Kharrazi M. A comparison of
LMP-based and ultrasound-based estimates of gestational age using linked California livebirth and prenatal screening records.
Paediatr Perinat Epidemiol. 2007;21(suppl 2):62–71
25. Simic M, Wåhlin IA, Marsál K, Källén K.
Maternal obesity is a potential source of error in mid-trimester ultrasound estima-tion of gestaestima-tional age.Ultrasound Obstet Gynecol. 2010;35(1):48–53
26. Henriksen TB, Wilcox AJ, Hedegaard M,
Secher NJ. Bias in studies of preterm and postterm delivery due to ultrasound as-sessment of gestational age.Epidemiology. 1995;6(5):533–537
27. Wolfe HM, Sokol RJ, Martier SM, Zador IE.
Maternal obesity: a potential source of er-ror in sonographic prenatal diagnosis.
Obstet Gynecol. 1990;76(3 Pt 1):339–342
28. Wingate MS, Alexander GR, Buekens P, Vahratian A. Comparison of gestational age classifications: date of last menstrual period
vs. clinical estimate.Ann Epidemiol. 2007;17 (6):425–430
29. Clausson B, Cnattingius S, Axelsson O. Out-comes of post-term births: the role of fetal
growth restriction and malformations.
Obstet Gynecol. 1999;94(5 pt 1):758–762
30. Hutcheon JA, Platt RW. The missing data problem in birth weight percentiles and thresholds for “small-for-gestational-age”.
Am J Epidemiol. 2008;167(7):786–792
31. Gardosi J, Francis A. Adverse pregnancy outcome and association with small for gestational age birthweight by customized and population-based percentiles. Am J
Obstet Gynecol. 2009;201(1):28.e1–28.e8
32. Hutcheon JA, Zhang X, Platt RW, Cnattingius
S, Kramer MS. The case against customised birthweight standards. Paediatr Perinat Epidemiol. 2011;25(1):11–16
33. Haglund B. Birthweight distributions by gestational age: comparison of LMP-based
and ultrasound-based estimates of gesta-tional age using data from the Swedish Birth Registry.Paediatr Perinat Epidemiol. 2007;21(suppl 2):72–78
34. Carberry AE, Raynes-Greenow CH, Turner
RM, Jeffery HE. Customized versus population-based birth weight charts for the detection of neonatal growth and perinatal morbidity in a cross-sectional
study of term neonates. Am J Epidemiol. 2013;178(8):1301–1308
DOI: 10.1542/peds.2013-3285 originally published online April 28, 2014;
2014;133;844
Pediatrics
Nicole M. Talge, Lanay M. Mudd, Alla Sikorskii and Olga Basso
Age Estimates
United States Birth Weight Reference Corrected For Implausible Gestational
Services
Updated Information &
http://pediatrics.aappublications.org/content/133/5/844 including high resolution figures, can be found at:
References
http://pediatrics.aappublications.org/content/133/5/844#BIBL This article cites 31 articles, 1 of which you can access for free at:
Subspecialty Collections
http://www.aappublications.org/cgi/collection/obstetrics_sub Obstetrics
http://www.aappublications.org/cgi/collection/gynecology_sub Gynecology
milestones_sub
http://www.aappublications.org/cgi/collection/growth:development_ Growth/Development Milestones
al_issues_sub
http://www.aappublications.org/cgi/collection/development:behavior Developmental/Behavioral Pediatrics
following collection(s):
This article, along with others on similar topics, appears in the
Permissions & Licensing
http://www.aappublications.org/site/misc/Permissions.xhtml in its entirety can be found online at:
Information about reproducing this article in parts (figures, tables) or
Reprints
DOI: 10.1542/peds.2013-3285 originally published online April 28, 2014;
2014;133;844
Pediatrics
Nicole M. Talge, Lanay M. Mudd, Alla Sikorskii and Olga Basso
http://pediatrics.aappublications.org/content/133/5/844
located on the World Wide Web at:
The online version of this article, along with updated information and services, is
http://pediatrics.aappublications.org/content/suppl/2014/04/22/peds.2013-3285.DCSupplemental Data Supplement at:
by the American Academy of Pediatrics. All rights reserved. Print ISSN: 1073-0397.