281 | P a g e
Optimal Placement of Phasor Measurement Unit
Using Ant Colony Optimization
RakeshRathore
1, Dr. Anoop Arya
21,2
M.Tech. Student, Electrical Department, MANIT Bhopal, (India)
ABSTRACT
Efficient and reliable Wide Area Monitoring System (WAMS) is crucial in preventing outages and cascading
failures in the smart grid. Since Phasor measurement units (PMU)s are the critical part of the WAMS, the
questions of the arrangement and number of PMUs to use and place in order to evaluate risk must be
addressed. This paper presents the optimal placement of PMU, ensuring system observability. An Ant Colony
Optimization (ACO) method for Optimal Placement of PMU (OPP) problems is suggested which is a
probability-based searching method. The proposed method is applied to the OPP problem in IEEE 9–Bus,
14-Bus and 30-bus test systems to show its effectiveness. Results obtained using ACO has been compared to the
results of PSO, SA, GA and other methods and it has been found that it is computationally robust and takes
lesser time than other optimization algorithms.
Keywords:
Phasor measurement units, Optimal placement, Ant colony optimization, observability
.
1.
INTRODUCTION
The extensive development of power networks has increased the requirements for robust, reliable and secure
monitoring and control techniques. As an effort to lead healthy modern power systems, the utility industry
across the world has tried to overcome the inherent insensibility of existing electricity system, which is resulted
from non-time synchronized and unidirectional characteristics of traditional grid. With the need of robust
modern electricity grid, the smart grid is expected to achieve the reliability and security in power grid system.
Phasor Measurement Units (PMUs) are an essential power system device that provides time synchronized
information about dynamic performance of power network. The information derived from measurements are
same-time sampled in voltage and current waveforms from Global Positioning System Satellites (GPS), which
enable PMU data from different utilities to be time-synchronized and combined to create a comprehensive view
of the broader electrical system. Phasor Measurement Units (PMUs) which provide time synchronized
measurements of voltage and current phasors are the key elements of Wide Area MonitoringSystem (WAMS)
[1]. This ability of a PMU to calculate synchronized phasors will improve the performance of state estimators.
This feature makes PMUs one of the most important measurement devices in power system protection and
control [2, 3]. However, due to high cost of PMUs or nonexistence of communication services in certain buses,
it is impossible to place a PMU on every bus in the network, either as a stand-alone unit or relay-based function.
Many algorithms utilizing PMU measurements for state estimation, voltage stability, fault location, network
parameter estimation, among others, have been developed. The primary requirement of most of these is that
282 | P a g e
high cost estimated in the placement of the PMU in large number of buses, much work has been previously
proposed to tackle the problem of minimizing the number of PMU devices subjected to various constraints.
Meta-heuristic methods involve intelligent search processes that can deal with discrete variables and
non-continuous cost functions. Marin et al. [4] used a Genetic Algorithm based procedure to solve the OPPProblem.
It was based on the process of genetic breeding, there was no implication on aspects of converging speed or
execution time.Srivastava et.al [5] described the application of search based technique Particle swarm
optimization (PSO) to solve network reconfiguration problem in distribution systems.Haijan et al. [6] used a
modified Binary Particle Swarm Optimization (BPSO) for PMU placement. The algorithm evaluates the fitness
of each particle in the search space with the objective to maximize the fitness of the entire population. Nuqui et
al. [7] introduced concepts of incomplete observability and depth of observability. It made use of spanning trees
of the power system graph to find the optimal locations of PMUs based on a desired depth of unobservability.
Baldwin et al. [8] used a dual bisecting search algorithm and simulated annealing method based on topological
observability to choose optimal minimum PMU and placement locations. This method suffered from excessive
calculation burden if applied to a large power system.Deterministic techniques make extensive use of integer
programming and numerical based methods.Abur et al. [9] used a numerical implementation of integer linear
programming for network analysis and cost of PMU installation with mixed measurement sets, which included
conventional power flow and injection measurements. Aminifar et al. [10] developed a basic ILP model for
network observability.Then, power network contingencies such as measurement losses and line outages were
added.Chakrabarti et al. [11] implemented an exhaustive binary searchto determine the minimum number of
PMUs. The solution that provided the highest measurement redundancy was chosen.
In the proposed method, the Ant colony optimization (ACO) technique has been used to find the optimal PMU
placement. ACO,a heuristic algorithm was first proposed by Marco Dorigo et al. [12, 13] for different
combinational optimization problem. Later, Wang. B et al. [14] usesthis technique for PMU optimization
problem.The contribution of this paper is that it shows the optimized tour of the artificial ants in the process and
gives a graphical representation of the PMU placement through simulation.
II. OBSERVABILITY ANALYSIS
The ability to estimate the power system state for a given set of measurements is referred as observability
analysis. For power system state estimation, it is essential to have geographical distribution of measurements
throughout the network.
2.1 Observability Rules
There are certain set of rules which governed the observability of substations (busses in this case):
If one end voltage phasor and the current phasor of a branch are known, then the voltage phasor at the other
end of the branch can be calculated.
If voltage phasors are known for both ends of a branch, then the current phasor of this branch can be directly
obtained.
If a zero-injection bus without PMU is there and the current phasors of the incident branches are all known
283 | P a g e
If the voltage phasor of a zero-injection bus is unknown and the voltage phasors of all adjacent buses are
known, then the voltage phasor of the zero-injection bus can be obtained through node voltage equations.
If the voltage phasors of a set of adjacent zero injection buses are unknown, but the voltage phasors of all the
adjacent buses to that set are known, then the voltage phasors of zeroinjection buses can be computed by
node voltage equations. These were used to find how well a given PMU allocation would measure a system.
2.2 Power system Observability with PMU
Before the discussion of PMU placement methods, the basic PMU placement rules should be cited. A PMU
installed on a certain bus is capablefor measuring the voltage magnitude and phase angle of the local bus and
the branch current phasor of all branches emerging from this bus. The voltage magnitude and phase angle of the
neighbouring bus can be computed using voltage drop equations. Thus the buses monitored by a PMU are
directly observable, the adjoining buses connected to the PMU buses are indirectly observable and the other
buses which are not linked with the PMU buses are unobservable. The following graph explains the bus
observability in a system:
A
B
C
D
E
F
G
PMU-2 PMU-1
Directly
Observed Directly
Observed
Observed Observed
Observed
Observed
Unobserved No.1
Fig.1 PMUobservability analysis
In Fig.1, the network has 7 buses from bus A to bus G. Assume two PMUs are located on bus B and bus F, so
bus B and F are directly observable. Bus A, C, E and G are all connected to bus B and F so they are indirectly
observable. Bus D is not associated with any PMU bus, so bus D is unobservable. So in this 7-bus system
example, 6 buses are observable and 1 bus is not observable. Thus, this system is not a completely observed
system. A completely observed system means all the buses in this system should be directly observed or
indirectly observed with a proper PMU placement scheme.
III. ACO ALGORITHM
ACO, a novel population-based approach was proposed [12] to solve several discrete optimization problems.
An ant is a simple computational agent in the ACO algorithm. It iteratively constructs a solution for the problem
284 | P a g e
Based on the fact that ants are able to find the shortest path to their food using the communication of the
pheromone they produced, this biological phenomenon is widely applied to searching and optimization
problems. The search for PMU locations could also be simulated as the ants searching their food. The following
four steps are proposed in order to utilize the Ant Colony Optimization method to find the optimal PMU
placement.
STEP 1:
Randomly set a number of ants at different buses in a power system network and let these ants perform their
movements. The buses that the ants stopped over represented the candidate PMU locations. In each movement
performed by an ant, it should move three conjoint branches successively and the ant should not visit the same
bus more than once during its completed tour. An ant stops its movement when it reaches a deadlock. The
following Fig.2 simply illustrates a movement by an ant.
12 13 14
6 11 10 9
8
7
Fig.2ant’s movement in a network
As can be observed in Fig.2, the ant moved from bus 7 to bus 13 through line 7-9, line 9-14 and line 14-13. The
purpose that an ant should move three edges during a single movement is to minimize the required number of
PMUs. Assuming in figure 2 that bus 7 and bus 13 are two candidate PMU locations, bus 9 and bus 14 can be
indirectly observed by the couple of PMUs installed at bus 7 and 13 without any duplication. If ant only moves
two branches in a movement, the ant will stop at bus 14 in the above figure and bus 14 will be a candidate PMU
location instead of bus 13. In this condition, bus 9 will be twice-observed by both PMUs at bus 7 and 14. It is
not wise to let two PMUs monitor the same bus in an optimal PMU placement, which explains the reason that
an ant should move three edges in each movement. The following model shows the probability that how an ant
chooses its path at a point of junction.
(3.1)
Where indicates the total amount of pheromone on branch i -j; indicates the setof buses connected to bus
i; shows the probability that the ant will continue its routeon line i -j. The amount of pheromone on each
285 | P a g e
STEP 2:
Algorithm for finding the best tour for the artificial ants has been shown in the flowchart given in Fig.3.
After all ants finish their tours (each tour corresponds to a PMU placement), these tours (PMU placements) are
evaluated by the number of observed buses by the action of these placements. The best tour which gives the
maximum number of observed buses is selected. The branches composing the best tour are increased by a fixed
amount of pheromones. Assume that initially each branch has the same amount of pheromone as one unit.
Fig.3 Flowchart for determining the best tour STEP 3:
Repeat STEP ONE that the ants will perform their movements from their original buses. At this time, the
distribution of the pheromones in the network has been changed due to the fact that pheromone amount on those
For Each Ant
Update pheromone level using the tour observability evaluation for each ant
Yes
Print Best tour Stopping
criteria No
Initialize
Place each ant in a randomly chosen bus
Choose Next bus(by the probability function)
More buses to visit
Return to the initial bus Yes
286 | P a g e
branches composing the best were increased, thus the ants will perform different tours compared to the previous
tours they made.
STEP 4:
Repeat STEP THREE and evaluate the tours. Finally it can be found that the pheromone amount on one tour
will keep increasing compared to other tours. This tour is recommended to define the optimal PMU locations.
IV. SIMULATION RESULTS
The method will be applied to the standard test systems to demonstrate the application of our method. The
simulation results will be shown for the same systems
As case studies, IEEE 9-bus and IEEE 14-bus system are chosen and solved by using the Ant Colony
Optimization technique. Standard IEEE data sets are utilized in the problem
Case Study
For the purpose of representing the optimized tour path and the PMU placement graphically, the IEEE bus
systems have been taken with the assumption of the bus coordinates from the graph system andthe coordinates
taken from the graph are fed to the program, so that the optimized tour path and the buses with PMUs can be
located.
Case 1: IEEE 9-Bus System
Fig.4 Standard IEEE 9-Bus System
When ACO algorithm applied on other optimization problems, it required the shortest path through the nodes,
but here in PMU optimization , it doesn’t required to have shortest path, we have to ensure observability
through checking every third node. Therefore we are not concerned about the length between the nodes here.
And just through assuming the coordinates of the bus system and applied these coordinates as input to our
287 | P a g e
.
0 100 200 300 400 500 600
50 100 150 200 250 300 350 400 450 500 550
Tour Path with most observed buses
unit distance u n it d is ta n c e
Fig.5 Optimized Tour Path for IEEE 9-Bus System
0 100 200 300 400 500
0 50 100 150 200 250 300 350 400 450 500
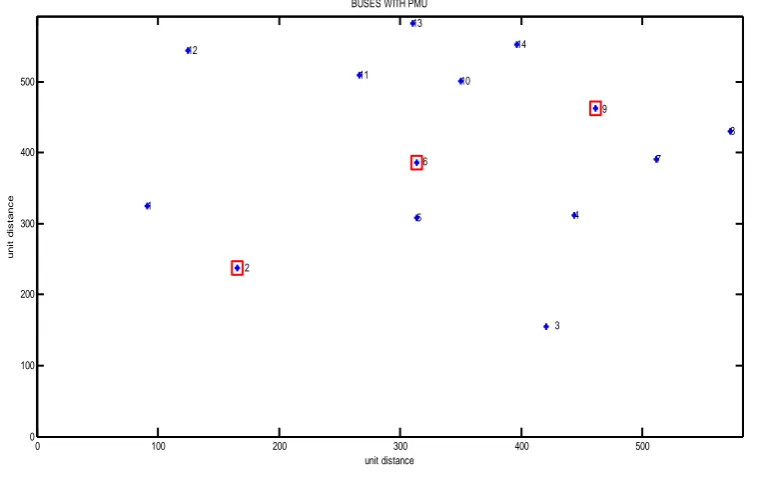
BUSES WITH PMU
1
2 3
4
5 6
7 8 9
unit distance u n it d is ta n c e
Fig.6 Optimized PMU locations for IEEE 9-Bus System
Simulation result has shown in the Fig.6, shows that the optimized locations of the PMUs in the IEEE 9-Bus
288 | P a g e
Case II: IEEE 14-Bus System
12 13 14
6 11 10 9
8
7
4
1 5
2 3
Fig.7 Standard IEEE 14-Bus system
Standard IEEE 14-bus system has been chosen as input to the simulation, and the results have been shown.
Fig.8 shows the optimized path of the artificial ants or the path with most observable buses.
0 100 200 300 400 500 600
0 100 200 300 400 500 600
optimised Tour Path
unit distance
u
n
it
d
is
ta
n
c
e
289 | P a g e
0 100 200 300 400 500
0 100 200 300 400 500
BUSES WITH PMU
1 2 3 4 5 6 7 8 9 10 11 12 13 14 unit distance u n it d is ta n c e
Fig.9 Optimized PMU locations for IEEE 14-Bus System
Simulation result has shown in the Fig.9, shows that the optimized locations of the PMUs in the IEEE 9-Bus
system are bus-2, 6 and 9.
Table 1: Comparison in terms of minimizing the number of PMUs
Table 1 compares the optimized value of number of PMUs obtained by the different algorithms proposed
before, and this can be seen that ACO optimization technique is providing us the best solution.
Methods 9 Bus
system
14 bus
system
Proposed Method
(ACO) 3 3
Genetic Algorithm[4] 3 4
Particle Swarm
Optimization[5] _ 3
Simulated Annealing [8] _ 4
Integer Linear Programing [9]
_ 4
Binary search algorithm
[11] 3 3
290 | P a g e
V. CONCLUSION
This paper objective is optimal PMU placement ensuring system observability. Efficient and reliable WAMS is
crucial to preventing outages and cascading failures in the smart grid. Since PMUs are the critical parts of the
WAMS, the questions of the arrangement and number of PMUs to use and place in order to evaluate risk must
be addressed.
A modified ACO method forOPP problems is suggested. ACO has been compared toPSO, SA and GA and
other methods. The proposed methods were appliedto the OPP problems in 9–Bus, 14-Bus and 30-bus IEEE
standard powersystems to show its effectiveness. The proposedalgorithms were validated by simulation. The
resultsobtained are indicative of the fact that the optimal placement of PMU increases the accuracy of
theobtained estimates and efficiency of the bad datadetection algorithms. Howeverthe ACO’s results are equal
to the results of few more methods. Also this method also has a heavy computational burden.But the
convergence speed in ACO is much better. The computation of this method is fast. Dueto the fact that the ACO
method is a probability-based searching method, it is also enable to guarantee the optimal solution. The result
from this method is always the best global solution.
REFERENCES
[1] J. S. Thorp, A. G. Phadke, and K. J. Karimi, “Real time voltage-phasor measurements for static state
estimation,” IEEE Trans. Power App. Sys., vol. PAS-104, no. 11, pp. 3098–3106, Nov. 1985.
[2] A. G. Phadke, J. S. Thorp, and K. J.Karimi, “State estimation with phasor measurements,” IEEE Trans.
Power Syst., vol. 1, no. 1, pp. 233–241, Feb. 1986.
[3] A. G. Phadke and J. S. Thorp Synchronized Phasor Measurements and Their Applications. New York:
Springer, 2008.
[4] F. J. Marin, F. Garcia-Lagos, G. Joya, and F.Sandoval, “Genetic algorithms for optimal placement of
phasor measurement units in electric networks”, Electron. Lett.vol. 39, no. 19, pp. 1403-1405, Sep.2003
[5] Srivastava I. and Arya A., “An application of particle swarm optimization method for solving network
reconfiguration problem in distribution system”, Int. J. Swarm Intelligence, Inderscience, Vol. 2, Nos.
2/3/4, pp.154–170, 2016.
[6] M.Hajian, A.M.Ranjbar, T.Amraee, and B.Mozafari, “Optimal placement of PMUs to maintain network
observability using a modified BPSO algorithm,” Int. J. Elect. Power Energy Syst., vol. 33, no. 1, pp. 28–
34, Jan. 2011.
[7] R.F.Nuqui and A.G.Phadke, “Phasor measurement unit placement techniques for complete and incomplete
observability,” IEEE Trans.Power Del., vol. 20, no. 4, pp. 2381–2388, Oct. 2005.
[8] T. L. Baldwin, L. Mili, M. B. Boisen, Jr., and R. Adapa, “Powersystem observability with minimal phasor
measurement placement,”IEEE Trans. Power Syst., vol. 8, no. 2, pp. 707–715, May 1993.
[9] B. Xu and A. Abur, “Observability analysis and measurement placementfor systems with PMUs,” in Proc.
IEEE Power Eng. Soc. PowerSystems Conf. Expo., Oct. 2004, pp. 943–946.
[10] F. Aminifar, A. Khodaei, M. Fotuhi-Firuzabad, and M. Shahidehpour,“Contingency-constrained PMU
291 | P a g e
[11] S. Chakrabarti and E. Kyriakides, “Optimal placement of phasor measurement units for power system
observability,” IEEE Trans. PowerSyst., vol. 23, no. 3, pp. 1433–1440, Aug. 2008.
[12] Marco Dorigo and Alberto Colorni, “Ant System: Optimization by a Colony of Cooperation Agents”, IEEE
Transactions on Systems, Man and Cybernetics Part B; Cybernetics,VOL. 26, No. 1, Feb. 1996
[13] M.Dorigo and T. Stützle, “The Ant Colony OptimizationMetaheuristic: Algorithms, Applications, and
Advances”,Handbook of Metaheuristics, 2002.
[14] CaldeiraJ. L., Azevedo R. C., Silva C. A. andSousa J. M. C., “Supply-Chain Managementusing ACO and
Beam-ACO Algorithms”, IEEEConference on Fuzzy Systems, pp. 1-6, 2007.
[15] Wang B., Liu D. and Xiong L., “Advance AC System in Optimizing Power System PMU Placement
Problem”, IEEE Conference on PowerElectronics and Motion Control, pp. 2451-2453, 2009.
[16] J.Peng, Y.Sun and H.F.Wang, “Optimal PMU placement for full network observability using Tabu search