COMPATIBILITY STUDY BETWEEN ISONIAZID AND PHARMACEUTICAL EXCIPIENTS USED IN SOLID DOSAGE FORMS
5
0
0
Full text
(2) Ana Paula Oliveira Vilela Tibola & Leticia Norma Carpentieri Rodrigues. Int. Res. J. Pharm. 2016, 7 (12) cm-1. The FTIR data processing were performed by HYPER IR 1.57 software. To evaluate band shift on the spectrum of the 1:1 (w/w) INH:excipient mixtures, a factored subtraction of each pure component spectrum was performed. Before performing the subtraction, all spectra were normalized at the 2000 region. After acquisition, all data treatment were performed by GRAMS 386 software. RESULTS AND DISCUSSION Isoniazid Studies The thermal stability of isoniazid (INH) was studied using DSC and TG/DTG (Figure 1). The DSC curve of INH showed an endothermic event between 50 to 80°C, related to the dehydration of the material, followed by other endothermic event attributed the melting at 173.13ºC (Tonset = 170.62ºC; DH = 194.90 J/g). The TG/DTG curves of INH presented two mass losses consecutive and kinetically different. The first mass loss, attributed to melting of the substance, was more accented and it occurred in the range of 128.51° and 296.78°C (Dm1 = 79.78%; DTGpeak = 268.40°C); the second mass loss, of lower intensity, occurred between 296.78° and 340.28°C (Dm2 = 14.52%; DTGpeak = 325.70°C); there was no residue detection. The molecular structure of the INH was confirmed by vibrational spectroscopy (FTIR). The FTIR spectra of INH presented bands of medium intensity of absorption at 3302, 3209, 3172 and 3113 cm-1 which were attributed to the stretching vibration of the C(sp2)-H connections of the aromatic ring. The bands at 1556 and 1602 cm-1 were related to C=C asymmetrical and symmetrical stretching of the molecule aromatic ring, while the bands at 746 and 675 cm-1 were attributed to the C-H flexions out of the ring plane. The band of strong intensity at 1667 cm-1 was related to the stretching vibration of carboxyl azide; the band at 1636 cm-1 was attributed to the NH2 collection deformation of hydrazide (CONHNH2) and the band at 1337 cm-1 was related to stretching vibration in the C-N connection. The bands at 1493, 1412 and 1222 cm-1 was attributed to C-CH vibration in the ring plane. The band at 1142 cm-1 was related to the vibrations of N-N, which occurred out of the flexion in the molecule aromatic ring. The band at 996 cm-1 was attributed to deformation of the ring plane – and the C-H vibration out of the flexible ring plane was related to the band at the position 888 cm-1. The band at 845 cm-1 was attributed to the NH2 collection of the infrared spectrum. The band at 660 cm-1 was related to the vibration of NH out of the ring and at 504 cm1 to the CO flexion in the ring plane. The spectral data observed in the FTIR spectra were consistent with other authors.5,6 Compatibility studies between isoniazid and excipients Thermal Analysis Assays In the physical mixtures, when there is no any interaction between drug and excipient, the Tonset and Tpeak value (DSC curve), and the decomposition of drug (TG/DTG curves) remain practically unchanged, similarly when the drug is alone. In this case, the thermal profiles of the physical mixture can be considered as a superposition of the curves of drug and excipients. The changes in the profile of thermoanalytical curves (DSC and TG/DTG) of the physical mixtures can indicate the production of some interaction. The possible interactions between components can be deduced from shift or disappearance of the DSC peaks, especially the melting peak and/or variations in enthalpy values. Modifications in the peak shape, peak onset or peak maximum temperature may be an indication an interaction, but it is necessary to bear in mind that some broadening of peaks can be resulting of the missing. process, which lowers the purity of each component in the mixture. The thermal curves of physical mixtures between INH and excipients – SSG, MS and talc – may be considered as a superposition of the curves of the isolated compounds, evidencing the absence of the incompatibility between them (Figure 2, Table 1). Displacement of the thermal event of melting and/or decomposition of INH was observed in the physical mixtures with the excipients – HPMC, CSD, MCC, CCS, Eudragit L100, starch and PVP - suggesting some interaction. Lactose and sodium metabisulfite (SMB) were found to exhibit interactions with isoniazid. The DSC curve of the lactose (Figure 3) showed an endothermal event corresponding to the dehydration of the material (bound water) between 140-165°C; an exothermic event due the crystalline transition of a form to b form (Tpeak = 172.80°C); an endothermic event due the melting at 183.7°C; and thermal decomposition characterized by several endothermic events. The TG/DTG curves of lactose showed thermal decomposition in four steps: the first step between 55.65 and 183.73°C (Dm1 = 3.32%; DTGpeak = 153.73°C) due to the crystallization of water; the second and third steps, related to the thermal decomposition, were consecutive and occured between 199.38 and 280.51°C (Dm2 = 12.76%; DTGpeak = 256.93°C) and 280.51 and 399.33°C (Dm3 = 58.35%; DTGpeak = 321.52°C); the fourth and last step, relative to carbonization of the excipient, started at 400°C. The DSC curve of the 1:1 (w/w) lactose:INH physical mixture showed an endothermic event between 122°C and 145.5°C, a temperature range in which no thermal events occurred to both isolated substances. The TG/DTG curves of the 1:1(w/w) lactose:INH physical mixture showed decomposition in four steps. The thermal events related to the melting and decomposition of the INH were moved to lower temperatures, showing some type of reaction between the INH and the lactose. This interaction may be attributed to a Maillard-type reaction, a well-known reaction that occurs between a reducing sugar, e.g., lactose and primary or secondary amine. Since isoniazid have a primary amine group bound to a secondary nitrogen of the acetamide group, it is likely that this drug could undergo Maillard-type reactions under optimal conditions. In studies conducted by Lavor et al.15 the onset temperature of the first decomposition step of the mixture on the TG/DTG curves decreased 30ºC compared to that of pure INH, suggesting strong interaction between INH and LAC. The incompatibility between isoniazid and lactose was confirmed by differential scanning calorimetry (DSC) and high performance liquid chromatography.16 Sodium metabisulfite (SMB) (Figure 4) was thermodynamically stable until a temperature of 180°C, undergoing an endothermic event between 185 and 228°C related to the thermal decomposition of the material. The DSC curve of the 1:1 (w/w) SMB:INH physical mixture showed an endothermic event at 167°C, linked to the melting of INH, followed by an exothermic event at 175°C, referring to the decomposition of the material, and finally an endothermic event at 184.4ºC, attributed to the vaporization of the residue. The overlapping curves of INH, SMB and the 1:1 (w/w) SMB:INH physical mixture showed that the thermal events shift to lower temperatures, suggesting interaction between sodium metabisulfite and INH. The TG/DTG curves of sodium metabisulfite and the 1:1 (w/w) SMB:INH physical mixture showed thermal decomposition in several consecutive steps suggesting instability of the mixture (Table 1).. 19.
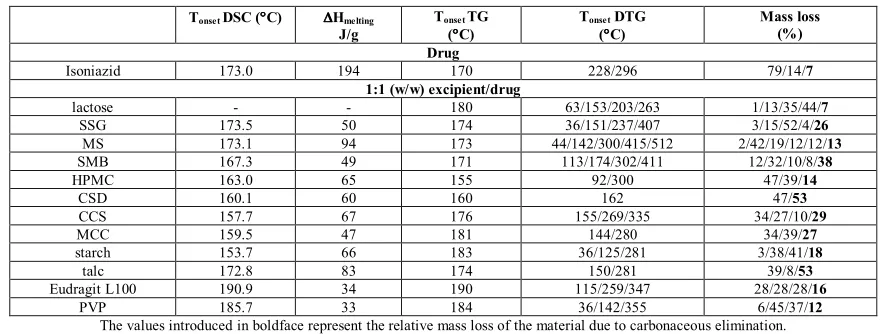
(3) Ana Paula Oliveira Vilela Tibola & Leticia Norma Carpentieri Rodrigues. Int. Res. J. Pharm. 2016, 7 (12) The FTIR spectroscopic analysis using the differential technique is a powerful and sensitive technique to detect interactions between components of a mixture. The residual bands in the differential spectrum can be associated with clusters of atoms of each molecule involved, thus allowing better understanding of the process and the interactions between substances. To confirm the results obtained by thermal analysis, the FTIR spectroscopy was used as a supplementary technique in order to investigate the chemical interactions. Vibrational Spectroscopy Assays The FTIR spectra of INH, excipients and 1:1 (w/w) INH:excipients physical mixtures were recorded and analyzed by scaled subtraction to investigate the possible interaction between drug and excipients. In the scaled subtraction analysis, the final differential spectrum is obtained by means of successive subtraction of each spectra of each of the separate components - INH and excipient - of the physical mixture spectrum. If any interaction takes place, a change in the electron density occurs, causing displacement of absorption bands in the infrared spectrum. In this case, a residual band will be present in the differential spectrum. On the other hand, if no interaction occurs, the spectra bands of the mixture and the correspondent bands of the pure substances will be equivalent and compensated by the subtractions, causing no significant interferences or bands in the resulting differential spectrum.. frequency of several bands, suggesting chemical interactions between these compounds. Residues of the excipient and INH bands were visualized in the region of 3111 and 3000 cm-1. According to Yilmaz, Bolukbasi and Bakiler6, INH presents four bands in the region 3304, 3209, 3171 and 3113 cm-1 corresponding to the stretching vibrations of N-H. The alterations observed in this region could be attributed to the Maillard reaction, where the lactose interacts with primary and secondary amines. Bands in the region of 1557 and 1668 cm-1 also were not extinguished confirming that the lactose interferes in the INH (Table 2). The FTIR differential spectrum resulting from the subtraction of sodium metabisulfite (SMB) and INH spectra from the physical mixture showed remaining bands of both - SMB and INH indicating a strong interaction between these molecules. The band observed at 3304 cm-1 was related to NH stretching; the bands at 3113 and 3051 cm-1 were attributed to CH stretching of the INH molecule. The bands remaining at 1668, 1557, 1142 and 1222 cm-1 were related to CO stretching, NN out of the plane and vibrations of the CCH aromatic ring, respectively. These results are in agreement with results previously observed by Araújo et al.11 (Table 2). The FTIR differential spectrum resulting from the subtraction of INH and other excipients from their respective physical mixtures showed no remaining band confirming the absence of interactions between INH and these excipients.. The differential spectrum resulting from subtraction of lactose and INH from the physical mixture showed dislocation in the Table 1: Thermal data from DSC and TG/DTG of INH and 1:1 (w/w) excipients:INH physical mixtures Tonset DSC (°°C). DHmelting J/g. Tonset TG Tonset DTG Mass loss (%) (°°C) (°°C) Drug 173.0 194 170 228/296 79/14/7 Isoniazid 1:1 (w/w) excipient/drug lactose 180 63/153/203/263 1/13/35/44/7 173.5 50 174 36/151/237/407 3/15/52/4/26 SSG MS 173.1 94 173 44/142/300/415/512 2/42/19/12/12/13 167.3 49 171 113/174/302/411 12/32/10/8/38 SMB HPMC 163.0 65 155 92/300 47/39/14 CSD 160.1 60 160 162 47/53 157.7 67 176 155/269/335 34/27/10/29 CCS 159.5 47 181 144/280 34/39/27 MCC starch 153.7 66 183 36/125/281 3/38/41/18 172.8 83 174 150/281 39/8/53 talc Eudragit L100 190.9 34 190 115/259/347 28/28/28/16 185.7 33 184 36/142/355 6/45/37/12 PVP The values introduced in boldface represent the relative mass loss of the material due to carbonaceous elimination. Table 2: Results of interactions between isoniazid (INH) and excipients using FTIR 1:1 (w/w) excipient:Drug. Excipient Several chemical structures. O N. NH - NH2. INH structure Observed interaction (spectra bands shifting) Drug groups Excipient groups lactose:INH n NH; n CO; n C=Cring 3304, 3209, 3171 and 3113; 1668; 1557 SMB:INH 1186, 983 and 632 n NH; n CH; n CO; NH2 scis; gN-N; dC=CHring; n C=Cring 3304; 3113 and 3051; 1668; 1636; 1142; 1222; 1557 n, stretching; d, in plane ring bending; g, out of plane ring bending vibrations; scis, scissoring vibrations. 20.
(4) Ana Paula Oliveira Vilela Tibola & Leticia Norma Carpentieri Rodrigues. Int. Res. J. Pharm. 2016, 7 (12). DrTGA mg/min. DSC mW. TGA mg 5.00. DSC TG DTG. 2.00 0.00. DSC mW. INH lactose SSG MS SMB HPMC CSD CCS MCC starch talc Eudragit PVP. 4.00. 0.00. 3.00. -10.00. 2.00. -2.00 -20.00. 1.00. -4.00 -0.00 100.00. 200.00. 300.00 400.00 Temp [C]. 500.00. 50.00. 600.00. DSC mW. 100.00. 125.00. 150.00 175.00 Temp [C]. 200.00. 225.00. 250.00. 275.00. Figure 2: DSC curve of INH and 1:1 (w/w) excipient:INH physical mixtures. Figure 1: DSC and TG/DTG curves of INH. DrTGA mg/min. 75.00. TGA mg. DrTGA mg/min. DSC mW. TGA mg. DSC INH. DSC INH. DSC. DSC. - - - - lactose. - - - - SMB. DrTG TG. DrTG TG. DSC. DSC. . . . . 1:1 lactose:INH PM. . . . . 1:1 SMB:INH PM. DrTG. DrTG TG -0.00. 100.00. 200.00. 300.00 Temp [C]. 400.00. 500.00. TG 600.00. Figure 3: DSC curve of INH, DSC and TG/DTG curves of lactose and 1:1 (w/w) lactose:INH physical mixture. 100.00. 200.00. 300.00 Temp [C]. 400.00. 500.00. 600.00. Figure 4: DSC curve of INH, DSC and TG/DTG curves of SMB and 1:1 (w/w) SMB:INH physical mixture. CONCLUSION. REFERENCES. In the present study, results of thermal analysis and FTIR were successfully employed to assess the compatibility of INH with excipients commonly used in the development of solid dosage forms. Modifications in the peak shape, peak onset or peak maximum were verified using thermal analysis, especially DSC, for the most of the physical mixtures. However, FTIR analysis showed good correlation between 1:1 (w/w) excipients:INH spectra except for lactose:INH and SMB:INH physical mixture, evidencing high incompatibility between these two species and INH. The results obtained with thermal analysis and FTIR spectroscopy were comparable. In conclusion, the application of thermal analysis in the study of drugs in the solid state is of great interest in the preformulation studies in the selection of excipients and confirms that this technique is a powerful tool in pharmaceutical technology by the method sensitivity and fast response, allowing the identification of incompatibilities in a short period. Whenever possible, other techniques such as IR and quantitative analysis should be used in conjunction with thermal analysis to reach any definitive conclusion.. 1. World Health Organization, Global tuberculosis report Available from: (WHO 2016). http://www.who.int/tb/publications/global_report/en/. 2. Neelam R, Subhas S, Gupta VRM, Devanna N, Pati Nikunja B. A Review on New Approaches and Current Therapies Involved in the Treatment and Prophilaxis of Tuberculosis. Int Res J Pharm. 2012; 3(12): 46-50. 3. Saeed S, Hasan S. Tuberculosis: a public health challenge: Brief overwie of literature. Int Res J Pharm. 2016; 7(1): 1-4. 4. Rodrigues FAR, Oliveira, ACA, Cavalcanti BC, Pessoa B, De Souza, MVN. Biological Evaluation of Pinheiro AC, Isoniazid Derivatives as an Anticancer Class. Sci Pharm. 2014; 82:21-28. 5. Akalin E, Akyuz S. Vibrational structure of free and hydrogen bonded complexes of isoniazid: FT-IR, FT-Raman and DFT study. J Mol Struc. 2007; 834-836:492-497. 6. Yilmaz A, Bolukbasi O, Bakiler M. An experimental and theoretical vibrational spectra of isoniazide. J Mol Struc. 2008; 872(2-3):182-189. 7. Bhutani H, Singh S, Vir S, Bhutani KK, Kumar R, Chakraborti AK, et al. LC and LC-MS study of stress decomposition behaviour of isoniazid and establishment of validated stability-indicating assay method. J Pharmaceut Biomed. 2007; 43(4):1213-1220. 8. Carlin A, Gregory N, Simmons J. Stability of isoniazid in isoniazid syrup: formation of hydrazine. J Pharmaceut Biomed. 1998; 17(4-5):885-890. 9. Lin SY, Wang SL. Advances in simultaneous DSC–FTIR microspectroscopy for rapid solid-state chemical stability. ACKNOWLEDGEMENTS We would like to thank to the CNPq for the financial support and Farmanguinhos/Fiocruz (Rio de Janeiro, Brazil) for providing isoniazid. We would like to thank Marco Aurélio da Silva Carvalho Filho Ph.D. and Paulo Roberto Janissek Ph.D. of the Universidade Positivo (Curitiba, Paraná, Brazil) for the equipment, because without them the realization of this work would not be possible.. 21.
(5) Ana Paula Oliveira Vilela Tibola & Leticia Norma Carpentieri Rodrigues. Int. Res. J. Pharm. 2016, 7 (12) studies: Some dipeptide drugs as examples Adv Drug Deliver Rev. 2012; 64(5):461-478. 10. Giron D. Applications of Thermal Analysis and Coupled Techniques in Pharmaceutical Industry. J Therm Anal Calorim. 2002; 68(2):335-357. 11. Araújo AAS, Storpirtis S, Mercuri LP, Carvalho FMS, Filho MACS, Matos JR. Thermal analysis of the antiretroviral zidovudine (AZT) and evaluation of the compatibility with excipients used in solid dosage forms. Int J Pharm. 2003; 260(2):303-314. 12. Bracconi P, Andrès C, Ndiaye A. Structural properties of magnesium stearate pseudopolymorphs: effect of temperature. Int J Pharm. 2003; 262(1-2):109-124. 13. Pezzini BR, Silva MAS, Ferraz HG. Sustained release solid oral dosage forms: single-unity or multiple-unity systems. Braz J Pharm Sci. 2007; 43(4):491-501. 14. Kalinkova G. Infrared spectroscopy in pharmacy. Vib Spectrosc. 1999; 19(2):307-320.. 15. Lavor EP, Navarro MVM, Freire FD, Aragão CFS, Raffin FN, Barbosa EG, et al. Application of thermal analysis to the study of antituberculosis drugs–excipient compatibility. J Therm Anal Calorim. 2014; 115(3):2303-2309. 16. Wu WH, Chin TF, Lach JL. Interaction of Isoniazid with Magnesium Oxide and Lactose. J Pharm Sci. 1970; 59(9):12341242. 17. Chadha R, Bhandari S. Drug–excipient compatibility screening—role of thermoanalytical and spectroscopic techniques. J Pharmaceut Biomed. 2014; 87:82-97. Cite this article as: Ana Paula Oliveira Vilela Tibola, Leticia Norma Carpentieri Rodrigues. Compatibility study between isoniazid and pharmaceutical excipients used in solid dosage forms. Int. Res. J. Pharm. 2016;7(12):18-22 http://dx.doi.org/10.7897/22308407.0712140. Source of support: CNPq, Conflict of interest: None Declared Disclaimer: IRJP is solely owned by Moksha Publishing House - A non-profit publishing house, dedicated to publish quality research, while every effort has been taken to verify the accuracy of the content published in our Journal. IRJP cannot accept any responsibility or liability for the site content and articles published. The views expressed in articles by our contributing authors are not necessarily those of IRJP editor or editorial board members.. 22.
(6)
Figure

Related documents
FIG 1 The postbiotic concept. Under homeostatic conditions, the intestinal microbiota produce, modify, and degrade small molecules, collectively termed metabolites, which serve as
In any event, notwithstanding whatever good reasons that may have caused the Patent Office to decide to have a regulation in favor of broadest reasonable interpretation
In this study, the assessed compatibility of selected mucolytic drugs (ambroxol, bromhexine, acetylcysteine) with excipients (magnesium stearate, lactose monohydrate, starch)
This figure shows that the circuit response is complete changed due to the presence of parametric faults in the circuit .Second filter leapfrog filter is simulated with the help
Morbidity, mortality, and case fatality rate (CFR) due to HS disease in the different animal population (cattle and buffalo), age groups (young and adult), various areas
To obtain strong convergence in the setting of an infinite dimensional Hilbert or Banach spaces, there exist several iterative algorithms to nonexpansive mappings (e.g.,
Apart from cross-protection between variants of the same HA subtype, cross-protection between viruses of different HA subtypes (heterosubtypic protection) has also been
