Research Article
Identification of traits for the
improvement of grain yield in bread
wheat under nitrogen stress and
non-stress conditions
Fahim Ullah Khan
1*, Fida Mohammad
2, Manzoor Ahmad
3,
Muhammad Adil
1, Naveed ur Rehman
1and Arshad Iqbal
21. Department of Agriculture, Hazara University Mansehra-Pakistan
2. Department of Plant Breeding and Genetics, The University of Agriculture, Peshawar-Pakistan 3. Department of Agronomy, Bacha Khan University Charsadda-Pakistan
*Corresponding author’s email:fahimbiotech@hu.edu.pk
Citation
Fahim Ullah Khan, Fida Mohammad, Manzoor Ahmad, Muhammad Adil, Naveed ur Rehman and Arshad Iqbal. Identification of traits for the improvement of grain yield in bread wheat under nitrogen stress and non-stress conditions. Pure and Applied Biology. Vol. 8, Issue 1, pp698-705. http://dx.doi.org/10.19045/bspab.2019.80011
Received: 19/11/2018 Revised: 11/01/2019 Accepted: 14/01/2019 Online First: 21/01/2019
Abstract
Correlation, path coefficient and step-wise regression analyses were used to identify important traits that affect grain yield in bread wheat. Thirty bread wheat varieties were field tested under with (N+) and without nitrogen (N0) conditions at New Developmental Research Farm, The University of Agriculture, Peshawar-Pakistan. Experimental materials were planted in randomized complete block (RCB) design with three replications. Correlation analysis revealed significant positive association of grain yield with number of spikes m-2, biological yield and harvest index under both production systems. For the 1000-grain weight, positive association was observed under N+ condition only. Furthermore, path coefficient analysis confirmed the true relationship of harvest index, biological yield, number of spikes m-2, and 1000-grain weight with grain yield in wheat. Similarly, step-wise regression analysis identified spikes m-2, grains spike-1, 1000-grain weight, harvest index and biological yield as important traits affecting grain yield in wheat under respective production system. Overall, on the basis of current statistical procedures spikes m-2, grains spike-1, 1000 grain weight, harvest index and biological yield needs due weightage in breeding program for further improvement in grain yield of bread wheat.
Keywords: Biological Yield; Correlation; Path analysis; Step-wise regression
Introduction
Grain yield is a complex trait and is highly influenced by many genetic factors and environmental fluctuations. In plant breeding program, direct selection for yield as such could be misleading. A successful selection depends upon the information on the genetic variability and association of morphological and agronomic traits with grain yield reported by Kalimullah et al. [1]. Likewise, Khan et al. [2] explained that correlation analysis
therefore used to orient breeding programs.
Disregarding interrelationship between traits, decision made solely on correlation may not be effective because it provide limited information. But yet, information obtained through correlation can be enhanced by partitioning them into direct and indirect effects. Path coefficient analysis helps the breeder to estimate direct and indirect contribution of related traits towards economic yield [3]. Recently, Ebrahimnejad and Rameeh [4]
reported that GY was significant correlated with biological, spike weight, grain weight spike-1, grains spike-1, stem straw weight,
spike straw weight. Likewise, Zare et al.
[5] found harvest index an important yield component affecting grain yield under drought stress conditions. The present experiment was thus designed to identify traits which influence grain yield under with (N+) and without (N0) nitrogen
condition that could be used as selection criterion.
Materials and methods
The present study was undertaken at New Developmental Research Farm, The University of Agriculture Peshawar, Pakistan. Experimental material comprising of thirty wheat genotypes were evaluated under nitrogen stress (N0) and non-stress (N+) conditions (Table 1).
Experimental materials were planted in randomized complete block design with three replications under each level of nitrogen. Nitrogen stress and non-stress conditions were achieved by applying recommended nitrogen level (120 kg ha-1) to the non-stress plots while leaving the nitrogen stress plots without nitrogen supplements. Seed rate for each variety was 100 kg ha-1. Sowing was done on 12th
November, 2013 and was managed uniformly throughout the growing season using recommended cultural practices. At harvest, data was recorded on days to maturity (DM), grain filling duration (GFD), flag leaf area (FLA), plant height (PH), number of spike m-2 (SPK), grain
spike-1(GSPK), 1000-grain weight (TGW), biological yield (BY), harvest index (HI) and grain yield (GY).
Statistical analyses Correlation analysis
Correlation among various yield traits were computed under both N+ and N0 conditions using computer software SPSS ver.20.
Path coefficient analysis
Path coefficient analysis was performed following the procedure of Khan et al. [2]. Grain yield under both N+ and N0 was kept
as dependent variable and rest of the traits as independent variables.
Step-wise regression analysis
Step-wise regression analysis was done using statistical software SPSS ver. 20. Grain yield was kept as dependent variable while all other variables/traits were kept as independent variables.
Results and discussions Correlation analysis
Table 2 shows correlation among yield components under with nitrogen and without nitrogen conditions. Correlation analysis showed that grain yield under both N+ and N0 conditions had strong positive association with number of spikes m-2(r = 0.86** and 0.77**), biological
weight (r = 0.35*) and 1000 grain weight with biological yield (r = 0.36*) under N+ production system. Flag leaf area had significant positive and negative association with 1000 grain weight (r = 0.40*) and number of spikes m-2 (r =
-0.52*) respectively, whereas biological yield showed positive correlation with days to maturity (r = 0.34*) under N0 condition only (Table 2).
Strong relationship of grain yield plant-1 with tillers plant-1, spikelet’s spike-1, grains spike-1, 1000-grain weight and
harvest index was earlier reported by Abd El-Mohsen [3]. Likewise, Abderrahmane et al. [6] reported that grains spike-1, grain
weight spike-1, 1000 grain weight and test weight were positively correlated with grain yield except plant height. Yield components affecting grain yield in wheat were reported in biological yield, straw yield, spikes plant-1 and grains spike-1 [7]. Similarly, significant positive association of grain yield with plant height, grains spike-1, grain weight spike-1 and 1000 kernels weight, whereas, significant negative relationship with days to heading
[1]. Furthermore, grain yield had strong positive association with spikelet’s plant-1,
tillers plant-1 and 1000-grain weight, while
significant negative relationship with seeds spikelet-1[7]. Major contributing traits to grain yield in wheat were tillers plant-1, spikes square meter-1, grains spike
-1, biological yieldplant-1, harvest index
and 1000 kernel weight [8]. Path coefficient analysis
Correlation coefficient usually did not give clear picture of relationship between dependent and independent variables. Therefore, path coefficient analysis was performed to estimate cause and affect relationship among subject variables (Table 3). Grain yield under both N+ and N0 conditions was kept as dependable variable while rest of the traits as independent variable under both production system. Genetic correlation of yield attributes was partitioned into direct and indirect effects on subject variable i.e.
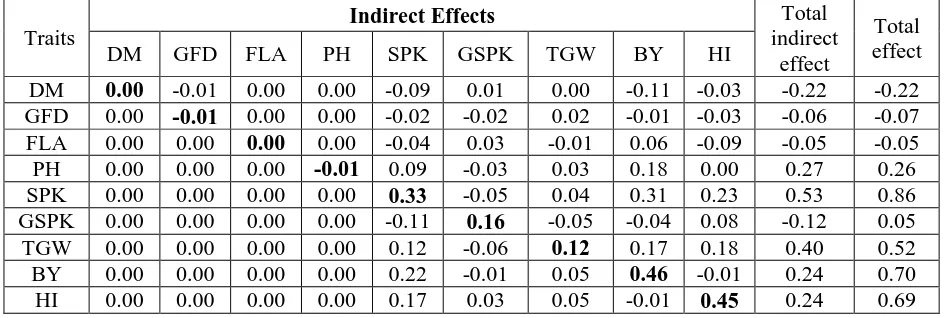
grain yield. Path analysis showed that biological yield (0.46***) had the highest positive direct effect on grain yield, followed by harvest index (0.45), number of spikes m-2(0.33), grains spike-1 (0.16) and 1000 grain weight (0.12) on grain yield under N+ condition. In addition, maximum positive indirect contribution via other traits on grain yield was observed highest in number of spikes m-2 (0.53), followed by 1000 grain weight (0.40), plant height (0.27), biological yield and harvest index (0.24 each) under N+
condition (Table 3).
Positive genetic correlation and direct effect of harvest index, biological yield, number of spikes m-2, and 1000-grain weight indicated the true relationship of these traits on grain yield and could be used as direct selection criteria for improvement in wheat grain yield. Positive indirect contribution of plant height via biological yield (0.18), number of spikes m-2 and 1000 grain weight via biological yield (0.31 and 0.17) and harvest index (0.23 and 0.18), whereas biological yield and harvest index via number of spikes m-2 (0.22 and 0.17) could be used as indirect selection criteria under N+ conditions. The direct, indirect and total effects on grain yield of 30 wheat genotypes under nitrogen stress condition is provided in (Table 4). Under N+ condition, maximum
positive direct contribution was observed in biological yield and harvest index (0.70). Furthermore, maximum indirect effects was observed in number of spikes m-2 (0.75) anddays to maturity (0.12) through other traits on grain yield. In contrast, flag leaf area (-0.30) depicted maximum negative indirect effects via other traits on grain yield (Table 4).
other traits reflects the failure of correlation analysis. Low direct effect and high indirect contribution of days to maturity via other traits suggested that this trait could be used as indirect selection criterion. In contrast, low direct and negative indirect effect of grain filling duration, plant height, grains spike-1 and 1000 grain weight on grain yield suggest that this trait should be ignored in devising selection criteria. Positive indirect effect of number of spikes m-2 via biological yield could be used as indirect variables for improvement in grain yield under N0 condition. The present findings support previous investigation that maximum direct effect on grain yield were noticed by biomass, harvest index, days to flowering and plant height [8]. Previously, Abderrahmane et al. [6] reported that grain spike-1, 1000-grain weight, plant height and test weight had significantdirect effect on grain yield. Likewise, Mollasadeghi et al. [10] found plant height, grains spike-1 and 1000-grain weight as the most influencing traits in wheat using path analysis. Maximum positive direct effect of plant height and grain weight spike-1 on grain yield was noticed by Kalimullah[1]. Biological yield could be used as suitable criterion in the wheat breeding programs and production of productive varieties. Tillers plant-1, grains spike-1, 1000-grain
weight and harvest index were noted to have direct influence on grain yield plant-1
[11]. Likewise, Efyoni and Mahloji [12]
exhibited that strong positive direct of harvest index on grain yield. In contrast, Gelalcha and Hanchinal [9] reported significant negative direct effect of tillers plant-1 on grain yield in wheat.
Step wise linear regression
Step wise regression analyses under N+ and N0 conditions are presented in (Table 5 & 6) respectively. Step wise regression analysis included three and two traits in the final model while excluded six and seven characters out of nine input independent variables under N+ and N0 condition, respectively. Step wise
regression analysis model kept spikes m-2, grain spike-1 and 1000 grain weight under N+, while harvest index and biological
yield under N0 exhibiting the importance of these traits under respective condition. The coefficient of determination (R2)
under N+ and N0 environments were 98.1% and 99.1%, respectively. Therefore, based on step-wise regression analysis the following equation were obtained:
Grain yield(N+)=5.23 + 0.88spikes m-2+ 0.48 grains spike-1 + 0.40 1000 grain weight
Grain yield (N0)=6.87 + 0.71harvest index+ 0.78 biological yield
Significant R2 represent the fitness of the
model, indicating that variable included in the model have a real contribution to grain yield. Frequency of each trait identified as important by each statistical technique were summed in (Table 7). Spikes m-2, grains spike-1, 1000-grain weight, biological yield and harvest index were found important in adding contribution to grain yield in wheat (Table 7).
The results obtained in the current experiment are in line with Dogan [7], who identified tillers plant-1, harvest index, grains spike-1 and 1000-grain weight as the most important characteristics affecting grain yield in wheat using step wise regression analysis. Similarly, Fellahi et al. [13] applied step wise regression procedure in wheat and concluded that regression model excluded all other variables except grains spike-1, tillers m
-2and plant height. Soleymanfard et al. [14]
showed that spikes plant-1, grains spike-1, 1000-grain weight and days to heading with R2 = 97.4%, had justified the
maximum of yield changes. Previously, Shamsi et al. [15] applied step-wise regression analysis resulting in tillers m-2,
Table 1. List of wheat varieties evaluated.
Genotype Varieties Breeding Centre
1 Pak-81 CCRI, Pirsabak
2 Pirsabak-85 CCRI, Pirsabak
3 Khyber-87 CCRI, Pirsabak
4 Inqilab-91 WRI, AARI, Faisalabad
5 Watan-93 WRI, AARI, Faisalabad
6 Nowshehra-96 CCRI, Pirsabak
7 Sulaiman-96 CCRI, Pirsabak
8 Tatara-96 NIFA, Peshawar
9 Ghaznavi-98 AUP, Peshawar
10 KT-2000 BARS, Kohat
11 Saleem-2000 CCRI, Pirsabak
12 Pirsabak-04 CCRI, Pirsabak
13 Pirsabak-05 CCRI, Pirsabak
14 Seher-06 WRI, AARI, Faisalabad
15 Bathoor-08 NIFA Peshawar
16 Faisalabad-08 WRI, AARI, Faisalabad
17 Hashim-08 ARI, D.I. Khan
18 Pirsabak-08 CCRI, Pirsabak
19 Janbaz-09 AUP, Peshawar
20 Amin-10 ARS, S. NaurangBannu
21 Atta-Habib-10 AUP, Peshawar
22 Barsat-10 NIFA, Peshawar
23 Siran-10 AUP, Peshawar
24 Aas-11 RARI, Bahawalpur
25 ARRI-11 RARI, Bahawalpur
26 Dharabi-11 BARI, Chakwal
27 NARC-11 NARC, Islamabad
28 Punjab-11 WRI, AARI, Faisalabad
29 Pirsabak-13 CCRI, Pirsabak
30 Shahkar-13 CCRI, Pirsabak
Table 2. Correlation among yield components under with nitrogen (above diagonal) and without nitrogen (below diagonal) conditions of 30 wheat genotypes
Traits DM GFD FLA PH SPK GSPK TGW BY HI GY
DM 1 0.72** 0.11 0.04 -0.26 0.07 0.03 -0.24 -0.07 -0.22 GFD 0.78** 1 0.22 0.05 -0.06 -0.11 0.15 -0.02 -0.08 -0.07 FLA -0.17 -0.15 1 0.18 -0.13 0.18 -0.06 0.13 -0.20 -0.05 PH -0.09 -0.09 0.32 1 0.28 -0.17 0.27 0.38* 0.00 0.26 SPK 0.16 0.09 -0.52** 0.03 1 -0.33 0.35* 0.67** 0.51** 0.86** GSPK -0.20 -0.30 0.11 0.04 -0.20 1 -0.37* -0.09 0.17 0.05 TGW -0.01 0.14 0.40* 0.03 -0.15 -0.60** 1 0.36* 0.40 0.52** BY -0.17 -0.07 -0.22 -0.07 0.59** -0.01 0.05 1 -0.02 0.70** HI 0.34* 0.20 -0.19 0.10 0.44* 0.09 0.00 -0.11 1 0.69** GY 0.09 0.07 -0.30 0.03 0.77** 0.08 0.02 0.71** 0.62** 1 DM= Days to maturity, GFD = Days to grain filling, FLA= Flag leaf area, PH= Plant height, SPK= Spikes m-2,
GSPK= Grains spike-1, TGW= 1000 grain weight, BY= Biological yield, HI= Harvest index, GY= Grain yield
Table 3. Path analysis showing direct (diagonal bold values), indirect and total effects under with nitrogen condition
Traits
Indirect Effects Total
indirect effect
Total effect
DM GFD FLA PH SPK GSPK TGW BY HI
DM 0.00 -0.01 0.00 0.00 -0.09 0.01 0.00 -0.11 -0.03 -0.22 -0.22 GFD 0.00 -0.01 0.00 0.00 -0.02 -0.02 0.02 -0.01 -0.03 -0.06 -0.07 FLA 0.00 0.00 0.00 0.00 -0.04 0.03 -0.01 0.06 -0.09 -0.05 -0.05 PH 0.00 0.00 0.00 -0.01 0.09 -0.03 0.03 0.18 0.00 0.27 0.26 SPK 0.00 0.00 0.00 0.00 0.33 -0.05 0.04 0.31 0.23 0.53 0.86 GSPK 0.00 0.00 0.00 0.00 -0.11 0.16 -0.05 -0.04 0.08 -0.12 0.05 TGW 0.00 0.00 0.00 0.00 0.12 -0.06 0.12 0.17 0.18 0.40 0.52 BY 0.00 0.00 0.00 0.00 0.22 -0.01 0.05 0.46 -0.01 0.24 0.70 HI 0.00 0.00 0.00 0.00 0.17 0.03 0.05 -0.01 0.45 0.24 0.69
Table 4. Path analysis showing direct (diagonal bold values), indirect and total effects on grain yield of 30 wheat genotypes under without nitrogen condition
Traits
Indirect Effects Total
indirect effect
Total effect
DM GF
D FLA PH SPK GSPK TGW BY HI
DM -0.03 0.01 0.00 0.00 0.00 -0.01 0.00 -0.13 0.24 0.12 0.09 GFD -0.02 0.01 0.00 0.00 0.00 -0.01 0.00 -0.05 0.14 0.06 0.07 FLA 0.00 0.00 0.00 0.00 -0.01 0.00 0.00 -0.17 -0.13 -0.30 -0.30
PH 0.00 0.00 0.00 0.01 0.00 0.00 0.00 -0.05 0.07 0.02 0.03 SPK 0.00 0.00 0.00 0.00 0.02 -0.01 0.00 0.45 0.30 0.75 0.77 GSPK 0.01 0.00 0.00 0.00 0.00 0.03 0.00 -0.01 0.06 0.05 0.08 TGW 0.00 0.00 0.00 0.00 0.00 -0.02 0.00 0.04 0.00 0.02 0.02 BY 0.00 0.00 0.00 0.00 0.01 0.00 0.00 0.77 -0.08 -0.06 0.70 HI -0.01 0.00 0.00 0.00 0.01 0.00 0.00 -0.08 0.70 -0.08 0.62
Table 5. Step wise regression analysis showing relative contribution (Partial R2), regression coefficient (b), standard error (SE), t-value and variance inflation factor (VIF) under non-stress condition
Traits b SE t-value VIF
Number of spikes m-2 0.88 0.93 29.35 1.20
Grains spike-1 0.48 3.03 15.91 1.22
1000-grain weight 0.40 6.19 13.11 1.25
Constant = 5.23 Coefficient of determination (R2) = 0.981, Adjusted R2 = 0.978
Table 6. Step wise regression analysis showing relative contribution (Partial R2), regression coefficient (b), standard error (SE), t-value and variance inflation factor (VIF) under stress condition
Traits b SE t-value VIF
Harvest index 0.71 0.68 39.31 1.01
Biological yield 0.78 0.01 43.50 1.01
Table 7. Comparison of statistical techniques for identifying traits to be used as selection criterion for improvement of grain yield in bread wheat under nitrogen stress and non-stress conditions.
Traits Environment
Statistical Techniques
Correlation Path analysis Step wise
regression Frequency Days to
maturity
N+ (non-stress) - - - 0
N0 (stress) - - - 0
Days to grain filling
N+ (non-stress) - - - 0
N0 (stress)
- - - 0
Flag leaf area
N+ (non-stress) - - - 0
N0 (stress) - - - 0
Plant height N
+ (non-stress) - - - 0
N0 (stress) - - - 0
Spikes m-2 N
+ (non-stress) * * * 3
N0 (stress) * * - 2
Grains spike -1
N+ (non-stress) - * * 2
N0 (stress) - - - 0
1000 grain weight
N+ (non-stress) * * * 3
N0 (stress) - - - 0
Biological yield
N+ (non-stress) * *
- 2
N0 (stress) * * * 3
Harvest index
N+ (non-stress) * * - 2
N0 (stress) * * * 3
Conclusion
In the current experiment, correlation, path coefficient and step-wise regression analyses were used to identify crucial traits affecting grain yield under with and without nitrogen conditions in bread wheat. Statistical analyses applied in the current experiment identified harvest index, biological yield, spikes m-2, grains spike-1 as major contributors towards grain
yield under both N+ and N0, while 1000- grain weight under N0 condition only as evident from strong positive correlation and direct effect and thus needs due weightage in breeding program for further improvement in grain yield of bread wheat.
Authors’ contributions
Conceived and designed the experiments: F Mohammad, Performed the experiments: FU Khan & A Iqbal, Analyzed the data: M Ahmad, Contributed materials/ analysis/ tools: M Adil, Wrote the paper: FU Khan & NU Rehman
References
1. Kalimullah, Khan SJ, Irfaq M &
Rahman HU (2012). Genetic
variability, correlation and diversity studies in bread wheat (Triticum aestivum L.) germplasm. J Animal & Plant Sci 22(2): 330-333.
2. Khan FU, Raziuddin & Khalil IA (2013). Correlations and factor wise contributions of various traits related to yield in rapeseed (Brassica napus L.). American-Eurasian J Agric & Environ Sci 13(1): 101-104.
3. Abd El-Mohsen AA & Abd El-Shafi MA (2014). Regression and path analysis in egyptian bread wheat. J Agri-Food Appl Sci 2(5): 139-148. 4. Ebrahimnejad S & Rameeh V (2016).
Correlation and factor analysis of grain yield and some important component characters in spring bread
wheat genotypes. Cercetări
Agronomice în Moldova 1(165): 5-15 5. Zare M, Shokrpour M & Nejad SEH
aestivum L.) under various drought stress conditions. Bangla J Bot 46(4): 1309-1315.
6. Abderrahmane H, El Abidine FZ, Hamenna B & Ammar B (2013). Correlation, path analysis and stepwise regression in durum wheat (Triticum durum desf) under rainfed conditions. J Agric Sustainability 3(2): 122-131.
7. Dogan R (2006). The correlation and path coefficient analysis for yield and some yield components of durum wheat (Triticum turgidum var. durum L.) in west Anatolia conditions. Pak J Bot 41(3): 1081-1089.
8. Khan MH & Dar AN (2010). Correlation and path coefficient analysis of some quantitative traits in wheat. Afr Crop Sci J 18(1): 9-14. 9. Gelalcha S & Hanchinal RR (2013).
Correlation and path analysis in yield and yield components in spring bread wheat (Triticum aestivum L.) genotypes under irrigated condition in southern India. Afr J Agric Res 8(24): 3186-3192.
10. Mollasadeghi V, Imani AA, Shahryari R & Khayatnezhad M (2011). Correlation and path analysis of morphological traits in different wheat genotypes under end drought stress condition. Middle-East J Sci Res 7 (2): 221-224.
11. Zecevic V, Kenezevic D & Micanovic D (2004). Genetic correlations and path-coefficient analysis of yield and quality components in wheat (Triticum aestivum L.). Genetika 36(1): 13-21.
12. Efyoni D & Mahloji M (2005). Correlation analysis of some agronomic traits in wheat (Triticum aestivumL.) genotypes under salinity stress. J Seed Plant 22: 186-199. 13. Fellahi Z, Hannachi A, Bouzerzour H
& Boutekrabt A (2013). Study of interrelationships among yield and yield related attributes by using various statistical methods in bread wheat (Triticum aestivumL. emThell.) Int J Agrono and Plant Prod 4 (6): 1256-1266.
14. Soleymanfard Y, Naseri R & Moradi M (2012). The study of genetic variation and factor analysis for agronomic traits of durum wheat genotypes using cluster analysis and path analysis under stress condition in western Iran. Int Res J Appl Basic Sci 3(3): 479-485.