A Novel Framework Using Machine Learning to Effectively Analyze
the Faculty Evaluations
Noman Islam∗
Abstract: In this paper, a three pronged solution to faculty evaluation is proposed. Almost in every university, faculty and course evaluations are filled by students after the completion of courses. Due to the large volume of such evaluations, it becomes very difficult for management to carefully analyze them. This paper proposes a framework based on machine learning techniques that can be adopted for effective evaluation of faculty. It uses k-means clustering to group the evaluations and points out the specific area on which management needs to work on with faculty. Along with the quantitative evaluation of faculty, students also provide feedback in the form of comments. The proposed solution performs sentiment analysis on those comments. If there is a high emotion (positive or negative) associated with comments, an email can be sent in real-time to higher management. Another important component of proposed solution is providing summary of the topics discussed in the lectures via transcribing their recorded lecture and then applying machine learning on transcripts.
Keywords:Faculty evaluation, machine learning, clustering, sentiment analysis, speech recog-nition, topic classification
Introduction
In recent past, an interdisciplinary domain called educational data mining or learning analytics have emerged as a viable approach for analyzing the academic data. Data min-ing is a knowledge discovery technique that is used to find generalized pattern in data. A number of tool such as Microsoft Excel, Python, Structured Query Language (SQL), RapidMiner, Waikato Environment for Knowledge Analysis (WEKA), Statistical Pack-age for the Social Sciences (SPSS), Konstanz Information Miner (KNIME), Orange and Knowledge Extraction based on Evolutionary Learning (KEEL) are in used for analytics purposes (Slater, Joksimovi´c, Kovanovic, Baker, & Gasevic, 2017). Educational institu-tions store huge amount of data such as admission, enrollment, examination, attendance and faculty evaluation (Government of Pakistan,2009). A great source of information is available in learning management system (LMS). By analyzing such data, insights can be gained and educational process improvement can be performed.
The hypothesis of this research paper is to employ machine learning techniques to an-alyze the faculty evaluation data. Machine learning is based on using historical data to derive a mathematical model that can be used to make future predictions. Every semester,
∗
Iqra University, Karachi. Email: [email protected]
faculty evaluations are filled by students. These evaluations are performed such that stu-dents provide their feedback on a Likert Scale. In addition, the stustu-dents can also give their comments about the course contents, methodology and teaching style of the instructor. Because of the huge volume of data, it is not possible to manually analyze these evalua-tions. By using machine learning techniques, we can analyze those evaluations as well as pinpointing the areas requiring further improvement. The free form comments given by students can also be examined using sentiment analysis technique. The sentiment analy-sis is the process of analyzing a piece of text to determine the positive or negative opinion of the user about the topic. Finally, we can also analyze the lectures delivered by faculty using speech recognition and natural language processing techniques.
In the same direction, this research paper proposed a framework for improving the education process. The major contributions of this research work are as follows:
a. grouping faculty evaluations and helps management in analyzing them
b. perform sentiment analysis and
c. summarize the topics presented by a faculty during the lecture.
As a case study, this work applies the proposed solution on Iqra University, Gulshan Campus and subsequent results are reported. To our knowledge, this is the first solution that applies topic classification of faculty lectures. The proposed solution provides several benefits to the administration. Using the approach, faculty can identify their weaknesses and higher management can better allocate courses. In addition, the annual confidential report (ACR) can be accordingly filled.
Rest of the sections of the paper have been organized as follows. The literature review has been provided in the next section. The proposed approach is discussed afterwards which is followed by discussion on implementation and results. The paper concludes with highlighting the contributions of this paper and discussing the future work.
Literature Review
The field of educational data mining has been a topic of intense research in past few years.
Romero, Ventura, and Garc´ıa(2008) analyzed the educational data present in Moodle (a learning management tool) and proposed activities such as statistics, visualization, clas-sification, clustering and association rules mining. Classification is the process of catego-rizing into predefined classes based on various features (such as textual, image, voice). Clustering is an unsupervised learning technique that groups the data based on their properties.
statistical models for analyzing the course evaluations of a Canadian university. Linear regression models and techniques from information theory were used for this purpose. They concluded that teaching quality is affected by attitude of teacher and visual presen-tation. They also found that course load doesn’t have any effect on course rating.
Geng and Guo(2012) uses association rules mining technique called Apriori algorithm to gauge faculty performance and then provide decision support capabilities for higher management. An information theory-based algorithm was proposed by Do, Tran, Le, and Duong(2017) to detect lectures that are entirely different from other lectures called outliers. Dutt, Aghabozrgi, Ismail, and Mahroeian(2015) discussed various clustering techniques applied on educational data to mine useful patterns.
Pal and Pal(2013) proposed a hybrid approach to faculty evaluation. They first used various classification techniques such as Nave Bayes, ID3 and CART for faculty evalua-tion. Then the impact of various factors was analyzed based on various statistical tests such as Chi Square, Info gain and gain ratio tests.
In some of the studies, students’ comments were analyzed to mine useful information or to perform sentiment analysis on those comments. The earliest work that analyzes the sentiments was proposed inLeong, Lee, and Mak(2012) that explores the potential of text mining for analyzing students feedback. Gates, Wilkins, Conlon, Mossing, and Eftink
(2014) analyzed the sentiment of student comments using machine learning techniques. The sentiment analysis comprises different steps such as corpus analysis, category selec-tion, lexicon generaselec-tion, processing, assessment and refining. Do, Duong, and Nguyen
(2016) applied data mining techniques to analyze comments about the faculty for Ton Duc Thang University. Vo, Lam, Nguyen, and Tuong(2016) applied sentiment analysis on comments given during faculty evaluation by the students. The proposal was based on a novel idea called bag of structure (BoS). Conventional approach called bag of words (BoW) is based on storing only the frequency of words in a document but BoS also con-siders the structure of the document. Sagum, De Vera, Lansang, Sharon, and Respeto
(2015) proposed a novel scheme for sentiment analysis based on part-of-speech tagging, score assignment and intensity multiplier etc. The system provides 70.85% accuracy in analyzing the sentiments.
Stupans, McGuren, and Babey(2016) used their own developed tool called Leximancer to interrogate the free-form comments of students. This provides a deeper understanding of the course that was not evident from quantitative data. Balahadia and Comendador
(2016) performs opinion mining on students comment in Filipino or English, using Nave Bayes classifier. The results of the evaluation can be shown to higher management in the form of bar graphs and pie-charts.
Sanchez(2017) used a very different approach to analyze faculty performance based on citation analysis using Google Scholar. The results can be used for planning faculty, department and universities. We end the section with mentioning that there have been a number of studies that analyzed the faculty performance based on various factors. Adil and Fatima(2013) analyzed the impact of reward system on teacher’s motivation. Sim-ilarly,Waseem, Frooghi, and Afshan(2013) deliberated on the effect of human resource practices on the faculty performance.
three-pronged solution is the first one that not only analyzes the faculty evaluations both quali-tatively and quantiquali-tatively, but also put a check on the topics delivered in the class during their lecture time. The next section discusses the proposed schemed in detail.
Proposed Approach
Figure 1 shows the block diagram of proposed approach. The students will use the online learning management system to provide their feedback about the faculty. A learning man-agement system is a complete portal that can be used by faculty and students both to per-form academic activities. A teacher can mark attendance, upload their lectures, conduct and grade quizzes, assignments and exams. Students can use the learning management system to view their academic status and performance as well as download instructor’s provided resources. The students can also submit their feedback about courses at the end of the semester.
So, using the learning management system, students can submit their feedback about course in a Likert scale. In addition, student can provide free-form comment. These feedbacks will be recorded in a database. A database is a storage system in which the huge volume of academic records such as students details, course feedback and exam data are maintained.
The ratings of the students can then be analyzed using k-mean clustering algorithm. A clustering algorithm groups similar data (based on certain criteria such as response of the students) into clusters. Different types of clustering algorithms are available. The k-means is the most widely used clustering algorithm.
Besides the quantitative feedback, the free-form comments given by students can be analyzed using sentiment analysis part. Sentiment analysis is a technique to know the +ve or ve perception of audience about an event or topic. In this paper, the sentiment analysis has been performed using Google Natural Language API.
In addition to sentiment analysis, the recorded lectures of the faculty can be tran-scribed. We first record the audio lectures of faculty and then convert it into text form using speech recognition. Speech recognition is a technique that can be used to convert audio data into textual form. Once the text data is available, the Google’s classification algorithm is applied on the lecture transcription to find what topics are covered by faculty member during a lecture. In this way, the higher management can randomly check what topics are covered by a faculty.
Alternatively, if a complaint of a faculty is received, then management can check their recorded lectures.
Clustering
Figure 1
Block diagram of proposed approach
Table 1
Questionnaire for students to evaluate faculty
Questions Choices
What is the first impression about faculty? Poor Not Good Fair Very Good Excellent Does the faculty speak English during lecture? Never Seldom Sometimes Majority of time Always Are students comfortable? Strongly disagree Disagree Neutral Agree Strongly Agree Are students stressed out due to this course? Strongly disagree Disagree Neutral Agree Strongly Agree Are students clear about course objectives? Strongly disagree Disagree Neutral Agree Strongly Agree Are students satisfied with course contents? Strongly disagree Disagree Neutral Agree Strongly Agree
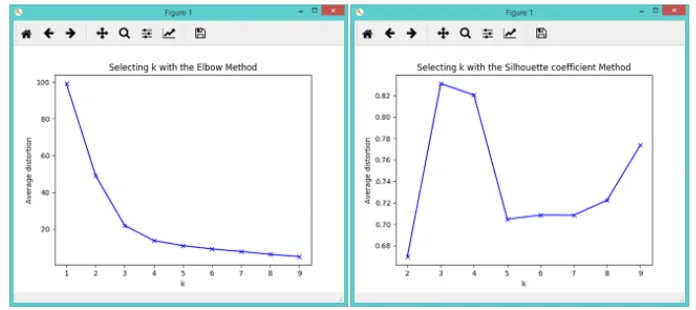
Silhouette Coefficient Analysis
Based on the responses of students, courses can be clustered into groups. An important question that arises is the number of clusters in which faculty should be grouped. This is dependent on the data and can vary for each case. The proposed approach first identifies the number of clusters by applying Silhouette coefficient analysis. It defines how the points in a cluster are similar to each other as compared to points in other cluster. The coefficient can be calculated using the following formula:
b(i)−a(i) max[a(i), b(i)]
where,a(i)is the mean distance between the instances in the current cluster andb(i) is the mean distance between the instance and the instances in the next closest cluster. The maximum value ofs(i)is taken as the desired number of clusters.
Listing 1
Applying Silhouette Coefficient to find the appropriate number of cluster
Then, the rest of the points are assigned to each cluster. Having assigned the clusters to each point, the centroid for each cluster is recomputed. Then, the cluster assignment is repeated again. This process continues, until the lowest dispersion is achieved for the points in each cluster. Having clustered the data, in order to visually analyze the clusters, using principal component analysis, the dimensionality of the vector is reduced.
Listing 2
k-means clustering
Sentiment Analysis
Speech Recognition and Classification
The third component of the proposed solution is speech recognition and classification. For speech recognition, different techniques such as Hidden Markov model or deep learning can be used. In this study, Google’s speech recognition API is used that converts the au-dio into textual form in offline as well as online mode. Once, the lectures of a faculty are recorded, they can be transcribed using Google API. Now, in order to find the topics cov-ered in a lecture, sliding window technique is used. Using the sliding window technique, a portion of text is analyzed. The topic classification can be applied on slices of text from the lecture. This enables identifying the topics on which a particular faculty has talked about during its lecture.
Implementation Details
The proposed approach has been implemented in Python language. The Anaconda distri-bution has been used in which a set of data science libraries are pre-installed. scikit-learn has been used for implementation of clustering algorithm; while Google cloud API has been used for sentiment analysis, speech recognition and document classification. There are other cloud computing frameworks such as Azure and Amazon web services avail-able, but Google has been selected because it is an open source solution. Following are the main features of proposed software:
• Plot the data to identify the trend: The courses that have been grouped into clusters can be visually analyzed using the matplotlib API of python
• Cluster the data using k-means clustering: The courses are grouped into clusters using k-means clustering algorithm
• Plot a particular cluster to identify the trend: A particular cluster can be analyzed to identify the strength and weakness of cluster
• List down the elements of each cluster: This option shows what are the courses that are grouped into a specific cluster
• Perform sentiment analysis and email in real-time: Sentiment analysis can be per-formed on the free-form comments given by a student during faculty evaluation. If the sentiments are extremely positive or negative, email can be generated and sent to higher management in real-time
Results
In the first experiment, clustering is applied on various courses offered to the university. Figure 2 shows the various categories in which the courses are grouped together. Based on the students’ responses, the courses can be grouped into three specific categories. Figure 3 compares the number of clusters identified based on Silhouette coefficient and elbow method. The results are almost identical.
Figure 2
Different categories of courses identified based on their feedback
Figure 3
In order to find the details of specific group, one can drill down to a specific group. Figure 4 shows the strong and weak points of the third group. The students provide their opinion on a scale of 1-5. As can be seen, the teacher of third group has a very good first impression among students and the teacher speaks English most of the time in class, while the students have a mixed opinion about the course objective.
Figure 4
Details of courses of group 3
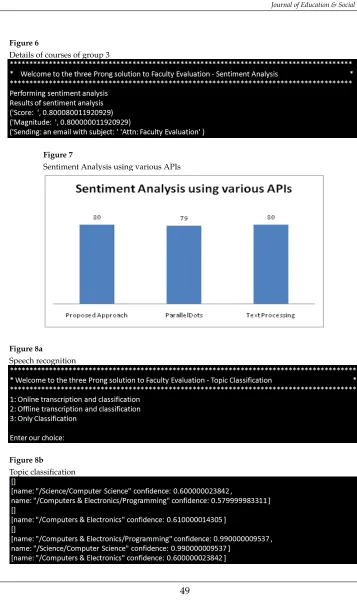
In the next experiment, sentiment analysis was performed on the comments shown in Figure 5 about a senior faculty at Iqra University. The output can be seen in Figure 6. A positive sentiment is associated with the comments (threshold is set to 0.5) and an email is sent to higher management. Figure 7 shows the sentiment analysis performed using proposed approach (Google cloud API), parallel dots (ParallelDot,2018) and text processing (TextProcessing,2018). The results are almost same.
Figure 5
Comments about a senior faculty at Iqra University Satisfied to study these types of advance courses from Sir rather than being tested by another inexperienced faculty member.
Way of teaching needs to be bettered
Ok Nil
good teacher Satisfied
Nothing good programming teacher.
No best teacher.
Friendly teacher Good
Fair Good
Figure 6
Details of courses of group 3
Figure 7
Sentiment Analysis using various APIs
Figure 8a
Speech recognition
Figure 8b
Finally, we applied transcription on the video lectures of the faculty recorded. Figure 8a shows that the software asks for three options. You can perform transcription online or offline. The online transcription has the limit of only 60 seconds audio. Figure 8b shows the various topics that were taught in the class during the whole duration of recorded audio. It is evident that the teacher taught about computer science and programming concept in the class.
Conclusion
References
Adil, M. S., & Fatima, N. (2013). Impact of rewards system on teacher’s motivation: Evidence from the private schools of Karachi.Journal of Education and Social Sciences,
1(1), 1–19.
Balahadia, F. F., & Comendador, B. E. V. (2016). Adoption of opinion mining in the fac-ulty performance evaluation system by the students using Na¨ıve Bayes Algorithm.
International Journal of Computer Theory and Engineering,8(3), 255–259.
Do, T.-D., Duong, T.-V. T., & Nguyen, N.-P. (2016). A data mining-based approach for exploiting the characteristics of university lecturers. InIndustrial Conference on Data Mining(pp. 41–53).
Do, T.-D., Tran, T. M., Le, X.-M. T., & Duong, T.-V. T. (2017). Detecting special lectur-ers using information theory-based outlier detection method. InProceedings of the International Conference on Compute and Data Analysis(pp. 240–244).
Duong, T.-V. T., Do, T.-D., & Nguyen, N.-P. (2015). Exploiting faculty evaluation forms to improve teaching quality: An analytical review. InScience and Information Conference (SAI)(pp. 457–462).
Dutt, A., Aghabozrgi, S., Ismail, M. A. B., & Mahroeian, H. (2015). Clustering algorithms applied in educational data mining.International Journal of Information and Electronics Engineering,5(2), 112-116.
Gates, K., Wilkins, D., Conlon, S., Mossing, S., & Eftink, M. (2014). Maximizing the value of student ratings through data mining. InEducational Data Mining(pp. 379–410). Springer.
Geng, S., & Guo, Z. (2012). Application of association rule mining in college teaching evaluation. InElectrical, Information Engineering and Mechatronics 2011 (pp. 1609– 1615).
Government of Pakistan. (2009). National Educational Policy, Islamabad. Ministry of Educa-tion.
Jiang, Y. H., Javaad, S. S., & Golab, L. (2016). Data mining of undergraduate course evaluations. Informatics in Education,15(1), 85–102.
Leong, C. K., Lee, Y. H., & Mak, W. K. (2012). Mining sentiments in SMS texts for teaching evaluation.Expert Systems with Applications,39(3), 2584–2589.
Pal, A. K., & Pal, S. (2013). Evaluation of teacher’s performance: A data mining approach.
International Journal of Computer Science and Mobile Computing,2(12), 359–369. ParallelDot. (2018). Retrieved fromwww.paralleldots.com/sentiment-analysis
Romero, C., Ventura, S., & Garc´ıa, E. (2008). Data mining in course management systems: Moodle case study and tutorial. Computers & Education,51(1), 368–384.
Sagum, A., De Vera, J. G. M., Lansang, P. J. S., Sharon, R. N. D., & Respeto, J. K. (2015). Application of language modelling in sentiment analysis for faculty comment eval-uation. InProceedings of the International Multi Conference of Engineers and Computer Scientists.
Sanchez, T. W. (2017). Faculty performance evaluation using citation analysis: An update.
Slater, S., Joksimovi´c, S., Kovanovic, V., Baker, R. S., & Gasevic, D. (2017). Tools for educational data mining: A review. Journal of Educational and Behavioral Statistics,
42(1), 85–106.
Stupans, I., McGuren, T., & Babey, A. M. (2016). Student evaluation of teaching: A study exploring student rating instrument free-form text comments. Innovative Higher Ed-ucation,41(1), 33–42.
TextProcessing. (2018). Retrieved from https://text-processing.com/demo/ sentiment/
Vo, H. T., Lam, H. C., Nguyen, D. D., & Tuong, N. H. (2016). Topic classification and sen-timent analysis for Vietnamese education survyey system.Asian Journal of Computer Science and Information Technology,6(3), 27–34.
Waseem, S. N., Frooghi, R., & Afshan, S. (2013). Impact of human resource manage-ment practices on teachers’ performance: A mediating role of monitoring practices.