Head
Circumference
Reference
Data:
Birth to
18 Years
Alex F. Roche,
MD, PhD, DSc, Debabrata
Mukherjee,
PhD,
Shumei
Guo, PhD, and William
M. Moore,
MD, MPH
From Wright State University School of Medicine, Yellow Springs, and Ross Laboratories,
Columbus, Ohio
ABSTRACT. Highly reliable data from a sample of 888 white US children, measured serially in a single study,
have been used to provide reference data for head
circum-ference from birth to 18 years of age. The present data
differ little from those already available for the age range
from birth to 36 months of age, but they are considerably
higher (about 0.5 cm) at older ages for boys and tend to
be slightly higher for girls. These new reference data are smoother across age than those used currently for
screen-ing and evaluation. Percentiles for 6-month increments from birth to 6 years have been provided. Pediatrics 1987;79:706-712; head circumference.
The measurement of head circumference is an
important part of the clinical examination of any
infant. The method of measurement is highly
standardized’ and sets of reference data are
avail-able with which observed values can be compared.
The widely used National Center for Health
Statis-tics (NCHS) percentiles for infants were derived
from participants in the Fels Longitudinal Study.2’3
The reference data complied by Nellhaus4 for ages
from birth to 18 years are composites of 14 studies, published between 1952 and 1965, in which children
from families of low socioeconomic status were
ovenrepresented and different ethnic groups were
included.
During infancy, the measunement and
interpne-tation of head circumference has an important
place in screening for conditions in which head size is abnormal, eg, hydrocephalus and microcephaly.
This measurement is less important during
child-hood and adolescence, but it is relevant to the
Received for publication Jan 23, 1986; accepted June 20, 1986.
Reprint requests to (A.F.R.) Division of Human Biology,
De-partment of Pediatrics, Wright State University School of
Mad-icine, 1005 Xenia Aye, Yellow Springs, OH 45387-1695.
PEDIATRICS (ISSN 0031 4005). Copyright © 1987 by the
American Academy of Pediatrics.
extended observation of children whose head
cm-cumferences were unusual during infancy. After
infancy, reference data can assist judgments of the
normality of recorded measurements and assist the
recognition of intrafamilial clustering of unusual values.
The aim of the present study was to provide
reference data for head circumference from birth to
18 years and 6-month increments from birth to 6
years using data from a single study in which all
measurements were made using the same method
and the observer differences were known to be
small.
SUBJECTS AND METHODS
The mixed longitudinal data that have been
ana-lyzed were recorded from 888 participants in the
Fels Longitudinal Study between 1930 and 1982.
Secular trends in these data are small and
incon-sistent. Many of these data were used earlier to
construct the NCHS growth charts for the age
range from birth to 36 months.2’3 Also, the present sample of Fels’ participants is similar to a sample
from which 6-month increments in head
circumfen-ence from birth to 36 months have been derived.5
The participants in the Fels Longitudinal Study
were from families with a wide range of
socioeco-nomic status living in southwestern Ohio. These
participants were the products of normal
pregnan-cies and were in good health. There are 13 black
children in the Fels Longitudinal Study; the
ne-mainder are white. The data from the black
partic-ipants were excluded from the present analyses.
Data from four sets of participant triplets have
been omitted from the present analyses because
triplets were ovenrepresented and because they were
omitted also from the analyses made previously to
construct sets of reference data.2’3’5 Data from the
have been used in the present and were used in the
past analyses; the data from these twins did not
differ significantly from those for the remainder of
the group. There are some like-sex first-degree
nel-atives, eg, sister-sister, in the data set. Random
selection of one member from each such pair or
triad did not alter the descriptive statistics to a
statistically significant extent, but the sample sizes
were reduced by about 20%. Consequently,
exclu-sions were not made on the basis of familial nela-tionships.
Head circumference was measured serially at
birth, 1, 3, 6, 9, and 12 months and then each 6
months to 18 years. A nonstretchable tape
gradu-ated in millimeters was used. In 1976, the tape
measure used previously was replaced by an
inser-tion tape (INSER-TAPE, Ross Laboratories), after
it had been shown that the differences between
pairs of measurements with the two types of tape
did differ significantly. Use of an insertion tape
reduces the probability of measurement errors.6 The method of measurement was the same with
each type of tape. The tape was placed with its
inferior margin just touching the superior bonders
of the eyebrows. If superciliary arches were present,
the tape was placed superior to them. The posterior
part of the tape was aligned so that the maximum
head circumference was recorded, even if the
meas-urement included the external occipital
protuber-ence. Care was taken to ensure that the plane of
the tape was the same on the left and night sides of the head. Hair pins and clips were removed and
lange amounts of hair, eg, braids, were excluded
from the plane of measurement.
The tape was pulled tightly around the head, and
the circumference was recorded to the nearest
mil-limeten by two observers measuring independently. If the difference between a pain of measurements
was less than 2 mm, the mean of the pair was used in the analyses. If their measurements differed by
more than 2 mm, each observer repeated the
meas-urement. The mean of the second pair of
measure-ments was used in the analyses if the separate
measurements differed by less than 2 mm. On the
rare occasions when the difference within each pair
of measurements exceeded 2 mm, the mean of all
four measurements was used. Analyses of
intenob-server differences (n = 1386 pairs of data) showed
technical errors
(J
(d/2n) of 0.9 mm andcoeffi-cients of variation of 0.0002 that were independent of age.
The head circumference data were grouped by
sex at ages corresponding to those of the scheduled
examinations. Selected percentiles (fifth, tenth,
twenty-fifth,, fiftieth, seventy-fifth, ninetieth, and
ninety-fifth) were calculated.7 Subsequently, the
calculated percentiles and the means and standard deviations were smoothed across age using a family
of mathematical functions fitted by a nonlinear
iterative procedure. These functions gave satisfac-tory results in terms of minimal differences between the observed and estimated values. The mathemat-ical functions were applied to the calculated values for the selected percentiles, the means, and the ±2
and ±3 SD levels at each of the scheduled ages,
although the estimated values are reported only at
annual intervals for ages olden than 6 years.
Six-month increments in head circumference
from birth to 6 years were calculated. Selected
percentiles, means, and standard deviations were
obtained and subsequently smoothed using a family
of mathematical functions.
RESULTS
Selected distribution statistics for smoothed val-ues from birth to 18 years are presented in Tables
1 and 2 for boys and girls, respectively. The
per-centile levels tended to be higher for boys than
girls; differences between the distributions for the two sexes were significant (P
<
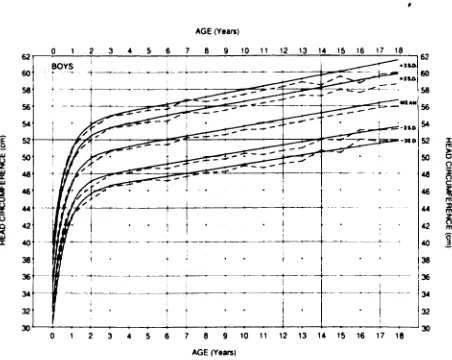
.05) at each age bythe Kolmogonov-Smirnov test. The percentile curves are shown in Figs 1 and 2 for the age range
birth to 18 years. Between birth and 6 months of
age, the separate percentile curves are close in these
figures. Consequently, percentile curves from birth to 6 years are presented using a larger age scale in Figs 3 and 4.
The means were significantly larger (P
<
.05) for boys than for girls at each age except 13 years. The significance of the differences betweencorrespond-ing means was established using t tests, after
ad-justing for the Bonferroni inequality by o’/p where
p = number of tests performed, to maintain the
overall type I error.
The smoothed means ±2 SD and ±3 SD from the
present data are shown in Figs 5 and 6 where
comparisons are made with the data of Nellhaus,4
who made available his unpublished means and
standard deviations. The differences between the
present data and the corresponding values of
Nell-haus (mean
±
2 SD) were small from birth to 12months for boys and from birth to about 18 months for girls. At older ages, the present values for boys
were about 0.5 to 1.5 cm greater than the
come-sponding Nellhaus values. For example, an
11-year-old boy with a head circumference at the -2 SD
level on the Nellhaus chart is at -2.5 SD level with
the present data, and a boy of this age who is +2 SD with the Nellhaus chart is +1.5 SD with the
present data. For the girls, there was only a slight
tendency for the present values to exceed those of
TABLE 1. Distribution Statistics for Smoothed Head Circumference Values (cm) of Boys
Age
(yr)
n Percentiles Mean SD
5th 101h 25th 50th 75th 90th 95th
Birth 177 32.88 33.22 34.21 35.25 36.23 37.12 37.80 34.61 1.62
0.08 277 34.70 35.06 36.00 37.01 37.98 38.84 39.63 37.30 1.47
0.25 291 37.79 38.17 39.03 40.00 40.96 41.76 42.69 40.28 1.42
0.50 303 41.09 41.49 42.29 43.22 44.16 44.92 45.93 43.52 1.34
0.75 292 43.35 43.77 44.52 45.43 46.36 47.10 48.11 45.54 1.32
1.00 307 44.91 45.33 46.06 46.97 47.89 48.62 49.60 46.87 1.32
1.50 297 46.75 47.18 47.90 48.81 49.72 50.45 51.32 48.20 1.35
2.00 299 47.69 48.12 48.84 49.77 50.68 51.41 52.20 49.20 1.36
2.50 226 48.21 48.65 49.38 50.31 51.23 51.97 52.70 50.02 1.36
3.00 184 48.55 48.99 49.73 50.67 51.59 52.34 53.03 50.52 1.37
3.50 181 48.81 49.24 49.99 50.94 51.87 52.62 53.29 50.99 1.39
4.00 178 49.02 49.45 50.22 51.16 52.10 52.87 53.52 51.23 1.40
4.50 174 49.22 49.65 50.42 51.37 52.32 53.09 53.74 51.51 1.44
5.00 170 49.40 49.83 50.62 51.57 52.54 53.30 53.95 51.78 1.46
5.50 127 49.59 50.02 50.81 51.77 52.74 53.51 54.15 52.06 1.49
6.00 176 49.77 50.20 51.01 51.96 52.95 53.72 54.36 52.22 1.45
7.00 182 50.13 50.56 51.39 52.35 53.36 54.14 54.76 52.52 1.39
8.00 174 50.50 50.92 51.77 52.73 53.77 54.55 55.17 52.86 1.39
9.00 160 50.86 51.27 52.15 53.12 54.17 54.96 55.58 53.19 1.43
10.00 157 51.22 51.63 52.53 53.50 54.58 55.38 55.99 53.57 1.50
11.00 152 51.58 51.99 52.92 53.89 54.99 55.79 56.39 53.93 1.54
12.00 150 51.94 52.35 53.30 54.27 55.40 56.20 56.80 54.11 1.45
13.00 132 52.31 52.71 53.68 54.66 55.81 56.62 57.21 54.43 1.56
14.00 127 52.67 53.07 54.06 55.04 56.22 57.03 57.62 54.99 1.60
15.00 124 53.03 53.43 54.44 55.43 56.63 57.44 58.02 55.48 1.58
16.00 113 53.39 53.78 54.82 55.81 57.03 57.86 58.43 55.97 1.59
17.00 113 53.76 54.14 55.20 56.20 57.44 58.27 58.84 56.38 1.56
18.00 108 54.12 54.50 55.59 56.59 57.85 58.68 59.25 56.74 1.77
smoother across age than those of Nellhaus.4 In to be highly reliable. Nevertheless, there were only
Figs 5 and 6, ±3 SD levels for the present data are small differences between the present data and the
shown so that more extreme head circumferences composite data of Nellhaus,4 at ages younger than
can be evaluated readily. 12 months for boys and 18 months for girls. At
Selected smoothed percentiles for 6-month incne- older ages, the Nellhaus data are about 0.5 to 1.5
ments in head circumference are presented in Table cm less than corresponding present values for boys,
3 and in Figs 7 and 8 for boys and girls, respectively. but the differences are considerably less for girls.
These percentiles were smoothed using mathemat- This could reflect the low socioeconomic status of
ical functions and are presented with each incre- many subjects in the composite Nelihaus data, sec-ment opposite the end of the corresponding 6- ulan changes,9 or differences in the method of
mea-month interval. There was a rapid decrease in rate suning head circumference.
during the first year; later the decrease was slow The present data differ only slightly from the
but continued until at least 6 years. The patterns NCHS reference data for birth to 36 months.2’3 of change were similar for the two sexes, but the This was expected because these sets of percentile
early deceleration tended to be greater for the boys values were obtained from overlapping samples.
than the girls. The median increments for the boys Replacement of the NCHS data by the present data tended to be greater than those for the girls up to would not be justified. Because the NCHS percent-the age of 4.5 years, after which there was a tend- iles extend only from birth to 36 months, they have ency to an opposite sex difference. limited applicability in intervention programs that
extend to olden ages. Reference data for a larger age
DISCUSSION range allow the follow-up of children with abnormal
values during infancy and recognition of the
catch-Early in infancy there are rapid increases in head up growth in head circumference that can occur up
circumference and marked histologic changes in the to about 5 years, when the cranial sutures inter-brain.8 Therefore, early recognition of deviations lock.’0” The present data will allow interpretation from normal growth is important. The present nef- of head circumference values for parents, using
18-enence data were obtained in a single study using a year values as reference data, and for children older
4’
44
42
3,
56
56
54
36
0 1 2 3 4 5 6 7 8 9 10 11 12 13 14 15 16 17 18
Fig 2. Selected percentilesfor smoothed head circum-ference values of girls from birth to 18 years.
of intrafamilial clustering of unusual values.’2 ments from birth to 6 months are larger by about
Reference data for 6-month increments are al- 0.7 cm at the median level. This may reflect
differ-ready available fon the age range birth to 3 years.5”3 ences in the sample used, which included data
ex-The present study has extended the mange of avail- tending to 1982 instead of 1978 but excluded blacks,
able reference data for 6-month increments to 6 rather than differences in measurement technique.
years. The larger age range will be useful in the The present tables and figures can be used to
evaluation of changes observed in intervention pro- evaluate the normality of head circumference from
grams. The distributions of the present increments birth to 18 years. There is a pubescent spurt in
from birth to 36 months are similar to those pub- head circumference which has been reported to be
lished previously,5”3 except for the increments from larger in girls than in boys,’4 unlike the spurts in
birth to 6 months. In the present data, the incre- stature and in weight. The spurt in head
cincumfer-TABLE 2.
Distribution Statistics for Smoothed Head Circumference Values (cm) of GirlsAge
(yr)
n Percentiles Mean SD
5th 101h 25th 50th 75th 90th 95th
Birth 165 32.27 33.01 33.79 34.64 35.38 36.11 36.81 33.88 1.42
0.08 247 33.76 34.49 35.31 36.13 36.89 37.59 38.18 36.42 1.13
0.25 247 36.47 37.18 38.04 38.80 39.61 40.28 40.71 39.10 1.65
0.50 285 39.53 40.19 41.06 41.79 42.63 43.29 43.63 42.20 1.22
0.75 272 41.75 42.36 43.21 43.94 44.79 45.48 45.81 44.18 1.28
1.00 270 43.38 43.94 44.75 45.50 46.35 47.07 47.45 45.46 1.33
1.50 264 45.47 45.95 46.68 47.47 48.30 49.09 49.62 46.92 1.25
2.00 261 46.63 47.05 47.73 48.56 49.37 50.23 50.89 48.02 1.40
2.50 210 47.31 47.70 48.34 49.21 50.01 50.91 51.67 48.71 1.31
3.00 159 47.74 48.11 48.74 49.63 50.42 51.35 52.17 49.40 1.25
3.50 151 48.03 48.41 49.02 49.93 50.73 51.67 52.53 49.78 1.29
4.00 161 48.26 48.64 49.25 50.17 50.98 51.93 52.80 50.11 1.27
4.50 146 48.46 48.83 49.46 50.39 51.20 52.16 53.03 50.40 1.29
5.00 153 48.63 49.02 49.65 50.59 51.42 52.37 53.23 50.68 1.33
5.50 120 48.80 49.19 49.84 50.78 51.62 52.57 53.43 50.99 1.36
6.00 155 48.96 49.36 50.02 50.97 51.82 52.77 53.61 51.16 1.34
7.00 168 49.27 49.69 50.38 51.35 52.22 53.17 53.96 51.58 1.42
8.00 163 49.58 50.03 50.74 51.72 52.62 53.56 54.32 52.00 1.41
9.00 156 49.89 50.36 51.09 52.09 53.01 53.95 54.67 52.27 1.38
10.00 166 50.20 50.69 51.45 52.46 53.41 54.34 55.01 52.65 1.41
11.00 150 50.51 51.02 51.81 52.83 53.81 54.73 55.36 53.05 1.47
12.00 162 50.82 51.35 52.17 53.20 54.20 55.12 55.71 53.50 1.50
13.00 140 51.13 51.68 52.52 53.57 54.60 55.52 56.06 53.96 1.49
14.00 140 51.44 52.01 52.88 53.94 54.99 55.91 56.41 54.21 1.43
15.00 133 51.75 52.34 53.24 54.31 55.39 56.30 56.76 54.31 1.44
16.00 132 52.06 52.67 53.60 54.68 55.79 56.69 57.11 54.45 1.48
17.00 139 52.37 53.00 53.95 55.05 56.18 57.08 57.46 54.57 1.39
18.00 110 52.68 53.33 54.31 55.42 56.58 57.47 57.80 54.55 1.33
60 .
_
AGE (Y#{149}a)
0 2 3 4 5 6 7 8 9 10 1112131415161718
58 58
56 56
54 54
52 50
44
42
iiL.
32r
-
::
-:- 2 3 5 6 7 83,
AGE(Yeas)
Fig 1. Selected percentiles for smoothed head
circum-ference values of boys from birth to 18 years.
AGE Yas)
0 2 3 4 5 6 7 8 9 10 1 12131415161718
. . .60
3
AGE Yea’s)
0 3
AGE )Yea,s)
t- . -t-T --#{149}-#{149}
---.--.
-.
.
iijIi
±
-.I
. 3 4 5 6 7 8 9 10 11 12 13 14 15 16 17 18
0 1
AGE (Yea’s) 00 05
GIRLS
0 15 20 25 30 35 40 a5 50 55 60
_____
00 05 10 15 20 2.5 30 35 40 45 50 55 60
0 1 2 3 4 5 I 8 9 10 11 1( 13 1 I 15 16 17 18
AGE (Yeals)
#{182}520 25 30 35 40 45 50 55 60
Fig 3. Selected percentiles for smoothed head
circum-ference values of boys from birth to 6 years.
AGE (Yeas)
-‘ S 38 36 34 32
Fig 6. Smoothed means (±2 SD and ±3 SD) from head circumference data for girls. Present data (-)
com-pared with data from Nellhaus4 (-
-40 38
---
3#{128} 34----
3236
AGE(Yea’s)
Fig 4. Selected percentiles for smoothed head
circum-ference values of girls from birth to 6 years.
AGE (Ya,s)
AGE (Yeaes)
Fig 5. Smoothed means (±2 SD and ±3 SD) from head
circumference data for boys. Present data (-)
com-pared with data from Nellhaus4 (-
-ence is associated more with changes in scalp
thick-ness than in cranial thickness.’5”6 Because
pubes-cent spurts in head circumference are small and
36 occur at different ages among individuals, they are
54 not apparent in the present reference data.
There-:
fore, serial data for individuals can be plotted at all48 5 ages in relation to the present reference data
with-46 out problems of interpretation resulting from
mdi-vidual differences in the timing of pubescence. The finding that head circumferences were significantly
larger in boys than in girls is in agreement with
earlier reports.’7”8
The present percentile values were derived from
a sample of white US children, but they should be
applicable to US black children also.’9 However, it
should not be assumed that they are appropriate
for other ethnic groups, because large differences
in head circumference have been reported between
ethnic groups.20’2’ Various socioeconomic levels
were represented in the Fels sample and some low
birth weight infants were included (4.6%
<
2.5 kgbirth weight). Adjustments were not made for
so-cioeconomic status because of the vague and
sub-jective nature ofthis categorization. The prevalence
of low birth weight infants was similar to that
expected in a random sample; the numbers were
too few to allow the development of separate
ref-erence data for this group.
Head circumference is an important measure
be-cause it is highly correlated with brain weight,
especially during infancy.22’23 Many infants with
values more than 3 SD below the mean from the
time of birth, as may occur in those with fetal
alcohol syndrome, on with values that decrease from
the normal range to be 2 SD on more below the
mean are mentally retarded.24’25 Lange values,
es-pecially those that increase in percentile level on
are associated with large increments, suggest the
need for tests to exclude hydrocephalus. Less
com-mon causes of large values for head circumference
associ-10
3
B
AGE(Yea,s)AT ENDOF INTERVAL
0
6
5
4
REFERENCES
1. Roche AF: Growth assessment in abnormal children. Kidney
mt
1978;14:369-3772. Hamill PVV, Drizd TA, Johnson CL, et al: NCHS growth
curves for children birth-18 years, United States, Vital and
Health Statistics, series 11, No. 165, Department of Health,
TABLE 3.
Distribution Statistics for Smoothed Head Circumference 6-MonthIncre-ments (cm)
End of
Interval
n Percentiles Mean SD
5th 101h 25th 50th 75th 90th 95th
Boys 0.50 1.00 1.50 2.00 2.50 3.00 3.50 4.00 4.50 5.00 5.50 6.00 Girls 0.50 1.00 1.50 2.00 2.50 3.00 3.50 4.00 4.50 5.00 5.50 6.00 163 282 285 287 223 181 176 174 171 168 125 165 149 251 254 253 206 153 148 156 143 147 120 150 7.37 2.08 0.55 0.11 -0.03 -0.07 -0.09 -0.10 -0.11 -0.12 -0.13 -0.13 6.90 2.07 0.60 0.14 -0.01 -0.08 -0.12 -0.14 -0.16 -0.18 -0.19 -0.20 7.87 2.38 0.85 0.37 0.19 0.11 0.06 0.04 0.02 0.01 0.01 0.00 7.27 2.43 0.89 0.36 0.16 0.08 0.04 0.02 0.01 0.01 0.00 0.00 8.40 2.82 1.21 0.68 0.45 0.32 0.24 0.18 0.13 0.10 0.08 0.06 8.18 2.79 1.30 0.77 0.52 0.36 0.26 0.19 0.13 0.10 0.07 0.05 9.49 3.33 1.55 0.95 0.69 0.53 0.43 0.34 0.28 0.23 0.18 0.15 8.70 3.28 1.64 1.06 0.78 0.61 0.48 0.39 0.31 0.25 0.20 0.16 10.22 3.89 1.92 1.23 0.93 0.75 0.63 0.53 0.45 0.38 0.32 0.27 9.37 3.66 1.93 1.32 1.02 0.83 0.69 0.57 0.48 0.40 0.33 0.28 10.96 4.48 2.33 1.54 1.19 0.98 0.83 0.71 0.61 0.53 0.46 0.39 9.91 4.18 2.34 1.65 1.31 1.09 0.92 0.79 0.67 0.58 0.49 0.42 11.31 5.03 2.70 1.78 1.37 1.14 0.99 0.88 0.78 0.70 0.62 0.55 10.37 4.63 2.81 2.07 1.66 1.38 1.16 0.97 0.82 0.65 0.58 0.49 9.43 3.41 1.52 1.01 0.71 0.50 0.44 0.35 0.29 0.30 0.24 0.18 8.55 3.22 1.71 1.08 0.80 0.57 0.40 0.37 0.27 0.29 0.25 0.24 1.46 0.93 0.85 0.55 0.43 0.37 0.35 0.38 0.24 0.54 0.28 0.25 2.31 0.85 0.78 0.92 0.53 0.31 0.35 0.30 0.38 0.28 0.27 0.28
AGE(Yea’s) AT ENDOF INTERVAL
1 10 15 20 25 30 35 40 45 50 55 60.2
---+
-
-
- f--- + 1115 BOYS
05 10 15 20 25 30 35 40 45 50 55 65 AGE (Yea’s(AT END OFINTERVAL
Fig 7. Selected percentiles for 6-month increments in
head circumference for boys (birth to 6 years).
ated with mental retardation and neunologic signs’2
and benign subdural effusion.26
A head circumference value outside the normal
range (±2 SD) can be adjusted for prematurity27
(on reference data specific for premature infants
can be used),28’29 head shape,’7’3#{176}recumbent length,
weight,3’ or parental head circumference.32 Such
adjustments remove the effects of these variables
from unusual head circumferences and thus help
determine whether these values are indicative of
abnormalities or diseases.
7
10 15 20 25 30 35 5
AGE (Y.wS)AT ENDOF WITERVAL
Fig 8. Selected percentiles for 6-month increments in
head circumference for girls (birth to 6 years).
ACKNOWLEDGMENT
This research was supported by a grant from Ross
Education, and Welfare Publication No. (PHS) 78-1650.
Government Printing Office, 1977
3. Hamill PVV, Drizd TA, Johnson CL, et al: Physical growth:
National Center for Health Statistics percentiles. Am J Gun Nutr 1979;32:607-629
4. Nellhaus G: Head circumference from birth to eighteen
years: Practical composite international and interracial
graphs. Pediatrics 1968;41:106-114
5. Roche AF, Himes JH: Incremental growth charts. Am J Gun
Nutr 1980;33:2041-2052
6. Zerfas AJ: The insertion tape: A new circumference tape for
use in nutritional assessment. Am J GUn Nutr
1975;28:782-787
7. SAS User’s Guide, Basic. Raleigh, NC, SAS Institute, 1982,
p 579
8. Rabinowicz T: The differentiate maturation of the human
cerebral cortex, in Falkner F, Tanner JM (eds): Human
Growth, ed 2. New York, Plenum Press, 1986, vol 2, pp 385-410
9. Ounsted M, Moar VA, Scott A: Head circumference charts
updated. Arch J Dis Child 1985;60:936-939
10. Roche AF: Possible catch-up growth of the brain in man.
Acta Med Auxol 1980;12:165-179
1 1. Laron Z, Galatzer A: Effect of hGH on head circumference
and IQ in isolated growth hormone deficiency. Early Hum
Dev 1981;5:211-214
12. Schreier H, Rapin I, Davis J: Familial megalencephaly or
hydrocephalus? Neurology 1974;24:232
13. Baumgartner RN, Roche AF, Himes JH: Incremental
growth tables: Supplementary to previous published charts.
Am J Glin Nutr 1986;43:7711-7722
14. Eichorn DH, Bayley N: Growth in head circumference from
birth through young adulthood. Child Dev 1962;33:257-271
15. Roche AF: Increase in cranial thickness during growth. Hum
Biol1953;25:81-92
16. Young RW: Age changes in the thickness of the scalp in
white males. Hum Biol 1959;31:74-79
17. Brandt I: Dynamics of head circumference growth before
and after term, in RObertS DF, Thomson AM (eds): The
Biology of Human Fetal Growth. London, Taylor & Francis
Ltd, 1976, pp 109-136
18. Karlberg P, Taranger J, Engstrom I, et al: I. Physical growth
from birth to 16 years and longitudinal outcome of the study
during the same age period, in Karlberg P, Taranger G (eds):
The Somatic Development of Children in a Swedish Urban
Community. Goteborg, Sweden, University of Goteborg,
1976, pp 7-76
19. Wingerd J, Schoen EJ, Solomon IL: Growth standards in
the first two years of life based on measurements of white
and black children in a prepaid health care program. Pedi-atrics 1971;47:818-825
20. Meredith HV: Human head circumference from birth to
early adulthooth Racial, regional, and sex comparisons.
Growth 1971;35:233-251
21. Palti H, Peritz E, Flug D, et al: Comparison of head
circum-ference in an Israeli child population with United States
and British standards. Ann Hum Biol 1983;10:195-198
22. Bray PF, Shields DW, Wolcott GJ, et al: Occipitofrontal
head circumference-An accurate measure of intracranial
volume. J Pediatr 1969;75:303-305
23. Cooke RWI, Lucas A, Yudkin PLN, et al: Head
circumfer-ence as an index of brain weight in the fetus and newborn.
Early Hum Dev 1977;1/2:145-149
24. Avery GB, Meneses L, Lodge A: The clinical significance of
“measurement microcephaly.” Am JDiS Child
1972;123:214-217
25. Babson SG, Henderson NB: Fetal undergrowth: Relation of
head growth to later intellectual performance. Pediatrics
1974;53:890-894
26. Hefelfinger DC, Young LW: Radiological case of the month.
Am J Dis Child 1984;138:197-198
27. Brandt I: Growth dynamics oflow-birth-weight infants with
emphasis on the perinatal period, in Falkner F, Tanner JM
(eds): Human Growth, vol 2: Postnatal Growth. New York,
Plenum Press, 1978, pp 557-617
28. Babson SG, Bends GI: Growth graphs for the clinical as-sessment of infants of varying gestational age. J Pediatr
1976;89:814-820
29. Usher RH, McLean FH: Intrauterine growth of live-born
Caucasian infants at sea level: Standards obtained from
measurement in seven dimensions of infants born between
25 and 44 weeks of gestation. J Pediatr 1969;74:901-910
30. Largo RH, Duc G: Head growth and changes in head
config-uration in healthy preterm and term infants during the first
six months of life. Helu Paediatr Acta 1977;32:431-442
31. Illingsworth RS, Eid EE: The head circumference in infants
and other measurements to which it may be related. Acts Paediatr Scand 1971;60:333-337
32. Weaver DD, Christian JC: Familial variation of head size
and adjustment for parental head circumference. J Pediatr