VLS Algorithm: A New Approach to Sentiment
Analysis
CH. Rayala Vinod Kumar, D. Lalitha Bhaskari ,P. Srinivasa Rao
Abstract: In this current era, people can express their views, opinions, exchanging of data and sharing their thoughts about different topics, trends and issues on Social media. Social Media takes a major role to maintain the persons’ emotional feelings on their day to day life. Sentiment Analysis is a method to analyze the views and find the polarity of the views. Twitter is a crucial forum where people share their ideas, views and feelings multiple times. Sentiment Analysis from Twitter is a method of tweet analysis. Sentimental values can be derived from the user via twe ets. The polarity measure of the data indicates whether the user’s sentiments are positive, negative and neutral values on an aspect. It focuses on the tweet and the hash tag for understanding the situation in each aspect. In this research paper, firstly we performed Analysis of sentiments to categorize highly unstructured Twitter information. Secondly, a comparision of the proposed algorithm called Various #tags Live tweets Sentiment analysis (VLS) with Naive Bayes and Convolution Neural Networks is performed. Section three of the research methodology discusses how the algorithm is operating. The findings are reported in the experiment section produced by the Naive Bayes, CNN and VLS Algorithms. After Comparison we proved that our proposed algorithm works efficiently.
Index Terms: Sentiment analysis, Machine learning, Opinion mining, Classification, Twitter, Tweet, Hash tag.
————————————————————
1. INTRODUCTION
Social computing is a creative and growing example of social interaction analysis and modeling on different platforms. It is used to produce intellectual and interactive applications to derive efficient results [1]. The extensive availability and wide usage of social media sites provides individuals to share their sentiments or opinions about a specific incident, product or problem. It is very useful for drawing conclusions about various events, topics, issues, products etc. by mining these informal and homogeneous results. Nonetheless, the highly unstructured format of opinions on the web presents challenges to the mining process [2]. The texts published on the web are mostly divided into one of the two groups: data of facts and data of feelings [3]. The objective terminology related to different entities, problems and events constitutes factual data. While feeling information is the subjective term that defines the views or beliefs of individuals for a specific entity, product or event. Analysis of sentiments is the process of identification and classification of individuals' different feelings online, so that their response to a particular product, subject or event is decided by the author whether it is positive, negative or neutral. The emotions expressed in the text are both direct and comparative in the sentimental analysis method. The direct feelings in the text are isolated in the same sentence from other objects. The comparative feelings in the text, however, suggest that different subjects are comparable to the same sentence [4]. In this paper, sentiment analysis is done on twitter data on live tweets. As most of the researchers agree, Twitter is a leading micro blogging website with huge base of micro blogging user data base and its popularity is ever increasing [5–6].
In addition, the tweets are mainly public and limited to certain features that simplify emotion identification in the text [6-9]. The abundance of data, the use of short forms and the timing of various posts make it difficult for Twitter users to interpret their feeling. In this work apart from textual data from live tweets, emojis(emotion icons) are also considered. Even though the emoji’s do not constitute a major share like text tweets, their usage in tweets cannot be neglected. Hence[28]. in this work we have considered frequently used emojis like (griming face), (angry face), (sad face). and included them in training data set. The goal of the naive probability in Naïve Bayes[26]. is to maximize the later probability, given the training data, to formulate the decision law. Tokenization describes the process by which a text corpus is broken down into individual elements that serve to input various natural language algorithms. Tokenization is normally accompanied by other processing steps, such as removal, stemming, or lemmatization of stop words and punctuation characters and the construction of n grams. Convolutionary neural networks have architecture, different from regular neural networks. Regular neural networks transform an input through a number of hidden layers. That layer consists of a series of neurons, in which each layer is completely connected to all the neurons in the previous layer. Ultimately, a last fully connected the output layer-reflects the forecasts. Neural networks are somewhat different. The layers are first and foremost divided into three dimensions: width, height and depth. The other parts of this paper are structured as follows - In section 2, the existing work in the field of machine learning and emotional intelligence along with classification algorithms and deep neural networks is presented. The methodology of the proposed algorithm is outlined in Section 3. Section 4 describes the comparative analysis of the proposed algorithm along with Naive Bayes and CNN on twitter data followed by conclusions in section 5.
2. LITERATURE SURVEY
A large number of studies on sentiment analysis were performed in recent years. In [7] the authors suggested a
_______________________________
• CH. Rayala Vinod Kumar Research Scholar, Department of CSSE, AU College of Engineering (A), Andhra University, Visakhapatnam, INDIA, PH-9441944687. E-mail: [email protected].
• D. Lalitha Bhaskari, Professor, Department of CSSE, AU College of Engineering (A), Andhra University, Visakhapatnam. INDIA, • P.Srinivasa Rao, Professor, Department of CSSE, AU College of
method of ranking the data generated on Twitter from the students into different categories to fix different problems for the students. In [10], authors proposed a logical approach for the exchange of feelings on various social media platforms. The text's emotions have been analyzed with integrated grammar, annotation, the creation of lexicons and semantic networks. Within [11] the fundamental techniques for the classification of feelings and the collection of data are discussed. For the domain of electronic products, the accuracy of the classification process with the select vector function is checked with different classifiers such as Naive Bayes, Support Vector Machine (SVM) and so on. In [13], the authors introduced hybrid technology which combines the use of lexicons of the senses in the area of the consumer products with a machine learning classification to detect the polarity of subjective texts. In [14], the authors proposed a batch of methods for machine learning using semantic analysis in order to better understand the sentences and reviews of the different products using WordNet based on twitter info. In [15] the writers developed a technique for normalizing and classifying the tweets according to their polarity, i.e. positive or negative. In addition, a mixed model approach was used to generate different sentimental words. The words generated were used later in the classification model as feature indicators. In [17] authors examined many combinations of various pre-processing levels, machine learning techniques, and features combined with a research neutral class the real-time student's experiences. Authors introduced a new way of forecasting stocks feelings with a variety of monetary statement boards and made automated predictions of the stock market with web feeling in [16]. In [18], authors developed an improved sentiment classification method which can detect Twitter anomalies and eliminate data in addition to the classification. In [20], the authors collected the tweets and considered as data which really helped them in similar distant learning paradigm for setting a model for analysis. They perform classification of task such as subjective, objective. For subjective the information was fetched from the user tweets by means of text or image or symbols. For objective information the information was obtained from verification of the data such as from newspapers. In the past year there have been numerous documents observing the Twitter sentiment and buzz [19], [20], [21]. Further, scientists have started to discover the usage of part-of-speech structures but results remain mixed. It has enormous interesting chances to develop many more innovative applications, because success of many businesses depend on accessible information via online sources such as blogs, twitter and other social networks. In [21], A sentimental classification on Twitter data was analyzed by the authors. The tweeting test data have been collected, some syntactic characteristics have been taken for analyzing symbols, re-tweets, emoticons, tags, connection, punctuation and exclamations for identifying the polarity of words. The authors evaluated the details in [23] using the lexical database. Definition of lexemes is the lexical database. The database is lexical like WordNet. The emotional meaning of a term can be found here. The distance metric of words are used by the authors and analyzed the polarity of sentiments on feedback data from the Global Support Services survey
and determined semantic polarity of adjectives. They have used queries to identify the role of features like Part of Speech tags. The accuracy of classifier can be obtained by some factors such as feature selection, testing data and demonstrate the abstract linguistic analysis feature for accuracy of data. In [24], the authors have done analysis on twitter data for election. It indicates the popularity of political parties and candidates contesting the election based on positive tweets. This system uses Naïve Bayes classifier algorithm to classify the positive and negative tweets. In [26] the authors of this paper VLS have compared the tweetdata set under machine learning and deep learning architectures. In machine learning they compared the data with Naïve Bayes and Random Forest(RF) Algorithms and found that Naïve bayes is performing better than RF. Even though RF is proved to be efficient for huge data sets, when applied for the twitter data set it did not perform effectively. In neural networks, Convolution Neural Networks (CNN) is implemented on the dataset and is found that Naïve bayes and CNN are producing almost equivalent results. Hence in this paper an approach based on Adaptive Random Forest (ARF) [27] Machine learning techniques are very useful for automating intrusion detection systems in critical infrastructures. A machine learning technique called Adaptive Random Forest (ARF) algorithm is proposed based on standard random forest algorithm. Is proposed and implemented.
3. PROPOSED METHODOLOGY (VLS):
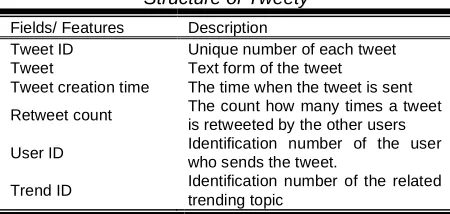
Sentiment Analysis, also referred to as "Opinion Mining" is the use of the Natural Language Processing to evaluate the attitudes, opinions and emotions of an individual, writer or sentiments related to various subjects. In this paper, a new algorithm Various #tags Live tweets Sentiment analysis)VLS), also termed after the authors (Vinod Kumar, Lalitha Bhaskari, Srinivasa Rao) is proposed based on adaptive random forest (ARF) [27] algorithm and implemented. In this approach the tweets are imported from the Twitter using the application programming interface (API) provided by Twitter application. From these APIs, the tweet structure (tweety) is captured as shown in Table 1. Various categories of Hashtags are considered for the work in this paper as shown in Table 2. For every Hashtag related to Movies, Sports, Politics, Technology and stock exchange 1000 tweets are considered. The proposed VLS algorithm is implemented on a total of 5000 tweets collected from Twitter API and a total of 1721 Telugu tweets are considered from Sakshi and TV9 which are two regional news channel twitter accounts.
Table 1
Structure of Tweety
Fields/ Features Description
Tweet ID Unique number of each tweet Tweet Text form of the tweet
Tweet creation time The time when the tweet is sent Retweet count The count how many times a tweet
is retweeted by the other users User ID Identification number of the user
who sends the tweet.
All these 5000 tweets for English and 1721 tweets for Telugu were collected from Twiteer API for the purpose of experimentation. Once the tweets are collected, a few additional features like fullname of the user, emojis if any, retweetemoji, retweet time of posting, number of likes,
number of shares and language used are also collected and added to feature list as shown below in table 3.
Table 2
Various Hash tags collected from Twitter API
Based on these selected features, the proposed VLS algorithm is applied. In general, there are three possible ways to collect Tweets through
1. Information sources such as UCI, Kdnuggets and SNAP
2. Twitter has two types of APIs such as a gateway to software search applications and an interface to system stream applications. Using the Search Program Interface, Twitter data is collected on a hashtag basis and a stream programming interface is used to stream Twitter data in real time.
3. Comprehensive tools classified as premium tools, such as Radian6, Sysmos, and SocialMention[25].
For this work, approach 2 is adopted to collect tweets and VLS algorithm is proposed and implemented to find the polarity of the tweet such as positive, and negative for the tweet data.
VLS Algorithm:
Figure 1 shows the steps to carry out the process of sentiment analysis on live Twitter data by using VLS algorithm
Table 3 Features List
Name of the Hash Tag
No of Tweets collected
Language of Tweets
#Movies 1000 English
#Sports 1000 English
#Politics 1000 English
#Technology 1000 English
#Stockexchange 1000 English
Sakshi 1383 Telugu
TV9 338 Telugu
S.No Feature Description
1 Tweet ID Unique number of each tweet
2 Tweet Text form of the tweet 3 Tweet time creation The time when the tweet is sent
4 Retweet count The count how many times a tweet is retweeted by the other users
5 User ID Identification number of the user who sends the tweet.
6 Trend ID Identification number of the related trending topic
7 Full name of the user A personal/Pet name of the User
8 Emoji’s Emoji are ideograms and smileys used in Twitter messages 9 Rweet emoji’s Reply with ideograms and smileys
10 Rtweet time of
posting The time when the Retweet is post
11 Likes Liking a Tweet indicates that you appreciate it. You can find all of your likes by clicking or tapping the Likes tab on your profile
12 shares The act of sharing another account's Tweet to all of your followers by clicking or tapping on the Retweet button
Figure 1: Proposed VLS Frame work
Table 4 Training and Test Data sets for VLS algorithm evaluation
Algorithm: VLS
Input: Live tweets from twitter
Output: identifying sentiments (positive, negative)
STEP 1: Data collection Collect the tweets from Twitter along with emojis STEP 2: Data preprocessing. Add emojis also from the tweets
STEP 3: Assign weights to the textual tweets based on the semantics STEP 4: Assign weights to the emojis
STEP 4: Construct Tree(T) in a sequential manner based on the weights and rules framed to assign weights to the tweet samples 4.1: weight of a sample is only updated if the sample is an out-of-bag sample and misclassified by the most recent sub-forest. STEP 5: Calculate the latest weights of each sample and update the Tree(T).
STEP 6: Calculate the polarity of set of tweets based on the generated Tree(T).
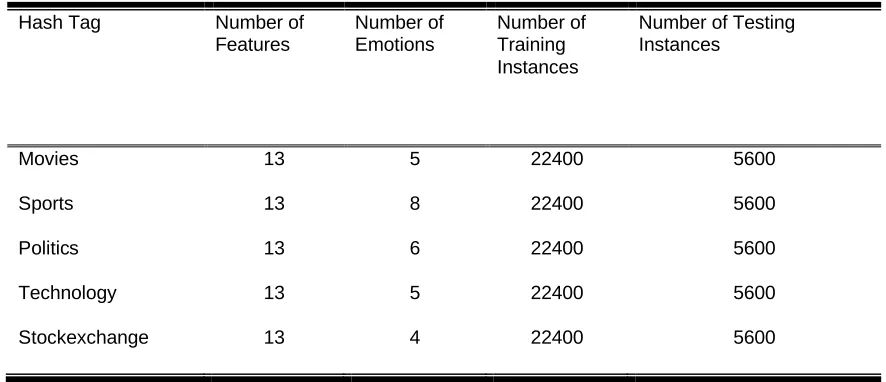
Hash Tag Number of
Features
Number of Emotions
Number of Training Instances
Number of Testing Instances
Movies 13 5 22400 5600
Sports 13 8 22400 5600
Politics 13 6 22400 5600
Technology 13 5 22400 5600
4.
EXPERIMENT
RESULTS
AND
COMPARATIVE ANALYSIS
In order to find out the polarity of the twitter data, that is to identify the positive and negative sentiment count, we have taken tweets from Twitter and applied our proposed VLS algorithm and Naive Bayes and CNN. Live tweets on Movies, Sports, Technology, Politics and Stock Exchange were considered for the experimentation purpose. The live tweets were captured during the month of December 2019 on three different days and times. The following tables and figures depicts that the comparative analysis of Naïve Bayes, CNN and VLS algorithm. After applying these algorithms on Twitter data we found that the proposed VLS algorithm provides more accuracy rather than the existing algorithms.
4.1 Naïve Bayes
Naive Bayes class of test data set is easy and quick to predict. It also works well in the prediction of multiple classes. The following table depicts the positive and negative count of the twitter hash tags.
Table 5 Positive and Negative score for Naivebayes
classification on Twitter data #Movies, #Sports,
#Technology, #Politics, #Stockexchange
Figure 2 Bar chart for Naivebayes classification on Twitter data of
#Movies,#Sports,#Technology,#Politics,#Stockexchange
4.2 Convolution Neural Network
The term convolution refers to the integration of two mathematical functions in order to produce a third one. Two sets of knowledge are mixed. In the case of a CNN, the input data are transformed using a filter or kernel, which then generates a function map. By sliding the filter over the input, we perform a convolution. After applying the CNN on numerous hashtags to find the polarity, the following table and graph depicts the results of twitter data.
Table 6 Positive and Negative score for CNN on Twitter
data of #Movies, #Sports, #Technology, #Politics, #Stockexchange
Figure 3 Bar chart for CNN on Twitter data of #Movies,#Sports,#Technology,#Politics,#Stockexchange
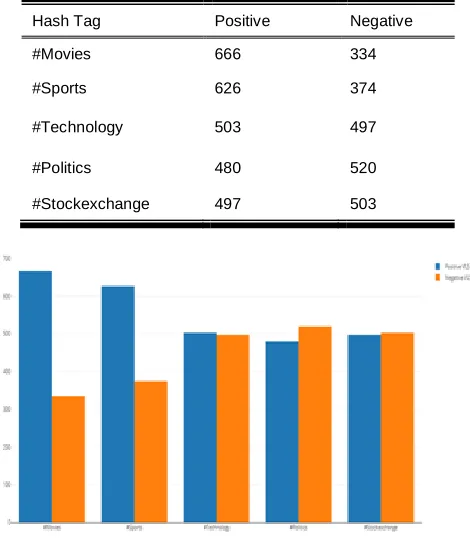
4.3 VLS Algorithm
In order to find out the polarity of the twitter data, that is to identify the positive and negative sentiment count, we have taken tweets from Twitter and applied our proposed VLS algorithm. We took the twitter data such as Movies, Sports, Technology, Politics and stock exchange. The below table shows the positive and negative counts for each hashtag after applying our VLS algorithm.
Hash Tag Positive Negative
#Movies 740 260
#Sports 617 383
#Politics 709 291
#Technology 527 473
#Stockexchange 366 634
Hash Tag Positive Negative
#Movies 920 80
#Sports 789 211
#Politics 949 51
#Technology 617 383
Table 7 VLS Algorithm on
#Movies,#Sports,#Technology,#Politics, #Stockexchange
Hash Tag Positive Negative
#Movies 666 334
#Sports 626 374
#Technology 503 497
#Politics 480 520
#Stockexchange 497 503
Figure 4 Bar chart for VLS on Twitter data of #Movies,#Sports,#Technology,#Politics,#Stockexchange
After performing the analysis of numerous domains such as Movies, Sports, Politics, Technology and Stock Exchange tweet data from Twitter, we found out that our proposed algorithm works rather efficiently than Naive Bayes and CNN. One reason could be that emojis also are taken into consideration. The following table shows the experimental results on twitter data.
Table 8 Comparative Analysis on Twitter data by using
Naïve Bayes, CNN and VLS Algorithms
Figure 5 Bar plot for Comparative Analysis on Twitter data
by using Naïve Bayes, CNN and VLS Algorithms
A comparison among the three was performed to calculate the accuracy on twitter data set and it is observed that the proposed VLS algorithm produces better accuracy than the other two as shown in the Table 9.
Table 9 Snapshot of Accuracy test results of Naïve Bayes,
CNN and VLS.
5. CONCLUSION
In this paper, first we have presented the detailed procedure to conduct sentiment analysis method in a positive or negative manner to identify highly unstructured Twitter data categories. We have done sentiment analysis on Twitter data using Naïve Bayes method and Random Forest method in Machine learning and CNN method for Depp learning. During our tests, we observed that Naïve Bayes and CNN methods produced faster and better results. After this, we executed our proposed VLS method on the same data. VLS method produced even better results when compared to Naïve Bayes and CNN methods. Hence, the future opportunities include creating a technology in the field of sentiment analysis to conduct classification of sentiments that can be applicable to any data regardless of domain. In addition, language diversity in social media data is a key issue which is required to be eliminated in future. After preforming polarity and finding accuracy by using Naïve Bayes, CNN and VLS, we concluded that the VLS algorithm produces more efficient and accurate than the existing algorithms.
Classifier
used Naive Bayes
Convolution Neural
Network VLS Algorithm Hash
Tags Positive Neg ativ
e
Positive Negative Positive Negative #Movies 73.7% 26.3
% 68.0% 32.0% 66.6 33.4 #Sports 65.9% 34.1
% 67.9% 32.1% 62.6 37.4 #Politics 53.6% 46.4
% 56.3% 43.7% 50.3 49.7 #Technol
ogy 65.2%
34.8
% 79.6% 20.4% 48.0 52.0 #Stockex
change 10.0% 90.0
% 14.0% 86.0% 49.7 50.3
S.No Model Accuracy
1 Naïve Bayes 0.7824443714360663 2 Convolutional Neural
Network 0.498
REFERENCES
[1]. I. King, J. Li and K. T. Chan, “A Brief Survey of Computational Approaches in Social Computing”, in Proc. of Int. Joint Conf. on Neural Network, 2009, pp. 2699-2706.
[2]. S. R. Barahate and V. M. Shelake, “A Survey and Future Vision of Data mining in Educational Field”, in Proc. 2nd Int. Conf. on Advanced Computing & Communication Technology, 2012, pp. 96-100. [3]. Bing Liu, N. Indurkhya and F. J. Damerau, Handbook
of Natural Language Processing, Second Edition, 2010, pp. 1-3860-68.
[4]. X. Chen, M. Vorvoreanu and K. Madhavan, “Mining Social Media Data to Understand Students’ Learning Experiences”, IEEE Transaction, 2014, vol. 7, no. 3, pp. 246-259.
[5]. Weil, Kevin (VP of Product for Revenue and former Big Data engineer, Twitter Inc.), "Measuring Tweets." Twitter Official Blog, February 22, 2010. [Online]. Available: http://www.internetlivestats.com/twitter-statistics. [Accessed: 19-Oct-2015].
[6]. Krikorian, Raffi (VP, Platform Engineering, Twitter Inc.), "New Tweets per second record, and how!" Twitter Official Blog. August 16, 2013.[Online]. Available: https:// blog.twitter.com/ 2013/ new-tweets-per- second-record-and-how. [Accessed: 19-Oct-2015].
[7]. Twitter Engineering, "200 million Tweets per day." Twitter Official Blog. June 30, 2011. [Online]. Available: https://blog.twitter.com/2011/200-million-tweets-per-day. [Accessed: 19-Oct-2015].
[8]. “Three Cool and Inexpensive Tools to Track Twitter Hashtags”, June 11, 2013. [Online]. Available
http://dannybrown.me/2013/06/11/three-cool-toolstwitterhashtags/ [Accessed: 19-Oct-2015]. [9]. "Twitter turns six." Twitter Official Blog. March 21,
2012. [Online]. Available:
https://blog.twitter.com/2012/twitter-turns-six. [Accessed: 19-Oct-2015].
[10]. N. Kasture and P. Bhilare, “An Approach for Sentiment analysis on social networking sites”, Computing Communication Control and Automation (ICCUBEA), 2015, pp. 390-395.
[11]. S. Bhuta, A. Doshi, U. Doshi and M. Narvekar, “A review of techniques for sentiment analysis Of Twitter data”, Issues and Challenges in Intelligent Computing Techniques (ICICT), 2014, pp. 583-591.
[12]. M. S. Neethu and R. Rajasree, “Sentiment Analysis in Twitter using Machine Learning Techniques”, in 4th Int. Conf. of Computing, Communications and Networking Technologies (ICCCNT), 2013, pp. 1-5. [13]. S. Bahrainian and A. Dangel, “Sentiment Analysis
using Sentiment Features”, in Int. joint Conf. of Web Intelligence and Intelligent Agent Technologies, 2013, pp. 26-29.
[14]. G. Gautam and D. Yadav, “Sentiment analysis of twitter data using machine learning approaches and semantic analysis”, in 7th Int. Conf. on Contemporary Computing, 2014, pp. 437-442.
[15]. A. Celikyilmaz, D. Hakkani-Tur and JunlanFeng, “Probabilistic model-based sentiment analysis of
twitter messages”, IEEE Spoken Language Technology Workshop (SLT), 2010, pp. 79-84.
[16]. V. Sehgal and C. Song, “SOPS: Stock Prediction Using Web Sentiment”, in 7th IEEE Int. Conf. on Data Mining Workshop, 2007, pp. 21-26.
[17]. N. Altrabsheh, M. Cocea and S. Fallahkhair, “Sentiment analysis: towards a tool for analysing real-time students feedback”, in 26th International Conference on Tools with Artificial Intelligence, 2014, pp. 420-423.
[18]. Z. WANG, V. J. Chuan TONG, X. XIN and H. C. CHIN, “Anomaly Detection through Enhanced Sentiment Analysis on Social Media Data”, in 6th International Conference on Cloud Computing Technology and Science, 2014, pp. 918-922.
[19]. Jansen,B.J.; Zhang,M.; Sobel,K.; and Chowdury,A. (2009), “Twitterpower: Tweets as electronic word of mouth”, Journal of the American Society for Information Science and Technology 60(11):2169– 2188.
[20]. Pak, A., and Paroubek, P (2010), “Twitter as a corpus for sentiment analysis and opinion mining”. In Proc. of LREC.
[21]. Wilson, T. Wiebe, J.; and Hoffmann, (P. 2009),”Recognizing contextual polarity: An exploration of features for phrase-level sentiment analysis. Computational Li nguistics”, 35(3):399–433.
[22]. David Zimbra, M. Ghiassi and Sean Lee, “Brand-Related Twitter Sentiment Analysis using Feature Engineering and the Dynamic Architecture for Artificial Neural Networks”, IEEE 1530-1605, 2016.
[23]. MondherBouazizi and TomoakiOhtsuki, “Sentiment Analysis: from Binary to Multi-Class Classification”, IEEE ICC 2016 SAC Social Networking, ISBN 978-1-4799-6664-6.
[24]. “Geospatially and literally analysing tweets”, Journal of Advanced Research in Dynamical and Control Systems Volume 9, Issue Special Issue 14, 2017, Pages 1002-1009
[25]. B. Gokulakrishnan, P. Plavnathan, R. Thiruchittampalam, A. Perera and N. Prasath, “Opinion Mining and Sentiment Analysis on aTwitter Data Stream”, in Int. Conf. on Advances in ICT for Engineering Regions, 2012, pp. 182-188.
[26]. CH. Rayala Vinod Kumar, D. Lalitha Bhaskari and P. Srinivasa Rao ,”Comparison of Sentiment Analysis on Various Twitter #Tags Using Machine Learning and Deep Learning Techniques”, Journal of Advanced Research in Dynamical and Control, IISN:1943-023X Volume 11 , 04-Special Issue, Pages: 23-31.
[27]. Abebe Tesfahun, and D. Lalitha Bhaskari, “Adaptive Random Forest based Intrusion Detection System for SCADA Networks.” International journal of Critical infrastructure Protection, Elsevier