Open Access Journal of Sports Medicine
Age of peak performance in elite male and
female Ironman triathletes competing in Ironman
Switzerland, a qualifier for the Ironman world
championship, Ironman Hawaii, from 1995 to 2011
Christoph Alexander Rüst1 Beat Knechtle1,2
Patrizia Knechtle2
Thomas Rosemann1
Romuald Lepers3
1Institute of General Practice and for
Health Services Research, University of Zurich, 2Gesundheitszentrum
St Gallen, St Gallen, Switzerland;
3INSERM U1093, Faculty of Sport
Sciences, University of Burgundy, Dijon, France
Correspondence: Beat Knechtle Facharzt FMH für Allgemeinmedizin, Gesundheitszentrum St Gallen, Vadianstrasse 26, 9001 St Gallen, Switzerland
Tel +41 07 1226 8282 Fax +41 07 1226 8272 Email beat.knechtle@hispeed.ch
Background: The age of peak performance in elite endurance athletes has been investigated for elite marathoners, but not for elite Ironman triathletes. The aim of this study was to analyze the age of peak performance in swimming (3.8 km), cycling (180 km), running (42 km), and overall race time for elite female and male Ironman triathletes competing in Ironman Switzerland, a qualifier for the Ironman world championship, known as the Ironman Hawaii.
Methods: The age of the annual top ten overall swimmers, cyclists, runners, and annual overall finishers for both male and female elite triathletes and their corresponding split and overall race times at the Ironman Switzerland were analyzed between 1995 and 2011.
Results: The mean age of the elite Ironman triathletes was 33 ± 3 years for men and 34 ± 4 years for women. For women, the age of peak performance was not significantly different between the three disciplines (P. 0.05), while for men, the best swimmers (29 ± 3 years) were significantly (P, 0.05) younger than the best runners (35 ± 5 years). During the study period, the age of peak performance remained unchanged for men at 31 ± 3 years (P. 0.05), but increased for women from 30 ± 4 years in 1995 to 36 ± 5 years in 2011 (P, 0.01).
Conclusion: Although both women and men improved their overall race times during the 1995–2011 period, the age of peak performance was similar between women and men in the three disciplines and in overall race time. Future studies need to examine the change in age of peak performance across years in the Ironman Hawaii world championship event.
Keywords: gender difference, swimming, cycling, running, ultraendurance
Introduction
An age-related decline in performance has been described for different endurance
disciplines, including swimming,1–3 running,4–6 and multisports disciplines such as
the duathlon7 and triathlon over different distances.8–15 Generally, endurance
perfor-mance peaks between 35 and 40 years.2,3 After the age of 40–50 years, endurance
performance starts to decrease.2,3,6 This lowering in performance is moderate until
the age of 70 years, after which the decrease in endurance performance becomes exponential.2,3
Regarding the triathlon, age-related decline in performance has been investigated for the short or Olympic distance triathlon (1.5 km swimming, 40 km cycling, and 10 km
running),8 the half-Ironman triathlon (1.9 km swimming, 90 km cycling, and 21.1 km
running),15 and the Ironman triathlon (3.8 km swimming, 180 km cycling, and
42.195 km running).9–13 The age-related decrement in triathlon performance is specific
Dove
press
O R I G I N A L R E S E A R C H
open access to scientific and medical research
Open Access Full Text Article
Open Access Journal of Sports Medicine downloaded from https://www.dovepress.com/ by 118.70.13.36 on 26-Aug-2020
For personal use only.
Number of times this article has been viewed
This article was published in the following Dove Press journal: Open Access Journal of Sports Medicine
to the discipline, with cycling showing a slower regression in
performance with age than swimming and running.8,10,14
For elite athletes, the age of peak performance15,16 is
probably of higher interest than the age-related decline in performance8–14 or the performance of master athletes.12,13 For
example, knowing the age of the best endurance performance can be useful in a sports career when it comes to planning highlights such as the Olympic Games or the world cham-pionships for elite athletes. Regarding the existing literature for endurance athletes, the age of peak performance for elite athletes appears to be different between different endurance disciplines. For elite swimmers, Schulz and Curnow described
the age of peak performance as being about 20 years.16 In
contrast, the age of peak performance for elite marathoners was reported to be approximately 28 years16 and 30 years.17
Female triathletes competing in the half-Ironman achieved their fastest race times at the age of 25–39 years whereas male triathletes were fastest at the age of 18–39 years.15 For
mountain ultramarathoners, top female runners achieved their fastest race time at 34.4 ± 2.5 years and top male runners at 33.9 ± 4.2 years.18
For the Ironman triathlon, recent studies reported that master athletes increased their participation and improved their performance across years.12,13 In addition, Lepers and
Maffiuletti reported that the fastest Ironman race times were achieved in the age groups 30–34 years and 35–39 years for
men and 25–29 years and 30–34 years for women.11 However,
no study has investigated the age of peak performance for elite Ironman triathletes in contrast with elite marathoners.17
The aim of the present study was to analyze the age of peak performance in swimming, cycling, and running, as well as overall race time for both elite male and female Ironman triathletes. Given that Ironman triathletes have to run a marathon at the end of the race, we hypothesized that the age of peak performance would be close to 30 years for both female and male elite Ironman triathletes, as had been previously reported for elite marathoners.17 Considering the
fact that the age of peak performance differed between elite
swimmers16 and elite marathoners,17 one might assume that
the age of peak performance would be different between the three split disciplines in an Ironman triathlon. We also hypothesized that the fastest swimmers would be younger than the fastest marathoners in an Ironman triathlon.
Materials and methods
The changes in age and both split and overall race times of all triathletes finishing Ironman Switzerland between 1995 and 2011 were analyzed. The data set from this study was
obtained from the Ironman Switzerland race website.19 The
study was approved by the institutional review board of St Gallen, Switzerland, with a waiver of the requirement for informed consent, given that the study involved analysis of publicly available data.
Data from 19,389 athletes, including 2051 women and 17,338 men who successfully finished Ironman Switzerland between 1995 and 2011, were available and could be included in the analysis. The age and performance of the ten fastest women and men for overall finishers as well as the ten fastest women and men in the three disciplines of swimming, cycling, and running were determined for each year (i.e. 17 years of duration, 4 times (3 split times and over-all race time), 2 genders, and 10 athletes (top ten athletes) leads to n = 17 × 4 × 2 × 10 = 1360).
Statistical analysis
In order to increase the reliability of data analysis, each set of data was tested for homogeneity of variance prior to statistical analysis using Levene’s test in the event of two groups and Bartlett’s test in the event of more than two groups. Linear regression was used to test for significant changes in the variable over the years of the study. To detect differences between two groups, a Student’s t-test was used, and one-way analysis of variance with subsequent Tukey-Kramer post hoc analysis was performed to find differences between more than two groups. To identify differences between the ages of peak performance in the different disciplines, a year-by-year analysis was performed using a two-way analysis of variance with subsequent Bonferroni post hoc analysis. Statistical analyses were performed using the Statistical Package for the Social Sciences version 19 (SPSS Inc, Chicago, IL) and GraphPad Prism (Version 5, GraphPad Software, La Jolla, CA). Statistical significance was accepted at P , 0.05 (two-sided for t-tests). Data in the text are given as the mean ± standard deviation.
Results
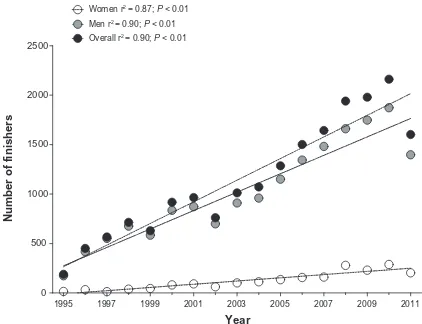
During the 17 years from 1995 to 2011, a total of 19,389 athletes completed Ironman Switzerland. Women accounted for 10.6% of all finishers. During the study period, the par-ticipation of both women and men increased (Figure 1). In 1995, 15 women and 174 men finished, whereas in 2011,
204 women (+1260%) and 1398 men (+703%) finished.
Regarding the ten overall fastest women over the 17-year period (Table 1), the age of peak performance was not sig-nificantly different between the three split disciplines and overall race time. The top ten male swimmers were aged
Dovepress
Rüst et al
Open Access Journal of Sports Medicine downloaded from https://www.dovepress.com/ by 118.70.13.36 on 26-Aug-2020
29 ± 3 years and were significantly (P , 0.05) younger than
the top ten male runners who were aged 35 ± 5 years. The
overall top ten women and men showed no difference in age of peak performance in any of the split times or overall race time (P . 0.05).
Figure 2 shows the development of overall race time (A) and age (B) across years for both women and men. The overall top ten women improved their overall race time significantly (P , 0.01) by 12.7% from 678 ± 34 minutes in
1995 to 592 ± 27 minutes in 2011. The overall top ten men
improved their overall race time significantly (P= 0.03) by
6.4% from 559 ± 15 minutes in 1995 to 523 ± 15 minutes
in 2011. During the 1995–2011 period, the age of the top
ten women increased significantly (P , 0.01) from 30 ± 4
years in 1995 to 36 ± 5 years in 2011. However, the mean
age of the top ten men remained unchanged (P . 0.05) at
31 ± 3 years.
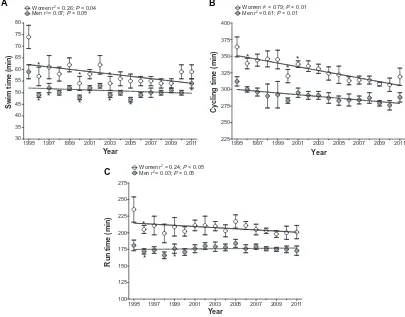
In swimming, the top ten female swimmers improved their split time significantly (P= 0.04) over the 17-year period by 20.3%, from 74 ± 5 minutes in 1995 to 59 ± 3 minutes in 2011 (Figure 3A). The age of the top ten female swimmers increased significantly (P , 0.01) by 16.7% across the years
from 30 ± 3 years in 1995 to 35 ± 4 years in 2011 (Figure 4A). In contrast, the top ten male swimmers did not improve (P . 0.05) their swim time across the years (47 ± 1 minutes). The mean age of the male top ten swimmers remained stable (P . 0.05) at 30 ± 5 years.
For cycling, the top ten women improved their split time significantly (P , 0.01) by 12.4% from 364 ± 15 minutes to
319 ± 13 minutes (Figure 3B). The top ten men also improved
their cycling time significantly (P , 0.01) by 7.7% from
312 ± 7 minutes to 288 ± 7 minutes over the years of the
study. The age of the top ten cyclists increased significantly
(P , 0.01) by 13.3% for women, from 30 ± 4 years in 1995
to 34 ± 4 years in 2011, and significantly (P , 0.01) by 6.5% for men, from 31 ± 4 years in 1995 to 33 ± 6 years in 2011 (Figure 4B).
The top ten female runners improved their marathon time
significantly (P , 0.05) by 14.5%, from 235 ± 19 minutes
in 1995 to 201 ± 10 minutes in 2011 (Figure 3C). The ten
fastest male running times remained unchanged (P . 0.05) at
161 ± 2 minutes. The age of the top ten female marathoners
increased significantly (P , 0.01) by 6.5%, from 31 ± 5 years in 1995 to 33 ± 7 years in 2011 (Figure 4C). In contrast, the age of the top ten male marathoners remained unchanged (P . 0.05) at 31 ± 4 years.
Discussion
This study analyzed the age of peak performance in swim-ming, cycling, and running, as well as overall race time for male and female elite Ironman triathletes competing in Ironman Switzerland, a qualifier for Ironman Hawaii. It was hypothesized that the age of peak performance would be close to 30 years for both female and male elite Ironman triathletes. The results show that the age of peak performance of approximately 33–34 years was not different between women and men. Elite male marathoners were about 3 years younger and elite female marathoners about 4 years younger than the present elite Ironman triathletes.17 This finding
sug-gests that elite Ironman triathletes need more experience than marathoners to perform at a high level. It has been shown that a fast personal best marathon time was a strong
predic-tor variable for a fast Ironman race time for both male20,21
and female22 Ironman triathletes. Elite Ironman triathletes
probably need time to gain adequate experience for a fast Ironman race time. Furthermore, the Ironman triathlon is not an Olympic event, so the athlete profile may be influenced by this fact. Taking in consideration that many grants and financial considerations arise for athletes when they are competing in an Olympic event for their country, at this
1995 1997 1999 2001 2003 2005 2007 2009 2011
0 500 1000 1500 2000 2500
Women r2 = 0.87; P < 0.01
Men r2 = 0.90; P < 0.01
Overall r2 = 0.90; P < 0.01
Year
Number of finishers
Figure 1 Annual number of male, female, and all finishers in Ironman Switzerland from 1995 to 2011.
Table 1 Mean age and performance times of the top ten male and female performers over the 17-year study period
Women Men
Age (years)
Time (min)
Age (years)
Time (minutes)
Swimming 31 ± 4 50 ± 1 29 ± 3* 47 ± 1 Cycling 34 ± 3 298 ± 8 31 ± 4 263 ± 13#
Running 32 ± 6 184 ± 5 35 ± 5 161 ± 2#
Overall race time 34 ± 4 555 ± 9 33 ± 3 497 ± 4#
Notes: *Significantly different from running split time for men; #significantly different between women and men.
Dovepress Age of peak performance in Ironman triathlon
Open Access Journal of Sports Medicine downloaded from https://www.dovepress.com/ by 118.70.13.36 on 26-Aug-2020
1995 1997 1999 2001 2003 2005 2007 2009 2011 400
450 500 550 600 650 700 750
A Women r2 = 0.60; P < 0.01 B
Men r2 = 0.28; P = 0.03
*
*
*
*
Year
Total race time (min
)
1995 1997 1999 2001 2003 2005 2007 2009 2011 20
25 30 35 40 45
Women r2 = 0.53; P < 0.01
Men r2 = 0.16; P > 0.05
Year
Age (years
)
Figure 2 (A) Changes in overall race time of the top ten overall male and female triathletes between 1995 and 2011. (B) Changes in age of top ten overall male and female triathletes from 1995 to 2011.
Note: *Significantly different from the previous race.
1995 1997 1999 2001 2003 2005 2007 2009 2011 30
35 40 45 50 55 60 65 70 75 80
*
* * *
* *
*
* * *
Year
S
w
im
t
im
e
(m
in
)
1995 1997 1999 2001 2003 2005 2007 2009 2011 225
250 275 300 325 350 375 400
*
* *
Year
C
yc
lin
g
tim
e
(m
in
)
1995 1997 1999 2001 2003 2005 2007 2009 2011 100
125 150 175 200 225 250 275
*
* *
Year
R
un
t
im
e
(m
in
)
Women r2 = 0.79; P < 0.01
Men r2 = 0.61; P < 0.01
Women r2 = 0.24; P < 0.05
Men r2 = 0.03; P > 0.05
Women r2 = 0.26; P = 0.04
Men r2 = 0.07; P > 0.05
A B
C
Figure 3 Top ten overall times across years for swimming (A), cycling (B), and running (C) for both women and men.
Note: *Significantly different from the previous race.
point, their economic and marital status should be taken into consideration for further study.
During the study period, the age of the top ten female
triathletes increased from 30 ± 4 years in 1995 to 36 ± 5
years in 2011, whereas the age of the top ten male triath-letes remained unchanged at 31 ± 3 years. Although the
age of elite women increased, they improved their overall race time. Similarly, the age of both the top ten female swimmers and the top ten female marathoners increased, although they became faster. However, these trends were not observed for men. An important aspect is the low female participation in the Ironman triathlon.9 Although female
Dovepress
Rüst et al
Open Access Journal of Sports Medicine downloaded from https://www.dovepress.com/ by 118.70.13.36 on 26-Aug-2020
participation in Ironman Switzerland has increased over the years, women accounted for only 10.6% of finishers. Generally, participation of women in ultraendurance dis-tances is very low compared with men.9,23–25 We assume that
the increase in age and improvement in performance for elite female triathletes might be explained by both motivational and social factors. Most probably, women have a different approach to ultraendurance performance, which is also reflected in the rather low female participation. Considering the motivation of women participating in ultraendurance performance, Krouse et al described female ultramarathoners as task-oriented, internally motivated, healthy, and financially aware individuals.26 Familiar social factors might also be
con-sidered as an explanation for the findings in women. Ironman
Switzerland is dominated by Swiss and German triathletes.27
The mean age of Swiss women at birth of their first child has increased since 1975. The age at first birth was 30.7 years in 2006 and increased to 31.2 years in 2010.28 After the age of
44 years, a significant increased incidence of cesarean section,
pregnancy-induced hypertension, gestational diabetes, and perinatal mortality has been reported.29
Race preparation is another aspect that needs consideration. Both female and male Ironman triathletes need time to train.30
Elite female athletes might have either borne children or remained childless and worked. A woman occupied with both family and a part-time job would not have enough time to train seriously for an Ironman triathlon. Given that both a fast personal best time in an Olympic distance triathlon and in a marathon were strong predictor variables for female Ironman triathletes,22 elite female Ironman triathletes would need
time to gain experience in both the triathlon and marathon to achieve the level of an elite Ironman triathlete. This might explain the increase in the age of peak performance across years. It would be interesting to examine further the effect of family status on the performance of elite female triathletes.
Between 1995 and 2011, both the top ten women and the top ten men improved their overall race time, with a greater percentage of women improving than men. In addition,
1995 1997 1999 2001 2003 2005 2007 2009 2011
20 25 30 35 40 45
Women r2 = 0.39; P < 0.01
Men r2 = 0.22; P > 0.05 Women r
2 = 0.42; P < 0.01
Men r2 = 0.53; P < 0.01
Year
A
g
e
(y
ea
rs
)
1995 1997 1999 2001 2003 2005 2007 2009 2011
20 25 30 35 40 45
Year
A
g
e
(y
ea
rs
)
1995 1997 1999 2001 2003 2005 2007 2009 2011
20 25 30 35 40 45
Year
A
g
e
(y
ea
rs
)
Women r2 = 0.38; P < 0.01
Men r2 = 0.12; P > 0.05
A B
C
Figure 4 Age of top ten men and women overall for swimming (A), cycling (B), and running (C).
Dovepress Age of peak performance in Ironman triathlon
Open Access Journal of Sports Medicine downloaded from https://www.dovepress.com/ by 118.70.13.36 on 26-Aug-2020
the top ten women improved their split times in the three disciplines, whereas the top ten men improved their cycling time. We found a faster race time in 1996 and 2000 com-pared with the preceding year. Olympic Games were held in 1996 in Atlanta and in 2000 in Sydney. Most likely, it was a coincidence that fast Ironman race times were achieved in these years. Improvements in the bike split for both genders are likely due to the development of technical equipment over the years. During an Ironman triathlon, drafting is for-bidden31 and aerodynamic resistance is the major resistance
force the racing cyclists must overcome.32 The configuration
of the bicycle and body position during cycling are important factors for a fast cycling time in a nondrafting race.33 During
the time period 1995–2011, women had probably the same access to race bikes as men. Therefore, reasons other than
technical aspects, such as anthropometric characteristics,34
might be needed to explain the difference between men and women.
An important finding was that the age of peak perfor-mance was younger for the best swimmers than for the best runners in men but not in women. The age of peak swim performance has been investigated in freestyle swimmers for distances ranging from 50 m to 1500 m and also for ultradistances. The age of peak swim performance seems to depend upon both gender and swim distance.3,16,35–37 The age
of peak swim performance was reported to be about 21 years by Berthelot et al when 12 events were chosen in long-course pool freestyle swimming (ie, 50 m, 100 m, 200 m, 400 m,
800 m, and 1500 m for women and men).35 However, other
authors have reported different results. Fairbrother reported that the age of peak swim performance in men for 50 m free-style was achieved in the late 20 s and early 30 s.37 Tanaka
and Seals showed that peak swim performance in 50 m free-style was reached at the age of 20–30 years in both men and
women.3 However, for ultraswimmers, the best performance
was reached in the age group 30–39 years by both women
and men in a 12-hour indoor ultraswimming event.36
These contrasting findings might be due to the different swim distances examined. Some studies have suggested that a difference may exist in the age of peak swim performance with regard to both swim distance and gender.3,16 Schulz and
Curnow reported that women generally reached their peak swim performance at younger ages than men, especially for
long freestyle distances such as the 800 m and 1500 m.16
These authors showed that, for freestyle swimming in Olympic Gold medalists in the 1896–1980 period, the age of peak freestyle performance for men was about 21 years for 100 m, about 20 years for the 400 m, and about 20 years
for the 1500 m, respectively.16 For women, the peak swim
performance was attained at approximately 19 years for the 100 m, at about 18 years for the 400 m, and at about 16 years for the 800 m.16 In contrast with these findings, Tanaka and
Seals reported that for the 1500 m freestyle, men reached their fastest swim times at the age of 25–40 years, while women
achieved their best performance at the age of 30–35 years.3
For the shorter distances, peak swim performance for the 50 m was attained at the age of 20–30 years for both women and men.3 For runners, the age of peak performance increased
with race distance (ie, 100–800 m) for both women and men, and women generally achieved their peak performance at a younger age.16 However, in elite marathoners, women
achieved peak performance at an older age than men.17
The difference in performance might also be explained by anthropometric characteristics, such as skeletal muscle mass. It has been argued that the increase in gender differences in performance with increasing length of an ultratriathlon could be due to the lower skeletal muscle
mass in women compared with men.24 Male ultraendurance
athletes generally have a higher skeletal muscle mass than their female counterparts.34,38,39 In male Ironman triathletes,
skeletal muscle mass amounted to about 41 kg, which was about 46% higher than the nearly 28 kg of skeletal muscle
mass in female Ironman triathletes.39 For ultrarunners, men
with approximately 38 kg skeletal muscle mass40 had a nearly
38% higher muscle mass compared with women, who had
about 27.4 kg.41 In ultraswimmers, the gender difference in
skeletal muscle mass was considerably higher.42 Men with
about 42 kg of skeletal muscle mass had nearly 45% more skeletal muscle mass compared with women having a skel-etal muscle mass of 29 kg. The higher skelskel-etal muscle mass in men might be an important variable in performance for ultraendurance athletes. The difference in muscle strength between trained women and men can be explained by the size of the muscle mass and not by differences in muscle fiber type
or muscle adaptation.43 Women with a lower lean leg volume
developed lower peak power compared with men.44
This study is limited due to the large difference in athletic performance between men and women, which might have
influenced the data analysis. Data on anthropometry,21,45–49
training,21,45,47,49 previous experience,21,49,50 nutrition,51,52 and
nationality of the athletes27 were lacking, and might have had
an influence on race outcome.
Conclusion
The age of peak overall performance of about 33–34 years was not different between male and female elite Ironman
Dovepress
Rüst et al
Open Access Journal of Sports Medicine downloaded from https://www.dovepress.com/ by 118.70.13.36 on 26-Aug-2020
triathletes, and seemed greater than the age of peak overall performance of marathoners. The age of peak performance was also similar between male and female triathletes in the three disciplines. The age of peak performance was younger for the best swimmers than for the best runners in men, but not in women, suggesting a high performance in endurance swimming might be obtained at a younger age compared with endurance running, at least in men. Future studies should examine the age of peak performance for other ultraendurance disciplines, along with the relation-ship between changes in age of peak performance over the years and changes in the age of the general population and demographics over the years. The age of peak performance in the Ironman world championship, ie, Ironman Hawaii, should also be investigated.
Disclosure
The authors report no conflicts of interest in this work.
References
1. Bongard V, McDermott AY, Dallal GE, Schaefer EJ. Effects of age and gender on physical performance. Age (Dordr). 2007;29: 77–85.
2. Donato AJ, Tench K, Glueck DH, Seals DR, Eskurza I, Tanaka H. Declines in physiological functional capacity with age: a longitudinal study in peak swimming performance. J Appl Physiol. 2003;94: 764–769.
3. Tanaka H, Seals DR. Age and gender interactions in physiological func-tional capacity: insight from swimming performance. J Appl Physiol. 1997;82:846–851.
4. Knechtle B, Rüst CA, Rosemann T, Lepers R. Age-related changes in 100-km ultra-marathon running performance. Age (Dordr). 2012;34: 1033–1045.
5. Lepers R, Cattagni T. Do older athletes reach limits in their performance during marathon running? Age (Dordr). 2012;34:773–781.
6. Leyk D, Erley O, Ridder D, et al. Age-related changes in marathon and half-marathon performances. Int J Sports Med. 2007;28:513–517. 7. Rüst CA, Knechtle B, Knechtle P, et al. Gender difference and
age-related changes in performance at the long-distance duathlon world championships. J Strength Cond Res. March 24, 2012. [Epub ahead of print].
8. Bernard T, Sultana F, Lepers R, Hausswirth C, Brisswalter J. Age-related decline in olympic triathlon performance: effect of locomotion mode. Exp Aging Res. 2010;36:64–78.
9. Lepers R. Analysis of Hawaii ironman performances in elite triathletes from 1981 to 2007. Med Sci Sports Exerc. 2008;40:1828–1834. 10. Lepers R, Sultana F, Bernard T, Hausswirth C, Brisswalter J.
Age-related changes in triathlon performances. Int J Sports Med. 2010;31: 251–256.
11. Lepers R, Maffiuletti NA. Age and gender interactions in ultraendurance performance: insight from the triathlon. Med Sci Sports Exerc. 2011;43:134–139.
12. Lepers R, Rüst CA, Stapley PJ, Knechtle B. Relative improvements in endurance performance with age: evidence from 25 years of Hawaii Ironman racing. Age (Dordr). February 26, 2012. [Epub ahead of print].
13. Stiefel M, Knechtle B, Lepers R. Master triathletes have not reached limits in their Ironman triathlon performance. Scand J Med Sci Sport. May 14, 2012. [Epub ahead of print.]
14. Lepers R, Stapley PJ. Age-related changes in conventional road versus off-road triathlon performance. Eur J Appl Physiol. 2011;111: 1687–1694.
15. Knechtle B, Rüst CA, Rosemann T, Lepers R. Age- and gender-related differences in half-Ironman triathlon performances – the ‘Ironman 70.3 Switzerland’ from 2007 to 2010. Open Access J Sports Med. 2012; 3:59–66.
16. Schulz R, Curnow C. Peak performance and age among superathletes: track and field, swimming, baseball, tennis, and golf. J Gerontol. 1988;43:P113–P120.
17. Hunter SK, Stevens AA, Magennis K, Skelton KW, Fauth M. Is there a sex difference in the age of elite marathon runners? Med Sci Sports Exerc. 2011;43:656–664.
18. Eichenberger E, Knechtle B, Rüst CA, Rosemann T, Lepers R. Age and gender interactions in mountain ultra-marathon running – the ‘Swiss Alpine Marathon’. Open Access J Sports Med. 2012;3:73–80. 19. http://ironmanzurich.com/athletes/results/.
20. Rüst CA, Knechtle B, Knechtle P, Rosemann T, Lepers R. Personal best times in an Olympic distance triathlon and a marathon predict Ironman race time in recreational male triathletes. Open Access J Sports Med. 2011;2:121–129.
21. Knechtle B, Wirth A, Rosemann T. Predictors of race time in male Ironman triathletes: physical characteristics, training or pre race experience? Percept Mot Skills. 2010;111:437–446.
22. Rüst CA, Knechtle B, Wirth A, et al. Personal best times in an Olympic distance triathlon and a marathon predict an Ironman race time for recreational female triathletes, not anthropometric characteristics. Chin J Physiol. 2012;55:156–162.
23. Hoffman MD, Wegelin JA. The Western States 100-mile endurance run: participation and performance trends. Med Sci Sports Exerc. 2009;41:2191–2198.
24. Knechtle B, Knechtle P, Lepers R. Participation and performance trends in ultra-triathlons from 1985 to 2009. Scand J Med Sci Sports. 2011;21:e82–e90.
25. Lenherr R, Knechtle B, Rüst CA, Rosemann T, Lepers R. From double iron to double deca iron ultra-triathlon – a retrospective data analysis from 1985 to 2011. Physical Culture and SportStudies and Research. 2012;54:55–67. http://versita.metapress.com/content/m2m846h781x2-mln3/fulltext.pdf.
26. Krouse RZ, Ransdell LB, Lucas SM, Pritchard ME. Motivation, goal orientation, coaching, and training habits of women ultrarunners. J Strength Cond Res. 2011;25:2835–2842.
27. Jürgens D, Knechtle B, Rüst CA, Knechtle P, Rosemann T, Lepers R. An analysis of participation and performance by nationality at ‘Iron-man Switzerland’ from 1995 to 2011. J Sci Cycling. http://www.jsc-journal.com/ojs/index.php?journal=JSC&page=article&op=view&pa th[]=11.
28. Statistics Switzerland. Population movement – average age of mothers at birth. Available from: http://www.bfs.admin.ch/bfs/portal/de/ index/themen/01/06/blank/key/02/06.html. Accessed September 29, 2012.
29. Schoen C, Rosen T. Maternal and perinatal risks for women over 44 – a review. Maturitas. 2009;64:109–113.
30. Gulbin JP, Gaffney PT. Ultraendurance triathlon participation: typical race preparation of lower level triathletes. J Sports Med Phys Fitness. 1999;39:12–15.
31. Ironman world championship. Rules and regulations. Available from: http://ironmanworldchampionship.com/course/rules-and-regulations. Accessed September 29, 2012.
32. Faria EW, Parker DL, Faria IE. The science of cycling: factors affecting performance – part 2. Sports Med. 2005;35:313–337.
33. Too D. Biomechanics of cycling and factors affecting performance. Sports Med. 1990;10:286–302.
34. Knechtle B, Wirth A, Baumann B, Knechtle P, Rosemann T, Oliver S. Differential correlations between anthropometry, training volume, and performance in male and female Ironman triathletes. J Strength Cond Res. 2010;24:2785–2793.
Dovepress Age of peak performance in Ironman triathlon
Open Access Journal of Sports Medicine downloaded from https://www.dovepress.com/ by 118.70.13.36 on 26-Aug-2020
Open Access Journal of Sports Medicine
Publish your work in this journal
Submit your manuscript here: http://www.dovepress.com/open-access-journal-of-sports-medicine-journal
Open Access Journal of Sports Medicine is an international, peer-reviewed, open access journal publishing original research, reports, reviews and commentaries on all areas of sports medicine. The manuscript management system is completely online and includes a very quick and fair peer-review system.
Visit http://www.dovepress.com/testimonials.php to read real quotes from published authors.
35. Berthelot G, Len S, Hellard P, et al. Exponential growth combined with exponential decline explains lifetime performance evolution in individual and human species. Age (Dordr). 2012;34:1001–1009. 36. Eichenberger E, Knechtle B, Knechtle P, Rüst CA, Rosemann T, Lepers R.
No gender difference in peak performance in ultra-endurance swim-ming performance – analysis of the ‘Zurich 12-h Swim’ from 1996 to 2010. Chin J Physiol. http://www.cps.org.tw/docs/Vol55%20No5E%20 Article%206.pdf.
37. Fairbrother JT. Age-related changes in top-ten men’s US. Masters 50-m freestyle swim times as a function of finishing place. Percept Mot Skills. 2007;105:1289–1293.
38. Knechtle B, Baumann B, Wirth A, Knechtle P, Rosemann T. Male ironman triathletes lose skeletal muscle mass. Asia Pac J Clin Nutr. 2010;19:91–97.
39. Knechtle B, Wirth A, Baumann B, et al. An Ironman triathlon does not lead to a change in body mass in female triathletes. Res Sports Med. 2010;18:115–126.
40. Knechtle B, Senn O, Imoberdorf R, et al. No fluid overload in male ultra-runners during a 100 km ultra-run. Res Sports Med. 2011;19: 14–27.
41. Knechtle B, Senn O, Imoberdorf R, et al. Maintained total body water content and serum sodium concentrations despite body mass loss in female ultra-runners drinking ad libitum during a 100 km race. Asia Pac J Clin Nutr. 2010;19:83–90.
42. Weitkunat T, Knechtle B, Knechtle P, Rüst CA, Rosemann T. Body composition and hydration status changes in male and female open-water swimmers during an ultra-endurance event. J Sports Sci. 2012;30: 1003–1013.
43. Sanborn CF, Jankowski CM. Physiologic considerations for women in sport. Clin Sports Med. 1994;13:315–327.
44. Martin RJ, Dore E, Twisk J, van Praagh E, Hautier CA, Bedu M. Longitudinal changes of maximal short-term peak power in girls and boys during growth. Med Sci Sports Exerc. 2004;36:498–503. 45. Knechtle B, Wirth A, Baumann B, Knechtle P, Rosemann T. Personal
best time, percent body fat, and training are differently associated with race time for male and female ironman triathletes. Res Q Exerc Sport. 2010;81:62–68.
46. Knechtle B, Wirth A, Alexander Rüst C, Rosemann T. The relationship between anthropometry and split performance in recreational male Ironman triathletes. Asian J Sports Med. 2011;2:23–30.
47. Knechtle B, Knechtle P, Rüst CA, Rosemann T. A comparison of anthropometric and training characteristics of Ironman triathletes and Triple Iron ultra-triathletes. J Sports Sci. 2011;29:1373–1380. 48. Knechtle B, Knechtle P, Rosemann T. Upper body skinfold thickness
is related to race performance in male Ironman triathletes. Int J Sports Med. 2011;32:20–27.
49. Rüst CA, Knechtle B, Knechtle P, Wirth A, Rosemann T. A comparison of anthropometric and training characteristics among recreational male ironman triathletes and ultra-endurance cyclists. Chin J Physiol. 2012; 55:114–124.
50. Knechtle B, Knechtle P, Rüst CA, Rosemann T, Lepers R. Age, training, and previous experience predict race performance in long-distance inline skaters, not anthropometry. Percept Mot Skills. 2012; 114:141–156.
51. Meyer M, Knechtle B, Bürge J, et al. Ad libitum fluid intake leads to no leg swelling in male Ironman triathlet an observational field study. J Int Soc Sports Nutr. 2012;9:40.
52. Robins A. Nutritional recommendations for competing in the Ironman triathlon. Curr Sports Med Rep. 2007;6:241–248.
Dovepress
Dove
press
Rüst et al
Open Access Journal of Sports Medicine downloaded from https://www.dovepress.com/ by 118.70.13.36 on 26-Aug-2020