www.the-cryosphere.net/10/2099/2016/ doi:10.5194/tc-10-2099-2016
© Author(s) 2016. CC Attribution 3.0 License.
Dispersion in deep polar firn driven by synoptic-scale surface
pressure variability
Christo Buizert1and Jeffrey P. Severinghaus2
1College of Earth, Ocean and Atmospheric Sciences, Oregon State University, Corvallis, OR 97331, USA 2Scripps Institution of Oceanography, University of California San Diego, La Jolla, CA 92093, USA
Correspondence to:Christo Buizert ([email protected]) Received: 9 June 2016 – Published in The Cryosphere Discuss.: 15 June 2016
Revised: 13 August 2016 – Accepted: 15 August 2016 – Published: 15 September 2016
Abstract.Commonly, three mechanisms of firn air transport are distinguished: molecular diffusion, advection, and near-surface convective mixing. Here we identify and describe a fourth mechanism, namely dispersion driven by synoptic-scale surface pressure variability (or barometric pumping). We use published gas chromatography experiments on firn samples to derive the along-flow dispersivity of firn, and combine this dispersivity with a dynamical air pressure prop-agation model forced by surface air pressure time series to estimate the magnitude of dispersive mixing in the firn. We show that dispersion dominates mixing within the firn lock-in zone. Trace gas concentrations measured in firn air samples from various polar sites confirm that dispersive mixing oc-curs. Including dispersive mixing in a firn air transport model suggests that our theoretical estimates have the correct order of magnitude, yet may overestimate the true dispersion. We further show that strong barometric pumping, such as at the Law Dome site, may reduce the gravitational enrichment of δ15N–N2and other tracers below gravitational equilibrium,
questioning the traditional definition of the lock-in depth as the depth where δ15N enrichment ceases. Last, we propose that86Kr excess may act as a proxy for past synoptic activity (or paleo-storminess) at the site.
1 Introduction
The firn layer is the upper 50–120 m of consolidating snow found in the accumulation zones of ice sheets and glaciers. Within this perennial snowpack a network of connected pores exists that facilitates the movement of air. The firn layer is a mixed blessing. On the one hand it complicates the
in-terpretation of ice core records via the gas age–ice age dif-ference (or 1age; Schwander and Stauffer, 1984), water-isotope diffusion (Johnsen, 1977), the broadening of the gas age distribution (Schwander et al., 1993), diffusive isotopic fractionation of trace gases (Trudinger et al., 1997; Buizert et al., 2013), and non-atmospheric gas variations originating from layered bubble trapping (Etheridge et al., 1992; Rhodes et al., 2016). On the other hand, the firn provides a valuable archive of old air (Etheridge et al., 1996; Battle et al., 1996), and the characteristics of firn air movement give rise to ad-ditional signals that can be used as proxies for local temper-ature change (Severinghaus et al., 1998; Leuenberger et al., 1999) and surface elevation (Raynaud and Lorius, 1973), or as tools for ice core dating (Bender, 2002; Kawamura et al., 2007). It is therefore clear that a complete scientific under-standing of firn air transport is critical to both the correct in-terpretation of the ice core record, and for utilizing the unique possibilities offered by the firn-derived proxies.
Commonly, firn air transport models include three mech-anisms of air movement (Trudinger et al., 1997; Romme-laere et al., 1997; Buizert et al., 2012). The first is down-ward advection with the ice matrix, which operates along the full length of the firn column. In a Eulerian frame of refer-ence, the downward velocity of the air (wair) is smaller than
that of the ice itself (wice) due to a back flux of air from
pore compression (Buizert, 2013). The second mechanism is molecular diffusion in the open pores. As the tortuosity of the pore space increases with depth, the effective diffusiv-ity decreases; at the so-called lock-in depth, molecular dif-fusion effectively ceases. Molecular difdif-fusion in the vertical direction leads to gravitational enrichment inδ15N–N2 and
umbrella term for several phenomena that vigorously venti-late the upper few meters of the firn column (Powers et al., 1985; Colbeck, 1989; Kawamura et al., 2006; Severinghaus et al., 2010). Convective mixing is commonly implemented in models as an eddy-type diffusivity that is equal in magni-tude for all gases, and does not enrich gravitationally (Kawa-mura et al., 2006).
Diffusion effectively ceases at the lock-in depth, and con-sequently there is no gravitational enrichment within the lock-in zone (Sowers et al., 1992). However, detailed studies at the NEEM site in northern Greenland and the Megadunes site in Antarctica suggest continued vertical mixing within the lock-in zone (Buizert et al., 2012; Severinghaus et al., 2010). Figure 1 shows the14CO2 concentrations in NEEM
firn air samples (black dots with error bar), which reflect the atmospheric “bomb spike” in114CO2caused by
atmo-spheric nuclear weapons testing in the 1940s through 1960s. The two solid curves show model simulations using a firn air transport model either with, or without vertical mixing in the lock-in zone (LIZ). To correctly fit the firn air data, the mod-els used in Buizert et al. (2012) require a LIZ mixing term of the order of 2×10⁻⁹m2s−1; at the time that study was published, the nature of this mixing remained unclear, and a good fit to the data can be obtained regardless of whether this diffusivity is implemented as molecular-type, eddy-type, or a combination thereof. However, the remnant LIZ mixing is unlikely to be caused by molecular diffusion because of (1) the absence of LIZ gravitational enrichment, and (2) in-sights from percolation theory that suggest that in a porous medium the gas diffusivity vanishes abruptly at the percola-tion threshold (i.e., the lock-in depth) as the pore connectivity decreases (Ghanbarian and Hunt, 2014). Here we show that the LIZ mixing can readily be explained by dispersion occur-ring in the deep firn that is driven by air movement induced through synoptic-scale surface pressure variations.
Steady viscous fluid flow through a disordered porous medium leads to dispersion (Scheidegger, 1954, 1961; Sahimi et al., 1983). On the microscopic level, this process can be understood as a consequence of the different flow paths available to tracer molecules. Figure 2 schematically compares fluid flow through a microscopically ordered (up-per) and disordered (lower) porous medium. In the upper panel all pathways are equivalent, and tracer molecules tran-siting the porous medium each have the same transit time and are not dispersed in passage. In the lower panel the tracer molecules traveling through different sections of the pore space have different transit times, and they are spatially dis-persed as they transit the medium. The different pathways not only have unequal lengths. According to the Hagen– Poiseuille equation, the hydraulic conductance of a capillary (for laminar flow) scales as ∝r4, with r the pore radius. Given that a range of pore radii exist in natural firn, ther4 power law will concentrate flow in the widest pathways, fur-ther broadening the distribution of tracer transit times.
no LIZ mixing with LIZ mixing
lock-in depth
400 450 500 550 600
14CO2 (× 10-12 ppm)
50
55
60
65
70
75
Depth (m)
Figure 1.The14CO2bomb spike as observed and simulated in firn
air at NEEM, northern Greenland (Buizert et al., 2012). Continued mixing within the lock-in zone (LIZ) is needed to correctly simulate the smoothness of the observations. Both simulations use the firn diffusivity values as presented in Buizert et al. (2012); the eddy-type LIZ diffusion was either turned on (red curve) or off (blue curve). The case without LIZ mixing was not tuned separately to the observations.
On the macroscopic level, dispersion can be described as a diffusive process with a diffusivityDdispwith units of m2s−1
(Sahimi et al., 1983). Dispersion is much stronger in the lon-gitudinal (along-flow) direction than in the transverse direc-tion. This distinction is important in many applications (for example a point-source contamination in an aquifer subject to groundwater flow), but in firn air applications the source (the atmosphere) is laterally uniform, and only the longitu-dinal dispersion matters. Fluid flow at a macroscopic mean velocityvresults in dispersion of a magnitude
Ddisp=αL×v, (1)
whereαLis the so-called longitudinal dispersivity, which is a
property of the medium with units of m. In the case of firn air dispersion it is important to point out thatDdispdoes not lead
to gravitational enrichment, as it originates in macroscopic air movement that does not discriminate between N2
isotopo-logues. There are two sources of macroscopic air movement in deep firn: the aforementioned back flux due to pore com-paction, and flow driven by synoptic-scale surface pressure variations. Here we will show that the latter is several orders of magnitude larger, and hence dominates the dispersive mix-ing. The upper few meters of the firn are furthermore subject to wind-driven air flow (e.g. Colbeck, 1989); the dispersion caused by this flow is minimal owing to the low dispersiv-ity of near-surface firn, and overwhelmed by diffusion and convective mixing.
Figure 2. Schematic depiction of dispersion. Fluid movement through a microscopically homogeneous, low-tortuosity porous medium (upper panel) is non-dispersive; fluid movement through a microscopically disordered porous medium (lower panel) disperses tracer molecules. Macroscopic fluid flow is from left to right.
firn samples. Schwander et al. (1988) correctly inferred that molecular diffusion is by far the dominant process in mixing firn air, and that study therefore focused on the first-order process of diffusive transport. We want to emphasize that Jakob Schwander fully realized the potential of these mea-surements to estimate dispersive gas mixing in firn also, as he wrote: “This dependence of D on the gas-flow velocity can be used to estimate how air flow in the firn caused by atmospheric pressure variations contributes to the gas mix-ing rate” (Schwander et al., 1988). Since 1988 there has been enormous progress in observing and modeling firn air movement, and presently it is pertinent to also investigate the second-order effect of firn dispersion. Still, the present work should be considered a footnote to the seminal achievement of Schwander et al. (1988), and the many deep and early in-sights in firn air movement it contains. The reader is strongly encouraged to (re-)read the original work.
2 Air pressure dynamics in the firn column 2.1 Mathematical description
Here we present a mathematical description of air pressure dynamics in polar firn, aimed towards understanding firn air movement in deep firn in response to surface pressure varia-tions.
In hydrostatic equilibrium the firn air pressure p(z) in-creases with depthzfollowing the barometric equation: p(z)=p0exp
−Mg
RTz
, (2)
withp0the surface pressure,Mthe molar mass of air,gthe
gravitational acceleration,Rthe gas constant, andT the ab-solute temperature. Deviations from this hydrostatic balance result in viscous air flow, with a velocity given by Darcy’s
law: v= −k
µ
dp
dz− Mg RTp
, (3)
withk the permeability of the firn andµthe (temperature-and pressure-dependent) dynamic viscosity of air.
The continuity equation for macroscopic air movement within the firn is
d dt sopρ
= −d
dz sopρv
, (4)
withρ the fluid density andsop the firn open porosity.
As-suming static, isothermal firn properties (i.e., dsop/dt=0
and dT /dz=0), and using the ideal gas law then gives dp
dt = − 1 sop
d dz soppv
. (5)
Substituting Darcy’s law into the continuity equation yields
dp dt =
1 µsop
h
k∗pd 2p
dz2 +
k∗dp dz +
dk∗ dzp−2k
∗Mg
RTp
dp
dz
−dk ∗
dz Mg
RTp
2i, (6)
wherek∗=k·sop.
Equation (6) is a nonlinear differential equation that is dif-ficult to solve numerically due to the various terms that scale asO(p2), a complication that arises from the compressibility of air, which makes the fluid densityρa function of pressure. Equation (6) can be simplified substantially by making the following approximation. In the continuity equation Eq. (5) the time-varying pressurep(t )is substituted by the mean an-nual pressurepto get
dp dt = −
1 sop
d dz soppv
, (7)
which in turn simplifies Eq. (6) to dp
dt = p µsop
h
k∗d 2p
dz2 + d
k∗ dz −k
∗Mg
RT
d
p dz
−dk ∗
dz Mg RTp
i
. (8)
z = 10 m z = 30 m z = 67 m z = 76 m
day ho
u
r
minut
e
sec
.
AWS
ERA month week day
10 10
2010
0 200 400 600 800 1000
0 0.2 0.4 0.6 0.8 1
-1 100 101 102 103 104 105 -2
10-1
100
2010.25 2010.5 2010.75 2011
740 760 780 800
10-1 100
10-2
100
102
(c
) (
Time (s)
Response (mbar)
Frequency (day-1)
Transfer function
Time (year CE)
Pressure (mbar)
Frequency (day-1)
PSD (mbar
2 day)
(a b)
) (d)
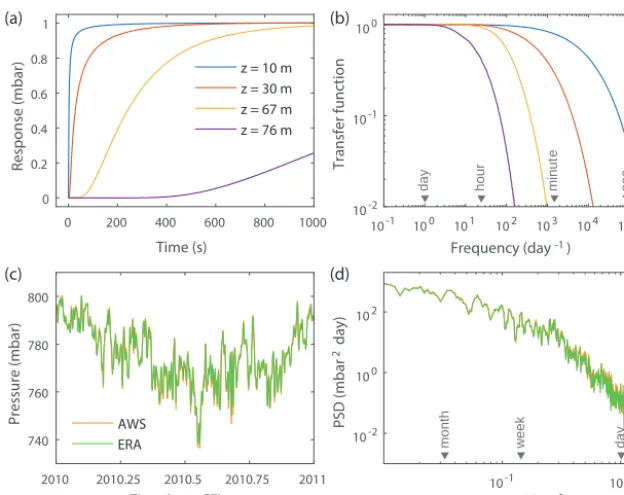
Figure 3.Propagation of pressure variations into the firn at WAIS Divide.(a)Pressure response at indicated depths to a unit-step surface
pressure increase of 1 mbar at timet=0.(b)Low-pass filter characteristics of the firn column to surface pressure variability.(c)Surface pressure history of year 2010 at the WAIS Divide site from AWS measurements (orange) and from the ERA-Interim reanalysis (green).
(d)power spectral density (PSD) of the time series shown in(c).
smaller than other errors such as the uncertainty in the firn permeabilityk. Moreover, in the next section it is shown that the pressure response time of the firn is orders of magnitude faster than the synoptic-scale pressure variations that drive barometric pumping in the deep firn, rendering a 5 % error irrelevant. We also neglect the small viscosity changes due to temperature and pressure.
2.2 Propagating pressure anomalies into the firn In the numerical solutions presented here, Eq. (8) is solved using a Crank–Nicolson finite difference method, which em-ploys implicit time stepping. At the surface boundary the pressure is set to equal the atmospheric pressure forcing; at the lower boundary the pressure gradient is set to zero. The sopparameterization of Mitchell et al. (2015) is used as well
as thekparameterization of Adolph and Albert (2014). In a first experiment we force the model with an at-mospheric pressure p(t )=p+u(t ), where u(t ) denotes a 1 mbar magnitude unit step (or Heaviside) function at time t=0. Firn properties of the West Antarctic Ice Sheet (WAIS) Divide site in West Antarctica are used. Equation (8) is solved at 0.1 m depth resolution and at time increment1t=
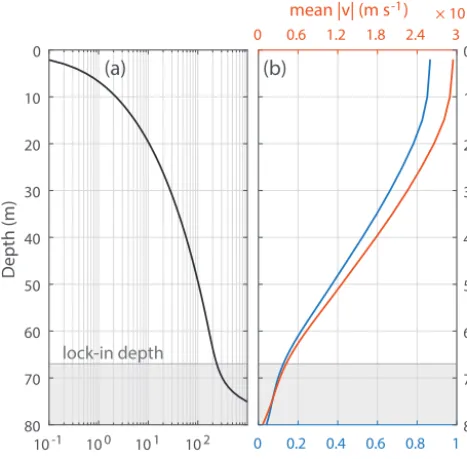
1×10⁻¹⁰year=3.2×10⁻³s. The propagation of the pres-sure anomaly into the firn is shown in Fig. 3a at four depth levels; the depths z=67 m and z=76 m are selected be-cause they are the lock-in depth and deepest firn air sampling depth, respectively. Note that the pressure variations at depth
are amplified relative to the surface forcing due to the hydro-static effect (Eq. 2). Lett1/2(z)be the time required at depth zfor the pressure increase to reach half the final amplitude. The depth profile oft1/2(z)is shown in Fig. 4a (note the loga-rithmic scale). It is clear that pressure fluctuations propagate relatively fast through the firn column; atz=20 m depth the response timet1/
2=20 s, and at the lock-in deptht1/2 =230 s. This fast response need not be a surprise, given that in free air pressure variations propagate at the speed of sound; in firn, the propagation speed is limited by the finite permeability of the medium. The largest increase int1/
2(z)is seen within the lock-in zone, where firn permeability becomes vanishingly small assopapproaches zero.
10 8 1
4 3
-6
0
-1 100 101 102 t (s) 0
10
20
30
40
50
60
70
80
Depth (m)
lock-in depth
0 0.2 0.4 0.6 0.
∆z (m) 0 0.6 1.2 1.8 2.
mean |v| (m s-1) ×10
10
20
30
40
50
60
70
80
½
(a) (b)
Figure 4.Firn air pressure response at the WAIS Divide site.(a)
Re-sponse timet1/
2(z)to a unit-step surface forcing.(b)The 2σair dis-placement1zas a function of depth (blue), and the mean absolute air velocity due to barometric pumping (red), both forced by the 2010 surface pressure time series (Fig. 3c).
macroscopic scale of the entire firn column. The ultimate test of these model results would be an in situ pressure gauge buried in the deep firn near the firn–ice transition, but to our knowledge such measurements have only been performed in the upper few meters of snowpacks (e.g. Drake et al., 2016). The firn transfer function of Fig. 3b can be compared to the spectral density of pressure variability at the site. Figure 3c shows hourly pressure data from an automated weather sta-tion (AWS) located at the WAIS Divide site (Lazzara et al., 2012), as well as 6-hourly data from the ERA-Interim re-analysis (Dee et al., 2011); Fig. 3d shows the power spectral densities of both time series. From analyzing the firn transfer functions, it is clear that most of the synoptic-scale pressure variability observed in these records will be expressed at full magnitude all the way down to the firn–ice transition. 2.3 Barometric pumping
The pressure variations described above are associated with net macroscopic air movement in the firn column, a phe-nomenon known as barometric or atmospheric pumping (Nil-son et al., 1991). Whenever surface pressure increases, firn air will move downwards as the underlying air parcels are being compressed (the same number of molecules occupy a smaller volume at higherp), resulting in atmospheric air en-tering the upper firn column. Also, vice versa, when surface pressure decreases, the firn air moves upwards in the column with the upper air parcels being expelled into the free
atmo-sphere. One can think of the entire firn column as “breathing” in and out in response to high- and low-pressure systems, re-spectively.
The 2σ barometrically driven vertical displacement of air parcels (1z) at the WAIS Divide is plotted in blue in Fig. 4b. Near the surface, barometric pumping displaces air vertically of the order of 1 m, which presumably contributes to the es-tablishment of a well-mixed zone (or “convective zone”). Note that the curve shows the 2σ vertical displacement; the peak-to-peak displacement is much larger and of the order of 3.5 m near the surface. Figure 4b furthermore shows the mean (absolute) velocity |v| in red. Both curves of course closely resemble each other, given that the vertical velocity is the first derivative of the air displacement. We plotted the ac-tual air velocities in the pores themselves, i.e., the air velocity averaged over the pore cross section. To obtain the velocity per unit of bulk sample cross section, one has to multiply the values bysop.
Another source of macroscopic air movement in deep firn is the gradual closure of the pore space by the densification process, which leads to an upward air flow relative to the firn matrix (Rommelaere et al., 1997). The velocity of this (accumulation-rate-dependent) back flux is of the order of 10−9 to 10−8m s−1, and is clearly negligible in magnitude compared to the barometrically driven flow.
3 Dispersive mixing
3.1 Experimental dispersivity of polar firn samples Here we revisit the published firn diffusion experiments by Schwander et al. (1988) to estimate the dispersivity of polar firn. In these experiments, cylindrical firn samples (30 mm diameter, 50 mm length) from Siple station, Antarctica, were placed in a −20◦C chamber inside a gas chromatograph (GC) and flushed through with a pure N2 carrier gas at a
controlled superficial flow velocity ranging from 0.175 to 0.789 mm s−1. A small amount of CO2or O2is injected into
the N2carrier-gas stream before the firn sample, and the
elut-ing peak is measured uselut-ing a thermal conductivity detector. The effective firn diffusivity (as a function of flow speed) is reconstructed from the peak width in the chromatogram us-ing standard GC theory. More procedural details are given in the original publication (Schwander et al., 1988).
NEEM WAIS
lock-in
(c)
(b)
(a)
sopen
flow speed (mm/s)
2 m 40 m 55 m 60 m
Ddisp
×
10
-9 (m 2 s -1)
Dispersivity
αL
(m)
Diffusivity (mm
2 s -1)
10-4
10-3
10-2
10-1
100
0 0.05 0.1 0.15 0.2 0.25 0.3 0.35
0 2 4 6 8
0 0.2 0.4 0.6 0.8
0 5 10 15 20 25
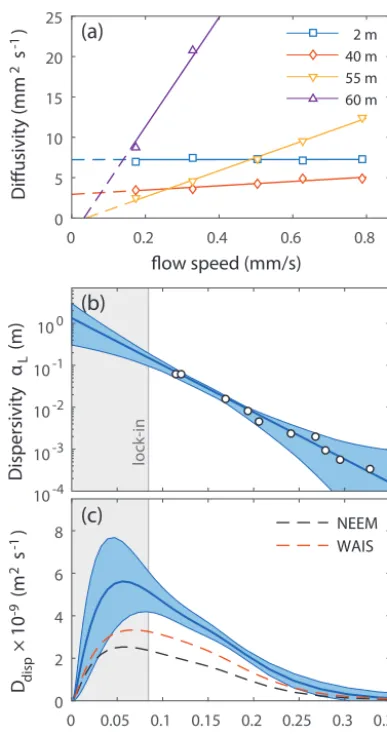
Figure 5. Firn dispersivity.(a)Effective diffusivity of CO2as a
function of flow speed as measured by Schwander et al. (1988) on firn samples from Siple station.(b) Experimental firn longitu-dinal (i.e., along-flow) dispersivityαLas a function of sample open porosity (white dots) with best fit (solid blue line); the shaded area indicates the estimated 95 % confidence interval of the fit.(c) Dis-persive mixing at NEEM, using the dispersivity envelope (95 % confidence) from(b), multiplied by the mean absolute firn air ve-locity induced by barometric pumping at that site. The dashed black (red) line indicates the optimal level of dispersive mixing needed in the firn air transport model to fit the NEEM (WAIS Divide) firn air observations (Buizert et al., 2012; Battle et al., 2011).
Adolph and Albert, 2014) and via inverse methods (Romme-laere et al., 1997; Trudinger et al., 1997; Witrant et al., 2012). The slope of the fit representsαL, as per Eq. (1), with the
longitudinal (or along-flow) orientation being vertical in the natural firn setting. Near the surface (z=2 m) the recon-structed diffusivity is independent of the flow speed, sug-gestingαL=0 m. This is due to the homogeneous and open
pore geometry of shallow firn, in which the traveled path length and flow speed is identical for all pore clusters that contribute to the flow, and hence tracer molecules traveling
through various parts of the pore space do not get dispersed. For deeper firn samples we see an increase in the slope of the fit, and therefore an increase inαL. This increased
dis-persivity is caused by heterogeneity of the pore geometry, by which the different pore clusters have increasingly disparate path lengths, flow speeds, and cul-de-sacs, which serve to disperse tracer molecules traveling through various parts of the pore space.
The firn dispersivity data are plotted in Fig. 5b as a func-tion ofsop(white dots), where we used the average value of
the CO2and O2experiments in Schwander et al. (1988). The
data suggest an exponential dependence onsopof the form
αL(sop)=a·exp(b·sop). (9)
Propagating the 95 % confidence intervals on theαL
val-ues estimated in the slope fitting, the following valval-ues for the fitting parameters are suggested:a=1.26±0.40 m and b= −25.7±2.2. Unfortunately there are no experimental data within the lock-in zone, which makes the exponen-tial extrapolation of Eq. (9) uncertain. Using a Monte Carlo scheme, we construct an uncertainty envelope by fitting func-tions of the forma·exp(b·sop+c·sop2), while forcing the curve
to intercept they axis at anαL(sop=0)value randomly
se-lected from the interval 0.3 to 3 m, and randomly perturbing theαLdata within their 95 % confidence intervals; this
enve-lope is indicated as the blue shading in Fig. 5b.
3.2 Dispersive mixing driven by barometric pumping Multiplying the experimental αL values by the estimated
mean absolute velocity profile allows for a theoretical esti-mate of dispersive mixing in the firn column, as is shown in Fig. 5c for NEEM as the blue curve with the uncertainty envelope. Note that the pore velocities of (Fig. 4b) are first multiplied bysop to convert them into superficial velocities
(average velocity in an open tube with the same diameter as the sample) as used by Schwander et al. (1988). The NEEM site is used here because it was the venue for an intensive study of firn air processes by eight different research groups and had a very clear signal of continued mixing within the lock-in zone (Fig. 1). Six different firn air transport models were applied to two separate boreholes at the NEEM site, which together suggest a lock-in zone diffusivity in the range of∼2×10⁻⁹to 7×10⁻⁹m2s−1(Buizert et al., 2012); the theoretical estimate of dispersive mixing derived here corre-sponds very well with this range.
The dispersivity αL and the pumping velocity |v| have
opposite trends withsop. However, becauseαL scales more
strongly with sop, it ends up dominating the behavior of Ddisp, which generally increases as sop gets smaller – the
exception to this pattern is the lower half of the lock-in zone (sop<0.05), where dispersive mixing decreases again
about 2–3 orders of magnitude larger. Molecular diffusion ef-fectively ceases at the lock-in depth, and therefore dispersion dominates only in the lock-in depth.
3.3 Dispersive mixing in firn air transport modeling In this section we use the theoretical estimates of dispersive mixing strength in a firn air model to investigate whether it is consistent with the measured trace gas concentrations in air samples extracted from the pore space. We use the NEEM (Buizert et al., 2012) and WAIS Divide (Battle et al., 2011) sites, which are among the most well-characterized firn air sites in the literature. At both locations we use ERA-Interim 6-hourly surface pressure data at the nearest grid point (0.75◦×0.75◦ resolution grid) for the calendar years 2010 and 2011 to calculate the barometrically driven air ve-locity and dispersive mixing strength. The theoreticalDdisp
values at WAIS Divide are about 15 % higher than those at NEEM (the latter are shown as the blue enveloped curve in Fig. 5c). We assume that dispersive mixing at all times was equal to the average of the 2010–2011 period.
Next, using the CIC firn air model (Buizert et al., 2012), we calibrate the molecular diffusivity profile at both sites us-ing well-established methods (Trudus-inger et al., 1997; Rom-melaere et al., 1997; Battle et al., 2011; Buizert et al., 2012; Witrant et al., 2012; Trudinger et al., 2013), where disper-sive mixing strength is set toDdisp=γ·D0disp, withD0dispthe
theoretical dispersive mixing strength, andγ a scaling factor that is changed in the calibration routine in order to optimize the model fit to the firn air data. TheDdispprofiles that
opti-mize the fit are shown in Fig. 5c as dashed lines. The fit to the firn air data is optimized at NEEM and WAIS Divide when we set dispersive mixing in the model to around 50 and 58 % of the theoretical estimate, respectively.
The firn air data indicate that WAIS Divide has more dis-persive mixing than NEEM, as also predicted by our theo-retical calculations. This should thus be considered a robust result. While the theoretical estimates are of the correct order of magnitude, they appear to overestimate the dispersion sug-gested by observed trace gas concentrations. There may be several causes for this mismatch. First, to fit the same tracer data, different firn air transport models require slightly dif-ferent diffusivity profiles (Buizert et al., 2012), and some of the mismatch could be an artifact of the firn air model used. Second, at the lowsopvalues of the lock-in zone (where
dis-persion dominates the transport) ourαLparameterization
re-lies on extrapolating the observational estimates (Fig. 5b), and Eq. (9) may thus overestimate the true firn dispersivity. Third, the data by Schwander et al. (1988) give the dispersion under steady flow conditions, whereas barometric pumping drives an air flow that is variable in time; the analogy from electronics would be direct current (DC) and alternating cur-rent (AC), respectively. Conceivably the AC dispersivity of firn is lower than the DC dispersivity we derived from Jakob Schwander’s data, for example because in an alternating flow
a portion of the air will retrace its path back to its original position (reducing the dispersion), which does not occur in direct flow.
3.4 Gravitational enrichment at Law Dome
A site with strong barometric pumping is the Law Dome site in coastal eastern Antarctica, where firn air has been sampled at the high-accumulation DE08 site (1.2 m year−1ice equiv-alent; Etheridge et al., 1996; Trudinger et al., 1997), and the DSSW20K site (0.16 m year−1ice equivalent; Sturrock et al., 2002; Trudinger et al., 2002). We calculate dispersion at DE08 to be about 65 % stronger than it is at NEEM.
A remarkable property of both Law Dome sites is that LIZ gravitational δ15N enrichment is much less than would be expected based on diffusive equilibrium. For DSSW20K and DE08 this is shown in Fig. 6c and e, respectively; note that the shallowestδ15N data may be impacted by thermal dif-fusion due to temperature seasonality (Severinghaus et al., 2001). Here we will focus on the DSSW20K site, for which more data are available. At DSSW20K gravitational enrich-ment inδ15N appears to stop∼7 m above the actual lock-in depth. Here we explore the possibility that this anomaly is due to dispersive mixing in the deep firn. First, we cal-ibrate the CIC firn model to the DSSW20K site using firn air data of CH4, CO2, SF6,114CO2, CFC-11, CFC-12, and
CFC-113 (Sturrock et al., 2002) using established methods (Buizert et al., 2012). Following our findings at the NEEM and WAIS Divide sites, we set the deep firn dispersion to equal 55 % of our theoretical estimate based on Law Dome surface pressure time series from the ERA-Interim reanaly-sis. Next, we explore four instructive modeling scenarios that are color-coded in Fig. 6.
In the first scenario (blue curves), we have eliminated both near-surface convection and deep-firn dispersion to show the δ15N gravitational signal in the absence of macroscopic mix-ing (Fig. 6c). It is clear that theδ15N data in the lock-in zone are depleted about 40 per meg relative to gravitational equi-librium. In the second scenario (red curves) we add the con-vective and dispersive mixing, and find an improved fit to all tracers exceptδ15N. This second scenario is equivalent to best current modeling practices, and comparable to meth-ods used above at the NEEM and WAIS Divide sites. We must conclude that our best practices cannot account for the anomalous deep-firnδ15N signal seen at DSSW20K (Fig. 6c) and DE08 (not shown).
In the third scenario (yellow curves), we attempt to fit the δ15N data simply by increasing the magnitude ofDdisp. We
have to increase dispersion 150-fold to simulateδ15N cor-rectly; however doing so seriously compromises the model fit to all other tracers (Fig. 6a–b), showing this approach to be invalid.
inde-Lock-in
1000 1200 1400 1600
CH 4 (ppb)
0
10
20
30
40
50
DSSW20K depth (m)
CTRL +CZ +D
disp 150×Ddisp
layer Ddisp
350 400 450 500 550
14CO 2 (× 10
-12 ppm)
0 0.05 0.1 0.15 0.2
δ15N-N 2
-15 -10 -5 0
86Kr
excess (per meg)
0 0.1 0.2 0.3
δ15N-N 2
0
10
20
30
40
50
60
70
80
90
DE08 depth (m)
(a) (b) (c) (d) (e)
Figure 6.Model simulations and firn air data for the Law Dome DSSW20K(a–d)and DE08(e)sites, with model scenarios color-coded.
The first scenario (CTRL, blue) is a control run with no convective mixing or dispersion to show gravitational equilibrium. The second scenario (+CZ+Ddisp, red) includes convective mixing (following Kawamura et al. (2006) withH=2 m andDeddy,0=1×10⁻⁵m2s−1) and dispersion to optimize the fit to all tracers exceptδ15N. The third scenario (150×Ddisp, yellow) uses strongly enhanced dispersive mixing to optimize the fit toδ15N data. The fourth scenario (layeredDdisp, green) uses layered dispersion and diffusivity to optimize the fit to all tracer data. Model details and atmospheric trace gas forcings are as in Buizert et al. (2012). Spatial model resolution is1z=0.1 m for scenarios 1–3, and1z=0.01 m for scenario 4.(a)DSSW20K methane mixing ratio;(b)DSSW20K14CO2mixing ratio;(c)DSSW20K
δ15N–N2;(d)DSSW20K86Kr excess;(e)DE08δ15N–N2.
Dispersion
usion
0 2 4
DCO2 Ddisp (× 10-8 m2 s-1)
41.4
41.5
41.6
41.7
41.8
41.9
42
Depth (m)
/
(a) (b)
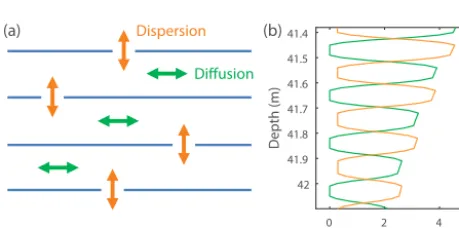
Figure 7.Diffusion and dispersion in layered firn.(a)Schematic
of conceptual model where the horizontal blue lines depict dense firn strata with limited vertical connectivity.(b)Layering as imple-mented in the firn air diffusion model; the zoom is on four annual layers just above the lock-in depth.
pendently without interactions between them. In reality, the pore space is a three-dimensional network that is strongly im-pacted by density layering (Martinerie et al., 1992; Hörhold et al., 2011; Mitchell et al., 2015). Diffusion and disper-sion have generally opposite relationships to density. Thus, near the lock-in zone of a firn with strong density layer-ing, we should expect to see alternating bands of high dif-fusivity (associated with low-density strata) and bands with high dispersion (associated with high-density strata). The high-density strata have a larger fraction of closed bubbles, and therefore relatively few vertically connective pathways; these pathways will channel the barometrically induced flow, thereby becoming focal points of dispersive mixing. This sit-uation is depicted schematically in Fig. 7a. In this conceptual
model, dispersion dominates transport in the vertical direc-tion, which leads to a strongly reduced gravitational enrich-ment. However, in the transverse directions molecular dif-fusion still dominates, particularly in the low-density strata. In a layered firn it is thus conceivable that a mixed zone exists between the molecular-diffusion-dominated diffusive zone and the dispersion-dominated lock-in zone, in which gravitational enrichment is very weak, yet molecular diffu-sion is still active.
Next we attempt to capture the dynamics of such a lay-ered firn in our one-dimensional model. In our fourth model-ing scenario (green curves), we use an idealized layered firn model, with alternating annual bands of diffusive and disper-sive mixing; details are shown in Fig. 7. The dispersion has been set to perfectly compensate the reduced molecular dif-fusion, and therefore the total mixing is comparable to that of scenario 2. We let the compensation be perfect for CO2,
which means it is imperfect for other trace gases. We find that using such a layered approach can simulate both the reg-ular tracers andδ15N correctly (Fig. 6a–c). These modeling results confirm thatδ15N enrichment can cease before the lock-in depth is reached. The common practice of defining the lock-in as the depth whereδ15N enrichment stops (e.g., Sowers et al., 1992) may thus be invalid at sites that have both strong layering and large barometric variations. Instead, the lock-in depth should be identified with transient tracers such as CO2and CH4, using their sharp inflection point. However,
diffu-4 5 6 7 8 9 10 11 12
WD
EDML
Fuji
Kunlun
Vostok EDC
Talos SP
JRI
Siple Law
NEEM NGRIP GISP2
Dye 3
Taylor GRIP
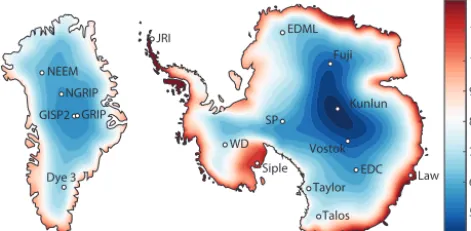
Figure 8. Synoptic-scale barometric pumping strength for
Green-land and Antarctica using 6-hourly ERA-Interim reanalysis surface pressure values for the period 1 January 2010 through 31 Decem-ber 2011. The color scale gives the root mean square of the pressure rate of change dp/dtin units of mbar day−1. Key ice core drilling locations are indicated.
sive mixing is of course questionable – it is included here as an illustrative example only. To gain a meaningful represen-tation of these processes it may be necessary to move to firn air transport models of two or more dimensions.
4 Discussion
4.1 Implications for firn air and ice core studies There are probably three factors that contribute to the mag-nitude of dispersive mixing at any given site.
1. Magnitude of barometric variability. Figure 8 shows maps for Greenland and Antarctica of the time-averaged root mean square of the surface pressure change dp/dt expressed in mbar day−1; this is a good proxy for the barometric pumping power available at a given site, as the air flow velocity scales with the rate of pressure change. The maps suggest that barometric pumping is strongest near the ice sheet margins, and weakest in the interior. The Dome A ice core drilling site at Kunlun station has the smallest barometric pumping of all sites, whereas coastal cores such as Law Dome and James Ross Island (JRI) have strong barometric pumping. 2. Firn column thickness. The amount of barometrically
driven air flow at any given depth depends on the total size of the air reservoir below that depth (which is why air flow decreases with depth in Fig. 4). All other things being equal, a thicker firn column will have higher air flow velocities and hence more dispersive mixing than a thin column.
3. Layering. As argued in Sect. 3.4, firn density layering can enhance dispersive mixing by increasing medium heterogeneity, specifically through the formation of high-density, high-dispersivity layers. Melt layers and
ice lenses may similarly act as focal points for disper-sive mixing.
The NEEM and WAIS Divide sites have comparable firn thickness and density layering, and therefore the stronger barometric variability at the WAIS Divide site results in stronger dispersive mixing at that site (Fig. 5). The Law Dome DE08 and DSSW20K sites experience the same baro-metric variations, yet DE08 has a thicker firn column and DSSW20K has more (annually spaced) high-density layers. It is therefore not clear a priori which of these two Law Dome sites has stronger dispersive mixing, and unfortunately the available firn air data are of insufficient resolution to estab-lish this unambiguously.
Dispersive mixing influences the ice core record in several ways, the most important of which is via the broadening of the gas age distribution. A comparative firn model study at the NEEM site showed that the low-diffusion lock-in zone environment contributes more to the broadening of the final age distribution than the diffusive zone does (Buizert et al., 2012). The weak barometric variability in interior Antarctica (Fig. 8) may be part of the reason why gas records from cen-tral East Antarctic ice cores such as EPICA Dome C have surprisingly little smoothing, as evidenced by the fact that abrupt methane transitions during e.g., the Younger Dryas period and Dansgaard–Oeschger cycle are well preserved (Loulergue et al., 2008).
glacial dispersive mixing could contribute to the observed low gravitational enrichment inδ15N. Overall, more multi-tracer, high-resolution firn air studies at sites with strong barometric variability will be needed to better understand the influence of barometric pumping on gravitational enrichment and theδ15N proxy.
4.2 86Kr excess as a potential proxy of past synoptic activity
The degree of isotopic gravitational enrichment of any given gas species in the firn depends on the relative strength of molecular diffusion, which acts to drive isotopic enrichment towards gravitational equilibrium, and macroscopic transport processes (convection, advection and dispersion), which act to erase the enrichment. Slow-diffusing gases such as kryp-ton (Kr) and xenon (Xe) will therefore always be less iso-topically enriched than fast-diffusing gases such as N2and
argon (Ar). This effect was first observed by Kawamura et al. (2013), who studied deep air convection (a form of macro-scopic transport) at the Antarctic Megadunes site (Severing-haus et al., 2010).
Here we define 86Kr excess as
86Kr
excess=δ86Kr/82Kr|tc−δ40Ar/36Ar|tc, where the
subscript “tc” (“thermally corrected”) denotes that the isotopic ratios have been corrected for thermal fractionation either by using a thermal model or by paired δ15N–δ40Ar data (Grachev and Severinghaus, 2003a, b). Due to the different molecular diffusivities of N2 and Kr, they are
in a different state of gravitational disequilibrium, which makes 86Krexcess a measure of the aggregate strength of
non-diffusive transport processes in the firn column. There are several reasons for using86Kr and40Ar rather than e.g.,
136Xe and 15N. First, Kr is over 10 times as abundant in
the atmosphere as Xe and therefore more easily measured. Second, δ40Ar is more precise in terms of gravitational signal-to-noise ratio, and less affected by thermal diffusion than δ15N. Third, δ40Ar and δ86Kr can both be measured on air extracted from the same physical ice sample after removal of O2, N2, and other reactive gases via gettering
(Severinghaus et al., 2003). Because δ86Kr is always less gravitationally enriched than δ40Ar, 86Kr excess is always negative.
Figure 6d shows 86Kr excess for all four modeling sce-narios discussed in Sect. 3.4. In scenario 1 (blue curves) the only macroscopic transport mechanism is advection, which results in a86Krexcessof−5 per meg. Adding convection and
modest dispersion (scenario 2, red curve) increases86Krexcess
in magnitude to−10.2 per meg, reflecting the increased de-gree of gravitational disequilibrium in the firn column. Both scenarios with strong dispersion (scenarios 3 and 4, yellow and green curves, respectively) show a further increase in
86Kr
excessmagnitude to 16.5–18 per meg.
Measurements on the WAIS Divide ice core (WAIS-Divide Project Members, 2013; WAIS (WAIS-Divide Project
Mem-bers, 2015) show86Krexcess values of around−35 per meg
during the late Holocene (analytical precision is better than 20 per meg). However, older sections of the core show
86Kr
excessvalues as low as−90 per meg (Orsi et al., 2014),
suggesting periods of greatly enhanced gravitational disequi-librium in the firn column (data not shown). One tantalizing interpretation could be that these very negative86Krexcess
val-ues represent periods of enhanced synoptic activity in (West) Antarctica, driving strong dispersive mixing.
We propose here that86Krexcessmay act as a proxy for past
synoptic-scale pressure variability (or storminess/cyclone density). Before this interpretation can be accepted, how-ever, additional work is needed. The large spatial variabil-ity in barometric variabilvariabil-ity over Antarctica (Fig. 8) provides a valuable opportunity to verify whether ice core86Krexcess
indeed scales with local barometric variability. Additional work is needed to reliably correct86Krexcessfor the influence
of advection and convection in the firn column (Kawamura et al., 2013), preferably through detailed studies of86Krexcess
in modern-day firn. If corroborated, 86Krexcess could hold
important clues about past changes to the large-scale atmo-spheric circulation, particularly when combined with recon-structions of past wind conditions from surface roughness (Barnes et al., 2006; Bay et al., 2010). In Greenland, changes in synoptic activity are presumably linked to the buildup of the Laurentide ice sheet and its orographic influence on the storm tracks (Kageyama et al., 1999). In Antarctica, synoptic activity may be linked to e.g., meridional movement of the eddy-driven jet (Ceppi et al., 2013), atmospheric teleconnec-tions to the tropical Pacific (Ding et al., 2012), or the position and depth of the Amundsen Sea low (Turner et al., 2013).
5 Summary and conclusions
In this work we show that surface pressure variability on synoptic timescales drives macroscopic air movement in the deep firn, which in turn leads to dispersion of trace gases in the firn open porosity. The work resolves an outstand-ing question regardoutstand-ing the nature of lock-in zone mixoutstand-ing de-duced from detailed firn air experiments at the north Green-land NEEM site (Buizert et al., 2012).
We present a mathematical description of the propagation of pressure anomalies in polar firn. We find that pressure variations on the timescale of order 1 h or slower are propa-gated to the firn–ice transition at full amplitude; variations on shorter timescales are attenuated. Net barometrically driven air movement is on the centimeter scale in the deep firn, and on the meter scale in the upper firn; mean velocities are of the order of 10−6m s−1. The precise values of the air displace-ment and velocity depend primarily on the firn thickness and the barometric variability at the site.
We use published firn sample gas chromatography exper-iments to estimate the dispersivityαL of firn, which is the
superfi-cial gas velocity and the apparent dispersion strength (Eq. 1). We find thatαLscales exponentially with the open porosity sop, withαL≈0.1 m at the lock-in depth. Combining
simu-lated air velocities and firn dispersivity, we calculate disper-sive mixing in the deep firn to be of the order of 10−9m2s−1, with precise values again depending on firn thickness and the barometric variability at the site.
We apply these theoretical estimates of dispersion in a firn air transport model, and find that they overestimate the amount of lock-in zone dispersivity needed to optimize the fit to firn air trace gas measurements; this mismatch may be due to the fact that our firn dispersivity parameterization is based on steady-flow conditions, whereas barometric pumping in-duces a time-variable flow. We suggest that strong dispersive mixing at Law Dome, Antarctica, in combination with firn layering, may halt gravitational enrichment in δ15N before the lock-in zone is reached.
The dispersive mixing discussed here increases scientific understanding of firn air transport, and has direct implica-tions for the modeling thereof. The ice core record is im-pacted by dispersive mixing primarily through the widening of the gas age distribution. We propose that86Kr excess may be an ice core proxy for past synoptic activity, which is linked to the large-scale atmospheric circulation.
6 Data availability
NEEM and WAIS Divide firn air data are available with the original publications (Buizert et al., 2012; Battle et al., 2011). Siple station firn sample gas chromatography data are listed in Table 1 of Schwander et al. (1988). ERA-Interim reanal-ysis products are publicly available through the European Centre for Medium-Range Weather Forecasts (http://www. ecmwf.int). Automated weather station (AWS) data can be requested from the University of Wisconsin–Madison Auto-matic Weather Station program (http://amrc.ssec.wisc.edu/). Model code and output are available upon request from the first author ([email protected]).
Acknowledgements. The authors wants to thank Roy Haggerty for fruitful discussions, the European Centre for Medium-Range Weather Forecasts (ECMWF) for making ERA-Interim reanalysis datasets publicly available, and the US National Science Founda-tion for financial support under NSF grant numbers ANT-0944343, ANT-1543267, and ANT-1543229. The authors appreciate the support of the University of Wisconsin–Madison Automatic Weather Station program (in particular Matthew Lazzara and Linda Keller) for the dataset, data display, and information, NSF grant number ANT-1245663. The authors hereby propose as a golden rule of ice core science: any time you have a new idea, Jakob Schwander already had that same idea several decades earlier.
Edited by: Eric Wolff
Reviewed by: C. Trudinger and one anonymous referee
References
Adolph, A. C. and Albert, M. R.: Gas diffusivity and permeability through the firn column at Summit, Greenland: measurements and comparison to microstructural properties, The Cryosphere, 8, 319–328, doi:10.5194/tc-8-319-2014, 2014.
Barnes, P. R. F., Wolff, E. W., and Mulvaney, R.: A 44 kyr pale-oroughness record of the Antarctic surface, J. Geophys. Res.-Atmos., 111, D03102, doi:10.1029/2005JD006349, 2006. Battle, M., Bender, M., Sowers, T., Tans, P. P., Butler, J. H., Elkins,
J. W., Ellis, J. T., Conway, T., Zhang, N., Lang, P., and Clar-ket, A. D.: Atmospheric gas concentrations over the past century measured in air from firn at the South Pole, Nature, 383, 231– 235, 1996.
Battle, M. O., Severinghaus, J. P., Sofen, E. D., Plotkin, D., Orsi, A. J., Aydin, M., Montzka, S. A., Sowers, T., and Tans, P. P.: Con-trols on the movement and composition of firn air at the West Antarctic Ice Sheet Divide, Atmos. Chem. Phys., 11, 11007– 11021, doi:10.5194/acp-11-11007-2011, 2011.
Bay, R., Rohde, R., Price, P., and Bramall, N.: South Pole paleowind from automated synthesis of ice core records, J. Geophys. Res.-Atmos., 115, D14126, doi:10.1029/2009JD013741, 2010. Bendel, V., Ueltzhöffer, K. J., Freitag, J., Kipfstuhl, S., Kuhs,
W. F., Garbe, C. S., and Faria, S. H.: High-resolution varia-tions in size, number and arrangement of air bubbles in the EPICA DML (Antarctica) ice core, J. Glaciol., 59, 972–980, doi:10.3189/2013JoG12J245, 2013.
Bender, M. L.: Orbital tuning chronology for the Vostok climate record supported by trapped gas composition, Earth Planet. Sc. Lett., 204, 275–289, doi:10.1016/S0012-821X(02)00980-9, 2002.
Buizert, C.: ICE CORE METHODS/Studies of Firn Air, in: Encyclopedia of Quaternary Science (2nd Edn.), edited by: Elias, S. A. and Mock, C. J., 361–372, Elsevier, Amsterdam, doi:10.1016/B978-0-444-53643-3.00330-7, 2013.
Buizert, C., Martinerie, P., Petrenko, V. V., Severinghaus, J. P., Trudinger, C. M., Witrant, E., Rosen, J. L., Orsi, A. J., Rubino, M., Etheridge, D. M., Steele, L. P., Hogan, C., Laube, J. C., Sturges, W. T., Levchenko, V. A., Smith, A. M., Levin, I., Con-way, T. J., Dlugokencky, E. J., Lang, P. M., Kawamura, K., Jenk, T. M., White, J. W. C., Sowers, T., Schwander, J., and Blunier, T.: Gas transport in firn: multiple-tracer characterisation and model intercomparison for NEEM, Northern Greenland, Atmos. Chem. Phys., 12, 4259–4277, doi:10.5194/acp-12-4259-2012, 2012. Buizert, C., Sowers, T., and Blunier, T.: Assessment of
diffu-sive isotopic fractionation in polar firn, and application to ice core trace gas records, Earth Planet. Sc. Lett., 361, 110–119, doi:10.1016/j.epsl.2012.11.039, 2013.
Buizert, C., Cuffey, K. M., Severinghaus, J. P., Baggenstos, D., Fudge, T. J., Steig, E. J., Markle, B. R., Winstrup, M., Rhodes, R. H., Brook, E. J., Sowers, T. A., Clow, G. D., Cheng, H., Edwards, R. L., Sigl, M., McConnell, J. R., and Taylor, K. C.: The WAIS Divide deep ice core WD2014 chronology – Part 1: Methane syn-chronization (68–31 ka BP) and the gas age–ice age difference, Clim. Past, 11, 153–173, doi:10.5194/cp-11-153-2015, 2015. Capron, E., Landais, A., Buiron, D., Cauquoin, A., Chappellaz, J.,
be-tween simulations and ice core air-δ15N measurements, Clim. Past, 9, 983–999, doi:10.5194/cp-9-983-2013, 2013.
Ceppi, P., Hwang, Y.-T., Liu, X., Frierson, D. M. W., and Hart-mann, D. L.: The relationship between the ITCZ and the South-ern Hemispheric eddy-driven jet, J. Geophys. Res.-Atmos., 118, 5136–5146, doi:10.1002/jgrd.50461, 2013.
Colbeck, S. C.: Air Movement in Snow Due to Windpumping, J. Glaciol., 35, 209–213, 1989.
Dee, D. P., Uppala, S. M., Simmons, A. J., Berrisford, P., Poli, P., Kobayashi, S., Andrae, U., Balmaseda, M. A., Balsamo, G., Bauer, P., Bechtold, P., Beljaars, A. C. M., van de Berg, L., Bid-lot, J., Bormann, N., Delsol, C., Dragani, R., Fuentes, M., Geer, A. J., Haimberger, L., Healy, S. B., Hersbach, H., Hólm, E. V., Isaksen, L., Kållberg, P., Köhler, M., Matricardi, M., McNally, A. P., Monge-Sanz, B. M., Morcrette, J.-J., Park, B.-K., Peubey, C., de Rosnay, P., Tavolato, C., Thépaut, J.-N., and Vitart, F.: The ERA-Interim reanalysis: configuration and performance of the data assimilation system, Q. J. Roy. Meteor. Soc., 137, 553–597, doi:10.1002/qj.828, 2011.
Ding, Q., Steig, E. J., Battisti, D. S., and Wallace, J. M.: Influence of the tropics on the Southern Annular Mode, J. Climate, 25, 6330– 6348, doi:10.1175/JCLI-D-11-00523.1, 2012.
Drake, S. A., Huwald, H., Parlange, M. B., Selker, J. S., Nolin, A. W., and Higgins, C. W.: Attenuation of wind-induced pressure perturbations in alpine snow, J. Glaciol., doi:10.1017/jog.2016.53, online first, 2016.
Etheridge, D. M., Pearman, G. I., and Fraser, P. J.: Changes in tropospheric methane between 1841 and 1978 from a high accumulation-rate Antarctic ice core, Tellus B, 44, 282–294, doi:10.1034/j.1600-0889.1992.t01-3-00006.x, 1992.
Etheridge, D. M., Steele, L. P., Langenfelds, R. L., Francey, R. J., Barnola, J. M., and Morgan, V. I.: Natural and anthropogenic changes in atmospheric CO2over the last 1000 years from air in Antarctic ice and firn, J. Geophys. Res., 101, 4115–4128, doi:10.1029/95jd03410, 1996.
Fabre, A., Barnola, J. M., Arnaud, L., and Chappellaz, J.: Determi-nation of gas diffusivity in polar firn: Comparison between ex-perimental measurements and inverse modeling, Geophys. Res. Lett., 27, 557–560, doi:10.1029/1999GL010780, 2000. Ghanbarian, B. and Hunt, A. G.: Universal scaling of gas
dif-fusion in porous media, Water Resour. Res., 50, 2242–2256, doi:10.1002/2013WR014790, 2014.
Goujon, C., Barnola, J. M., and Ritz, C.: Modeling the densifica-tion of polar firn including heat diffusion: Applicadensifica-tion to close-off characteristics and gas isotopic fractionation for Antarc-tica and Greenland sites, J. Geophys. Res.-Atmos., 108, 4792, doi:10.1029/2002jd003319, 2003.
Grachev, A. M. and Severinghaus, J. P.: Determining the thermal diffusion factor for40Ar/36Ar in air to aid paleoreconstruction of abrupt climate change, J. Phys. Chem. A, 107, 4636–4642, doi:10.1021/jp027817u, 2003a.
Grachev, A. M. and Severinghaus, J. P.: Laboratory determina-tion of thermal diffusion constants for 29N2/28N2 in air at temperatures from −60 to 0 degrees C for reconstruction of magnitudes of abrupt climate changes using the ice core fossil-air paleothermometer, Geochim. Cosmochim. Ac., 67, 345–360, doi:10.1016/s0016-7037(02)01115-8, 2003b.
Hörhold, M. W., Kipfstuhl, S., Wilhelms, F., Freitag, J., and Frenzel, A.: The densification of layered polar firn, J. Geophys. Res., 116, F01001, doi:10.1029/2009jf001630, 2011.
Johnsen, S. J.: Stable isotope homogenization of polar firn and ice, Proc. Symp. on Isotopes and Impurities in Snow and Ice, I.U.G.G. XVI, General Assembly, Grenoble, 210–219, Washing-ton D.C., 1977.
Kageyama, M., Valdes, P. J., Ramstein, G., Hewitt, C., and Wy-putta, U.: Northern Hemisphere Storm Tracks in Present Day and Last Glacial Maximum Climate Simulations: A Compar-ison of the European PMIP Models, J. Climate, 12, 742–760, doi:10.1175/1520-0442(1999)012<0742:NHSTIP>2.0.CO;2, 1999.
Kawamura, K., Severinghaus, J. P., Ishidoya, S., Sugawara, S., Hashida, G., Motoyama, H., Fujii, Y., Aoki, S., and Nakazawa, T.: Convective mixing of air in firn at four polar sites, Earth Planet. Sc. Lett., 244, 672–682, doi:10.1016/j.epsl.2006.02.017, 2006.
Kawamura, K., Parrenin, F., Lisiecki, L., Uemura, R., Vimeux, F., Severinghaus, J. P., Hutterli, M. A., Nakazawa, T., Aoki, S., Jouzel, J., Raymo, M. E., Matsumoto, K., Nakata, H., Mo-toyama, H., Fujita, S., Goto-Azuma, K., Fujii, Y., and Watan-abe, O.: Northern Hemisphere forcing of climatic cycles in Antarctica over the past 360,000 years, Nature, 448, 912–916, doi:10.1038/nature06015, 2007.
Kawamura, K., Severinghaus, J. P., Albert, M. R., Courville, Z. R., Fahnestock, M. A., Scambos, T., Shields, E., and Shuman, C. A.: Kinetic fractionation of gases by deep air convection in polar firn, Atmos. Chem. Phys., 13, 11141–11155, doi:10.5194/acp-13-11141-2013, 2013.
Landais, A., Barnola, J. M., Kawamura, K., Caillon, N., Delmotte, M., Van Ommen, T., Dreyfus, G., Jouzel, J., Masson-Delmotte, V., Minster, B., Freitag, J., Leuenberger, M., Schwander, J., Hu-ber, C., Etheridge, D., and Morgan, V.: Firn-airδ15N in modern polar sites and glacial-interglacial ice: a model-data mismatch during glacial periods in Antarctica?, Quaternary Sci. Rev., 25, 49–62, doi:10.1016/j.quascirev.2005.06.007, 2006.
Lazzara, M. A., Weidner, G. A., Keller, L. M., Thom, J. E., and Cassano, J. J.: Antarctic Automatic Weather Station Program: 30 Years of Polar Observation, B. Am. Meteorol. Soc., 93, 1519– 1537, doi:10.1175/BAMS-D-11-00015.1, 2012.
Leuenberger, M. C., Lang, C., and Schwander, J.: Delta15N mea-surements as a calibration tool for the paleothermometer and gas-ice age differences: A case study for the 8200 BP event on GRIP ice, J. Geophys. Res.-Atmos., 104, 22163–22170, doi:10.1029/1999JD900436, 1999.
Loulergue, L., Schilt, A., Spahni, R., Masson-Delmotte, V., Blu-nier, T., Lemieux, B., Barnola, J.-M., Raynaud, D., Stocker, T. F., and Chappellaz, J.: Orbital and millennial-scale features of atmo-spheric CH4over the past 800,000 years, Nature, 453, 383–386, doi:10.1038/nature06950, 2008.
Martinerie, P., Raynaud, D., Etheridge, D. M., Barnola, J. M., and Mazaudier, D.: Physical and Climatic Parameters which Influ-ence the Air Content in Polar Ice, Earth Planet. Sc. Lett., 112, 1–13, doi:10.1016/0012-821X(92)90002-D, 1992.
of layering on bubble trapping in polar firn, J. Geophys. Res.-Atmos., 120, 2558–2574, doi:10.1002/2014JD022766, 2015. Nilson, R. H., Peterson, E. W., Lie, K. H., Burkhard, N. R.,
and Hearst, J. R.: Atmospheric pumping: A mechanism caus-ing vertical transport of contaminated gases through fractured permeable media, J. Geophys. Res.-Sol. Ea., 96, 21933–21948, doi:10.1029/91JB01836, 1991.
Orsi, A., Severinghaus, J. P., Buizert, C., Baggenstos, D., Kawa-mura, K., and Beaudette, R.: The inert gas isotope record at WAIS Divide, in: WAIS Divide Ice Core 2014 Science Meeting, La Jolla, CA, USA, 2014.
Parrenin, F., Barker, S., Blunier, T., Chappellaz, J., Jouzel, J., Landais, A., Masson-Delmotte, V., Schwander, J., and Veres, D.: On the gas-ice depth difference (1depth) along the EPICA Dome C ice core, Clim. Past, 8, 1239–1255, doi:10.5194/cp-8-1239-2012, 2012.
Powers, D., O’Neill, K., and Colbeck, S.: Theory of natural convec-tion in snow, J. Geophys. Res.-Atmos., 90, 10641–10649, 1985. Raynaud, D. and Lorius, C.: Climatic implications of total gas content in ice at Camp Century, Nature, 243, 283–284, doi:10.1038/243283a0, 1973.
Rhodes, R. H., Faïn, X., Brook, E. J., McConnell, J. R., Maselli, O. J., Sigl, M., Edwards, J., Buizert, C., Blunier, T., Chappellaz, J., and Freitag, J.: Local artifacts in ice core methane records caused by layered bubble trapping and in situ production: a multi-site in-vestigation, Clim. Past, 12, 1061–1077, doi:10.5194/cp-12-1061-2016, 2016.
Rojas, M., Moreno, P., Kageyama, M., Crucifix, M., Hewitt, C., Abe-Ouchi, A., Ohgaito, R., Brady, E. C., and Hope, P.: The Southern Westerlies during the last glacial maximum in PMIP2 simulations, Clim. Dynam., 32, 525–548, doi:10.1007/s00382-008-0421-7, 2009.
Rommelaere, V., Arnaud, L., and Barnola, J. M.: Reconstructing recent atmospheric trace gas concentrations from polar firn and bubbly ice data by inverse methods, J. Geophys. Res.-Atmos., 102, 30069–30083, doi:10.1029/97JD02653, 1997.
Sahimi, M., Davis, H. T., and Scriven, L.: Dispersion in dis-ordered porous media, Chem. Eng. Commun., 23, 329–341, doi:10.1080/00986448308940483, 1983.
Scheidegger, A.: General theory of dispersion in porous media, J. Geophys. Res., 66, 3273–3278, 1961.
Scheidegger, A. E.: Statistical hydrodynamics in porous media, J. Appl. Phys., 25, 994–1001, 1954.
Schwander, J. and Stauffer, B.: Age difference between polar ice and the air trapped in its bubbles, Nature, 311, 45–47, doi:10.1038/311045a0, 1984.
Schwander, J., Stauffer, B., and Sigg, A.: Air mixing in firn and the age of the air at pore close-off, Ann. Glaciol., 10, 141–145, 1988. Schwander, J., Barnola, J. M., Andrie, C., Leuenberger, M., Ludin, A., Raynaud, D., and Stauffer, B.: The Age of the Air in the Firn and the Ice at Summit, Greenland, J. Geophys. Res.-Atmos., 98, 2831–2838, doi:10.1029/92JD02383, 1993.
Schwander, J., Sowers, T., Barnola, J. M., Blunier, T., Fuchs, A., and Malaize, B.: Age scale of the air in the summit ice: Impli-cation for glacial-interglacial temperature change, J. Geophys. Res.-Atmos., 102, 19483–19493, doi:10.1029/97JD01309, 1997. Severinghaus, J. P., Sowers, T., Brook, E. J., Alley, R. B., and Ben-der, M. L.: Timing of abrupt climate change at the end of the
Younger Dryas interval from thermally fractionated gases in po-lar ice, Nature, 391, 141–146, doi:10.1038/34346, 1998. Severinghaus, J. P., Grachev, A., and Battle, M.: Thermal
fractionation of air in polar firn by seasonal temperature gradients, Geochem. Geophys. Geosy., 2, 2000GC000146, doi:10.1029/2000GC000146, 2001.
Severinghaus, J. P., Grachev, A., Luz, B., and Caillon, N.: A method for precise measurement of argon 40/36 and krypton/argon ra-tios in trapped air in polar ice with applications to past firn thickness and abrupt climate change in Greenland and at Siple Dome, Antarctica, Geochim. Cosmochim. Ac., 67, 325–343, doi:10.1016/S0016-7037(02)00965-1, 2003.
Severinghaus, J. P., Albert, M. R., Courville, Z. R., Fahnestock, M. A., Kawamura, K., Montzka, S. A., Muhle, J., Scambos, T. A., Shields, E., Shuman, C. A., Suwa, M., Tans, P., and Weiss, R. F.: Deep air convection in the firn at a zero-accumulation site, central Antarctica, Earth Planet. Sc. Lett., 293, 359–367, doi:10.1016/j.epsl.2010.03.003, 2010.
Sowers, T., Bender, M., Raynaud, D., and Korotkevich, Y. S.:
δ15N of N2 in air trapped in polar ice: A tracer of gas transport in the firn and a possible constraint on ice age-gas age differences, J. Geophys. Res.-Atmos., 97, 15683–15697, doi:10.1029/92JD01297, 1992.
Sturrock, G. A., Etheridge, D. M., Trudinger, C. M., Fraser, P. J., and Smith, A. M.: Atmospheric histories of halocarbons from analysis of Antarctic firn air: Major Montreal Protocol species, J. Geophys. Res.-Atmos., 107, 4765, doi:10.1029/2002jd002548, 2002.
Trudinger, C. M., Enting, I. G., Etheridge, D. M., Francey, R. J., Levchenko, V. A., Steele, L. P., Raynaud, D., and Arnaud, L.: Modeling air movement and bubble trapping in firn, J. Geophys. Res.-Atmos., 102, 6747–6763, doi:10.1029/96JD03382, 1997. Trudinger, C. M., Etheridge, D. M., Rayner, P. J., Enting, I. G.,
Stur-rock, G. A., and Langenfelds, R. L.: Reconstructing atmospheric histories from measurements of air composition in firn, J. Geo-phys. Res.-Atmos., 107, 4780, doi:10.1029/2002jd002545, 2002. Trudinger, C. M., Enting, I. G., Rayner, P. J., Etheridge, D. M., Buizert, C., Rubino, M., Krummel, P. B., and Blunier, T.: How well do different tracers constrain the firn diffusivity profile?, Atmos. Chem. Phys., 13, 1485–1510, doi:10.5194/acp-13-1485-2013, 2013.
Turner, J., Phillips, T., Hosking, J. S., Marshall, G. J., and Orr, A.: The Amundsen Sea low, Int. J. Climatol., 33, 1818–1829, doi:10.1002/joc.3558, 2013.
WAIS Divide Project Members: Onset of deglacial warming in West Antarctica driven by local orbital forcing, Nature, 500, 440–444, doi:10.1038/nature12376, 2013.
WAIS Divide Project Members: Precise interpolar phasing of abrupt climate change during the last ice age, Nature, 520, 661–665, doi:10.1038/nature14401, 2015.