www.clim-past.net/7/1327/2011/ doi:10.5194/cp-7-1327-2011
© Author(s) 2011. CC Attribution 3.0 License.
Climate
of the Past
Past surface temperatures at the NorthGRIP drill site from the
difference in firn diffusion of water isotopes
S. B. Simonsen1,2, S. J. Johnsen1, T. J. Popp1,3, B. M. Vinther1, V. Gkinis1, and H. C. Steen-Larsen1 1Centre for Ice and Climate, Niels Bohr Institute, University of Copenhagen, Denmark
2Danish Climate Centre, Danish Meteorological Institute, Denmark
3Institute of Arctic and Alpine Research, Geological Sciences and Environmental Studies, University of Colorado, USA Received: 17 February 2011 – Published in Clim. Past Discuss.: 2 March 2011
Revised: 7 October 2011 – Accepted: 31 October 2011 – Published: 2 December 2011
Abstract. A new ice core paleothermometer is introduced based on the temperature dependent diffusion of the stable water isotopes in the firn. A new parameter called differential diffusion length is defined as the difference between the dif-fusion length of the two stable water isotopologues2H1H16O and1H218O. A model treatment of the diffusion process of the firn and the ice is presented along with a method of re-trieving the diffusion signal from the ice core record of wa-ter isotopes using spectral methods. The model shows how the diffusion process is highly dependent on the inter-annual variations in the surface temperatures. It results in a diffu-sion length longer than if the firn was isothermal. The longer diffusion length can be explained by the strong nonlinearly behaviour of the saturation pressure over ice in the range of the surface temperature fluctuations.
The method has been tested on δ18O and δD measure-ments, spanning the transition from the last glacial to the holocene, from the NorthGRIP ice core. The surface tem-perature reconstruction based on the differential diffusion resembles other temperature reconstructions for the North-GRIP ice core. However, the Allerød warming is seen to be significantly warmer than observed in other ice core based temperature reconstructions. The mechanisms behind this behaviour are not fully understood.
The method shows the need of an expansion of high reso-lution stable water isotope datasets from ice cores. However, the new ice core paleothermometer presented here will give valuable insight into past climate, through the physical pro-cess of isotope diffusion in the firn column of ice sheets.
Correspondence to: S. B. Simonsen
1 Introduction
The temperature dependency of stable water isotopes in pre-cipitation has been observed since the 1950s (Dansgaard, 1953, 1964; Dansgaard et al., 1969). This dependency has been used to reconstruct past climate from ice cores (e.g. Johnsen et al., 1989). However, the isotope-temperature rela-tionship does not consistently hold through time. The biases using stable water isotopes is the dependency on the source area, air-parcel trajectory, isotopic ratio of oceanic water, seasonality and cloud-surface temperature (Jouzel et al., 1997). Therefore, other methods have been used to recon-struct the past temperature record from ice cores. Over long time scales, borehole thermometry has been used to constrain the stable water isotope temperature proxy (Johnsen et al., 1995) giving an estimate for the past surface temperature at the precipitation site. During rapid climate changes, the frac-tionation of gas isotopes 1514N
N and
40Ar
36Ar (Severinghaus et al.,
1998; Jouzel, 1999; Severinghaus and Brook, 1999), can be used as a paleothermometer.
A new method of estimating paleotemperatures from ice core records is presented in this paper to shed light on the surface temperature history of the ice sheet at the drill sites, especially at times of rapid climate changes. We will test the method implied by Johnsen et al. (2000, 2006) with available data from the NorthGRIP ice core. Thereby establishing a new ice core paleothermometer based on the difference in the temperature dependent diffusion of two water isotopesδ18O andδD. Here, theδ-value is defined as
δ=R−Rocean
Rocean
, (1)
where R is the ratio of the species 1816OO or
D
H and Rocean
defined by “Standard Mean Ocean Water” (SMOW), which was defined by Craig (1961) with respect to the National Bu-reau of Standards reference sample 1. The amplitude of the original isotopic signal is smoothed by diffusion in the firn column1, mainly through the vapour phase. This diffusion in the vapour phase is highly temperature dependent and is relatively well understood (Rempel and Wettlaufer, 2003). Therefore, the diffusion signal can be recovered from the ice to give information on the temperature changes affecting the measured isotopic signal in the ice cores.
2 Modelling isotopic diffusion
Two models have been setup to describe the diffusion pro-cesses of stable water isotopes in dry firn; Whillans and Grootes (1985) and Johnsen (1977). Both models give sim-ilar results for the diffusion of the water isotopes (Johnsen et al., 2000). Following the approach from Johnsen (1977) and Johnsen et al. (2000), the origin of the coordinate sys-tem’s z-axis follows the snow layer as it moves down through the firn and ice matrix. Accounting for the vertical strain rate and assuming a uniform strain rateε˙zthe diffusion equation
becomes
∂δ
∂t =Di(t )
∂2δ
∂z2− ˙εz(t )z ∂δ
∂z , (2)
whereδ=δ(z0,t )is the smoothed and compressed isotope profile at time, z0=zexpR0tε(t˙ 00)t00 is the vertical compres-sion of the original profile andDi is the diffusivity of the
isotopic speciesi. In order to solve the diffusion equation, Johnsen (1977) defined the diffusion lengthσ given by
1 2
dσ2
dt − ˙εz(t )σ
2=D
i(t ) . (3)
The solution to the diffusion equation is then derived by the convolution(∗)of δ(z,0)with a Gaussian having the stan-dard deviationσ
δ(z0,t )=δ(z0,0)∗ 1
σ
√
2πexp
− z
2 2σ2
!
, (4)
(Johnsen, 1977; Johnsen et al., 2000). In the firn column, the strain rate is given by
˙
εz= −
1
ρ ∂ρ
∂t −
∂u
∂x (5)
whereuis the horizontal velocity andρ is modelled by the Herron-Langway densification model (Herron and Langway, 1980). Having established the frame of the diffusion pro-cess, the diffusion in both firn and ice will now be discussed separately.
1Firn can be defined as snow which has survived one melt season without being transformed into ice (Paterson, 2002). Here we define the firn column as the transformation stage of snow into ice, where an interconnected network of pores makes the diffusion of stable water isotopes possible throughout the vapour phase.
2.1 Diffusion in firn
In the firn the diffusion process is caused by an exchange of water species in the vapour phase, which smoothes the sea-sonal amplitude of the isotopic ratio ofδ18O andδD. The dif-fusion is restricted by the shape of the interconnected pores in the firn given by the tortuosity factor τ, resulting in an effective diffusivity Deff=
Dai
τ of stable water isotopes
in-side the pore space (Johnsen et al., 2000). The diffusivity of airDaihas been measured in the lab (Merlivat, 1978; Cappa et al., 2003; Luz et al., 2009) and we use the value found by Merlivat (1978) in the following. Based on Schwander et al. (1988) and Jean-Baptiste et al. (1998), Johnsen et al. (2000) showed that the tortuosity can be assumed to be a function of the densityρ
1
τ =
( 1−bτ
ρ ρice
2
, forρ≤ρcloseeff
0 , forρ > ρcloseeff
, (6)
wherebτ=1.30 andρcloseeff=
ρice √
bτ is the effective pore close off density. Assuming the firn grains are well mixed and in isotopic equilibrium with the vapour, the diffusivity of firn can be expressed using the effective diffusivity and the firn density
Dfi=
1
ρ−
1
ρice mp
RTK
Dai
αiτ
, (7)
wherem is the molar weight of water, p is the saturation vapour pressure over ice, R is the gas constant, TK is the temperature (K) and αi is the fractionation factor for
iso-topologuei. The saturation vapour pressure has been found empirically to be
p=3.454·1012exp
−6133
TK
[ Pa ] , (8)
(Johnsen et al., 2000). To model the diffusion process in the firn column, the temperature at which the diffusion takes place is an important parameter. The firn temperature is modelled using the general transfer equation (Paterson, 2002, pp.224), driven by the surface temperature. The surface tem-perature is modelled by a superposition of two cosines (Ben-son, 1962, p. 44), giving the observed narrow summer max-ima and a broader winter minmax-ima. We parameterize the sur-face temperature fluctuations as
−450 −40 −35 −30 −25 −20 −15 −10
2
4
6
8
10
12
a)
Firn Temperatur [deg. C]
Firn depth [m]
January February March April May June July August September October November December
0 0.02 0.04 0.06 0.08 0.1 0.12
0
10
20
30
40
50
60
b)
Diffusion length [m]
Firn depth [m] σ182
OAnnual mean temp.
σ182
O
Var. surface temp.
0 0.01 0.02 0.03 0.04 0.05 0.06 0.07 0.08
0
0.5
1
1.5
2
2.5
3
3.5
4
c)
Diffusion length [m]
Firn depth [m]
Annual mean Temp. January March May July September November
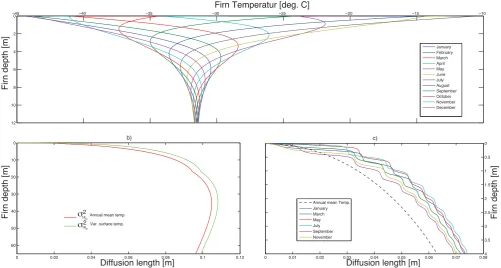
Fig. 1. Temperature profiles and diffusion lengths for the NorthGRIP firn column modelled under present day conditions. (a) The temperature field to a given month of the year. (b) The model diffusion length ofδ18O both under constant temperature conditions and using the temperature variations seen in (a) from the surface to the pore close off. (c) The diffusion length of the top 4 m for selected months.
the temperature history of a layer moving down through the firn can be derived, seen as the dotted line in Fig. 1a. Fig-ure 1b shows how the calculated diffusion length ofδ18O becomes longer when deriving the diffusion length with a polythermal firn instead of only using the mean annual tem-perature. The main effect of the polythermal firn is in the top meters, as seen in Fig. 1c. This effect is due to the exponen-tial nature of the saturation vapour pressure over ice, giving a stronger signal from the summer warming. The modelled diffusion lengths forδ18O andδD in the firn show the value of incorporating changes in the surface temperature. By al-lowing the surface temperature to vary according to Eq. (9), we can obtain the most accurate picture of the diffusion in the firn by numerical modelling.
2.2 Diffusion in ice
Below the effective pore close-off the diffusion of the iso-topic ratio is expected to be single crystal self-diffusion with a diffusivity of iceDice=3.96·104exp
7273
T
h
m2
yr i
(Ram-seier, 1967), which is significantly less than the firn diffusiv-ity for stable water isotopes. Assuming the diffusion length at the pore close offστ, Eq. (3) gives the self diffusion length
of the iceσice
στ2= σ
2 sec exp2Rtsec
tτ ε(t )dt˙
−2 Z tsec
tτ
Di(t )exp
−2 Z t
tτ
˙
ε(θ )dθ
dt
| {z }
σ2 ice
, (10)
where the indexsecrefers to the section of ice core where the samples are taken. It has been speculated that other processes are involved in the diffusion of the isotopic signal other than the single crystal self-diffusion, as the report of excess diffu-sion in the GRIP ice core by Johnsen et al. (2000). However, similar excess diffusion has not been found in other ice cores in Greenland. Hence, the diffusion process of ice is assumed here to only be the single crystal self-diffusion.
Surface Temperature [ ᵒC ] Accumulation [m ice /year ] 0.2 0.2 0.4 0.4 0.4 0.6 0.6 0.6 0.8 0.8 0.8 1 1 1 1.2 1.2 1.2 1.4 1.4 1.4 1.6 1.6 1.6 1.8 1.8 1.8 2 2 2 2 3 3 3 3 4 4 4 4 5 5 5 5 6 6 6 6 7 7 7 7 8 8 8 8 9 9 9 9 10 10 10 10 12 12 12 12 14 14 14 14 16 16 16 16 18 18 18 18 20 20 20 20 25 25 25 30 30 30 35 35 35 40 40 40 45 45 45 50 50 60 60 70 70 80 80 90 90
−80 −70 −60 −50 −40 −30 −20 −10
10−2
10−1
100
Δ στ2 [cmice2]
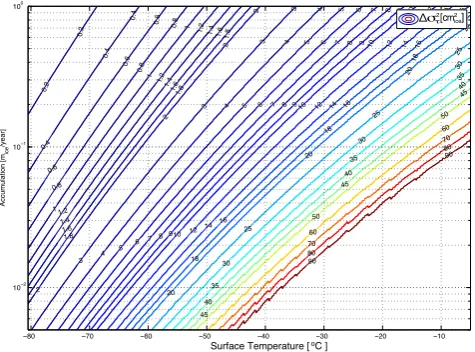
Fig. 2. Modelled differential diffusion length at the pore close-off depending on accumulation and surface temperature.
2.3 Differential diffusion length
The differential diffusion length (1σ) is defined from the dif-fusion lengths of theδ18O andδD
1σ2≡σ182O−σD2 . (11)
Using the equations derived above (Eqs. 6–10), the differen-tial diffusion length at the base of the firn (at pore close-off) can be modelled as a function of the accumulation and the surface temperature, see Fig. 2. This model will be used in the following to estimate the temperature from the differen-tial diffusion length and the accumulation record.
In order to estimate the past temperature from Fig. 2, the measured diffusion length of an ice section σsec has to be corrected for the thinning occurring from pore close-off until the final depth. Assuming only self-diffusion below the pore close-off the differential diffusion length correction simpli-fies to
1στ2= 1σ
2 sec exp2Rtsec
tτ ε(t )dt˙
. (12)
Here1στ2is the differential diffusion length at the effective pore close-off.
Based on the isotope borehole temperature reconstruction for NorthGRIP (Johnsen et al., 1995, personal communica-tion) seen in the lower panel of Fig. 3, the diffusion length for NorthGRIP ice core has been modelled without the ice dif-fusion in Fig. 3. The figure also shows the difdif-fusion length ofδ17O, which is also being measured in ice cores (Landais et al., 2008). Using δ17O, a second differential diffusion length of stable water isotopes can be defined by
1σ172 ≡σ172O−σD2 . (13)
This differential diffusion ofδ17O and deuterium is predicted to have a stronger signal in the isotopic record and, thereby,
500 1000 1500 2000 2500 3000
0 1 2 3 4 5 6 7 8 9 Depth
Diffusion length [cm]
σ18O
σD σ17O
Δσ Δσ17 σice
500 1000 1500 2000 2500 3000−50
−40 −30
Depth δ
18O [permil]
500 1000 1500 2000 2500 3000
−60 −40 −20
Depth
Surface Temp. [
° C]
Fig. 3. Modelled diffusion lengths along the NorthGRIP ice core, based on NorthGRIP isotope borehole thermometry (shown in the lower panel). Also shown for reference is theδ18O record for NorthGRIP. As seen in the top panel, the modelled differential dif-fusion lengths are almost not seen in the interstadials in the Last Glacial. For the modelling of the diffusion length ofδ17O the frac-tionation constants reported by Barkan and Luz (2007) are used.
be a better candidate for differential diffusion studies. How-ever,117O data have not yet become available for studies of this differential diffusion. Hence, in the following, the differ-ential diffusion will refer to Eq. (11).
3 Spectral methods and estimations
Having modelled the diffusion process of stable water iso-topes, the diffusion signal can be retrieved from the measured profile using spectral methods. Using the convolution theo-rem, Eq. (4) can be transformed to the frequency domain to give
=(k)= =(δ(z0,0))exp
−1
2σ 2k2
, (14)
where=is the Fourier transform and thekis the wave num-berk=2π ω. Expressed as the power spectral density (PSD) Eq. (14) gives
P (k)=P0exp(−σ2k2) , (15)
whereP is the PSD of the isotopic signal measured in the ice core andP0is the power density spectrum of the original isotopic signal as precipitated when the snow was deposited. The diffusion length of an isotopic data point can be deter-mined from Eq. (15). The differential diffusion length PSD is then defined as
P1σ=
PD
P18O
= P0D
P018O
exp(k21σ2) , (16)
Snow precipitated on the surface of the ice sheet is as-sumed to have white-noise characteristics with a peak cor-responding to the annual climate cycle, later the wind drift shifts the spectra to blue and finally diffusion shifts the spec-tra to a red-noise specspec-tra (Fisher et al., 1985). Equation (15) shows this red-noise property of the PSD of isotopic data caused by the diffusion. According to Eq. (15), the diffu-sion length can be estimated from the PSD of the data by a linear fit to the red part of the spectra. However, the pre-cision of the fit is highly dependant on the method of PSD estimation. The Maximum Entropy Method (MEM) (An-dersen, 1974) has proven to be a reliable method used for PSD estimation of short isotopic datasets (Simonsen, 2008), down to about 200 sample points, compared to other meth-ods, such as FFT or the Wiener-Khinthine’s theorem. When interested in the diffusion estimates, great spectral resolution is not needed, but the order of the MEM has to be chosen to minimize the error in the linear fit of the red part of the spectra. The autoregressive nature of the MEM leads to cor-related points in the PSD. The uncertainty of the fit can then be estimated from the one standard deviation confidence in-terval and the degrees of freedomNDOF=Npoles−2, where
Npolesis the number of poles in the fit and 2 accounts for the two estimated parameters in the fit.
In addition to the shape of the spectra described by Eq. (15), a white-noise tail is often observed in the PSD of the stable water isotope record. Assuming uniform white noise, the white-noise tail can be used to estimate the noise levels of the measurements and may be subtracted from the estimated PSD.
The discrete sampled isotopic record, with a sampling size of 1, gives rise to an aliasing effect in the spectra. The aliasing effect can be estimated by evaluating the Fourier transform of the sampling theorem (Press et al., 2007) and Eq. (15) at the nyquist frequencyfnq=211,
σaliasing2 =2ln
π
2
π 1
2 . (17)
σaliasing2 is the aliasing effect and should be subtracted from the estimated diffusion length forδ18O andδD. As long as bothδ18O andδD have been sampled with the same resolu-tion, the aliasing effect vanishes for the differential diffusion length.
4 Differential diffusion as surface temperature estimator at the last glacial transition
As shown above, the differential diffusion is strongly tem-perature dependent and can be retrieved from the isotopic record using spectral methods. From the definition of the differential diffusion, the single crystal self-diffusion of the ice matrix can be neglected. The signal retrieved from the ice cores can be directly linked to the surface temperature at the period of the precipitation through the understanding of
the diffusion process in the firn column. The modelled dif-ferential diffusion in Fig. 2 is the key to the interpretation of the retrieved differential diffusion length. By correcting the measured differential diffusion length for strain effects and using the accumulation record, the past surface temperatures can be derived. Ice core data have to be corrected for the gen-eral flow of the ice in the proximity of the drill site. In the last part of this study, we test the performance of the differential diffusion method with measurements from the NorthGRIP ice core (NGRIP Members, 2004). Recently a section of the NorthGRIP ice core has been measured for bothδ18O andδD with a resolution of 5 cm. These measurements provide the ideal dataset for testing the spectral method of reconstructing past climate from the differential diffusion.
A number of ice flow models have been developed for the NorthGRIP site, among them are Grinsted and Dahl-Jensen (2002) (In the following, this model will be referred to as the GDJ-model) and Johnsen et al. (2001). Such flow models can provide both the time scale and strain history in relation to the depth of the ice core. For the NorthGRIP site, annual layer counting has provided the most accurate time scale, the GICC05 Greenland Ice Core Chronology 2005 (GICC05) (Andersen et al., 2006; Svensson et al., 2006; Svensson et al., 2008). The GICC05 dates the NorthGRIP ice core through-out the last 60 kyr. In the following, a version of ss09sea (Johnsen et al., 2001) corrected to fit GICC05 will provide the strain history for the NorthGRIP ice core. Applying the strain history from ss09sea to the observed layer thickness in GICC05 provides us with the annual accumulation record needed for estimating past temperatures from the diffusion record of the NorthGRIP isotope series.
Since the available dataset covers a time period known for its abrupt climate changes, it would not be adequate to only derive one PSD from the full dataset. The MEM estimation of the PSD is known to be capable of handling short datasets. Therefore, a running mean estimation of the differential dif-fusion length is proposed, with a window size ofN, for each of the windows the differential diffusion is found along with the uncertainty. The differential diffusion of the window is converted into a surface temperature using the mean accu-mulation from the GICC05. To ensure reproducibility and to suppress outliers the temperature reconstruction is done both for the running mean, running forward and backwards in time, and the mean of the two is calculated.
−50 −45 −40 −35 −30
Surface temperature [
°C]
Δσ Temperature
NGRIP isotope borehole thermometry GDJ solution
Arthern firn model Close−off at 830 kg/m3
10.5 11 11.5 12 12.5 13 13.5 14 14.5 15 15.54
6 8 10 12 14
Excess
0 10 20 30 40 50 60
−50 −40 −30
GICC05 age [kyr b2k]
δ
18O [
%
o
]
Younger Dryas Allerød Bølling
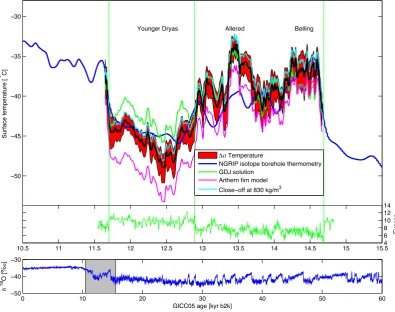
Fig. 4. Top panel: (Black curve) The temperature reconstruction based on the differential diffusion with a window ofN=200, which is moved1N=11. (Red shading) The confidence interval of the fitted PSD. (Green curve) Surface temperature reconstruction using flow parameters by DGJ. (Magenta curve) Surface temperature reconstruction using parameterization of the Herron-Langway firn densification model by Arthern et al. (2010). (Cyan curve) Surface temperature reconstruction using a close-off density of 830 kg per m3. For comparison the Isotope borehole thermometry are also show in blue. Middle panel: the deuterium excess record for the period. Major climatic shifts are marked with vertical green lines both on the top and middle panel. Lower panel: theδ18O record of the NorthGRIP ice core on the GICC05 timescale, for the last 60 kyr. All times are on the GICC05 time scale.
induced by the uncertainty in accumulation and strain rate. Therefore, in the following temperature reconstruction of the transition in the NorthGRIP ice core, the only error presented is the error estimate of the linear fit to the power spectra.
To evaluate the sensitivity of the temperature reconstruc-tion based on the differential diffusion of the stable water isotopes, we have to look into the nature of the modelled diffusion length at the pore close-off, as seen in Fig. 2. The contour plot clearly shows how an uncertainty in the accumu-lation/stain rate is more pronounced in a cold climate condi-tions than warm climate condicondi-tions giving a constant accu-mulation for the two periods.
The temperature reconstruction of the Bølling/Allerød-warming (GI-1, see Bj¨orck et al., 1998) and the Younger Dryas (YD) are shown in Fig. 4. The temperature reconstruc-tion has not been corrected for the white measuring noise, since the limited sample size combined with the depth of the ice core samples makes it impossible to pinpoint the white-noise tail. The typical white-noise level forδ18O measurements are
0.070/00and 0.50/00forδD, the measuring noise would give rise to an error in the estimated differential diffusion length of 0.180/00using typical values of the parameters in the dif-ferential diffusion estimation at the time of the reconstruc-tion. The error due to measuring uncertainties is well within the error of the fitted differential diffusion length and may be neglected in the temperature reconstruction as long as the white-noise tail is not part of the fitted area.
pore close at 830 kg per m3. These three approaches cannot be seen as a real confidence interval for the reconstructed sur-face temperature by differential diffusion, but show the effect of the model assumptions.
Finally, the temperature profile (in black) in Fig. 4 is be-lieved to be the surface temperature during the period as im-plied by the differential diffusion of the two stable water iso-topes.
5 Discussion
The borehole isotope temperature reconstruction and the dif-ferential diffusion temperature are in general agreement of the surface temperature in the cold Younger Dryas and the warm Bølling (GI-1e). However, the reconstructed Allerød warming does not match the borehole isotope reconstruc-tion, especially at the time around 13.5 kyr b2k. Here the surface temperatures are just as warm as in the Bølling. This warming in the Allerød cannot be seen directly in theδ18O record nor in the excess. The only indication in favour of the estimated warming is the lowering in the excess just at the 13.5 kyr b2k. Another test to verify this warming seen by the differential diffusion is to look at the accumulation record it-self, since a warming normally results in an increased layer thickness. However, when looking at the GICC05 (Svensson et al., 2006), no increases in the accumulation are recorded for the period. The lack of an increase in the accumulation of NorthGRIP record contradicts the differential diffusion temperature reconstruction. The only temperature record re-assembling the behaviour seen in the differential diffusion surface temperature of the Allerød period is the sea surface temperatures (SST) found in marine sediment cores from the Iberian Margin at the coast of Portugal (Bard et al., 2000) and the Cariaco Basin on the coast of Venezuela (Lea et al., 2003) for the same time period. The reason for the Allerød to show up as a warm anomaly in the differential diffusion surface temperature is not understood. However, the dataset of high resolution measurements ofδ18O andδD have to be expanded to see if the Allerød warming is just an anomaly in the temperature reconstruction by differential diffusion or if such deviations from the isotope temperatures are common in the record when using differential diffusion to reconstruct surface temperatures.
Three major shifts in the deuterium excess can be recog-nized in the record shown in Fig. 4, are also clearly seen as shifts in differential diffusion temperature reconstruction. The deuterium excess is believed to hold information about the precipitation source area (Johnsen et al., 1989; Masson-Delmotte et al., 2005), and the shifts have been defined as the transition from one climate period to another (Steffensen et al., 2008). The major shifts in the deuterium excess are seen in the low frequency part of the PSD and this frequency is excluded from the temperature reconstruction. Therefore,
it is reinsuring that the temperature reconstruction sees these major shifts in deuterium excess as climate transitions.
Our method for reconstructing past surface temperatures from the difference in the diffusion for stable water isotopes is highly dependent on accurate knowledge of past accumula-tion and strain histories. Therefore, the method is applicable in locations, such as Greenland, where interannual changes in impurity content makes it possible to date the ice core with great precision from annual layer counting. In locations with lower accumulation, the success of the method becomes re-liable on the accuracy of the model strain and accumulation history. However, at low accumulation sites, interesting cli-mate transitions may be located at shallower depths and may not be as vulnerable to flow features as the deep transition in the NorthGRIP ice core.
6 Conclusions
Based on the definition of the differential diffusion and the modelling of the diffusion processes in the firn column it is shown how the differential diffusion length can be theoret-ically recovered down to about GI-8 in the NorthGRIP ice core. The methods have been applied to a dataset of high-resolution measurements of the two stable water isotopes
δ18O andδD from the glacial transition. This results in a new surface temperature reconstruction of the last glacial transi-tion, which mostly agrees with previous temperature recon-structions made for this site. However, the Allerød warming is seen to be much warmer in the differential diffusion re-construction than otherwise seen in the ice cores and it more resembles the SST history of the marine sediment core from the Cariaco basin. The mechanisms behind this behaviour are not yet known.
There is a need for expanding the archive of high resolu-tion measurement of stable water isotopes in ice cores for im-proving the use of the differential diffusion paleothermome-try. Recently, online water isotope measurements of ice cores with the use of melter systems and infrared spectroscopy have been developed (Gkinis et al., 2011). These methods have the potential to yield measurements of very high reso-lution that can be beneficial for the type of temperature re-constructions we present here. Therefore, the method pre-sented here will give valuable insight into past climate, based on the physical process of diffusion and directly coupled to the surface temperature at the time of firn densification. The method presented here is only applicable for reconstructing the temperature signal before the ice self-diffusion becomes a dominant factor and cannot be corrected for.
Acknowledgements. The authors would like to thank the Danish
Germany (AWI), Iceland. (RannIs), Japan (MEXT), Sweden (SPRS), Switzerland (SNF) and the USA (NSF, Office of Polar Programs). NCAR/EOL for providing the automated weather station data from the summit station under sponsorship of the National Science Foundation.
Edited by: C. Barbante
References
Andersen, K. K., Svensson, A., Johnsen, S. J., Rasmussen, S. O., Bigler, M., R¨othlisberger, R., Ruth, U., Siggaard-Andersen, M.-L., Peder Steffensen, J., Dahl-Jensen, D., Vinther, B. M., and Clausen, H. B.: The Greenland Ice Core Chronology 2005, 15– 42 ka, Part 1: constructing the time scale, Quaternary Sci. Rev., 25, 3246–3257, doi:10.1016/j.quascirev.2006.08.002, 2006. Andersen, N.: On the Calculation of Filter Coefficients for
Maximum Entropy Spectral Analysis, Geophysics, 39, 69–72, doi:10.1190/1.1440413, 1974.
Arthern, R. J., Vaughan, D. G., Rankin, A. M., Mulvaney, R., and Thomas, E. R.: In situ measurements of Antarctic snow com-paction compared with predictions of models, J. Geophys. Res., 115, F03011, doi:10.1029/2009JF001306, 2010.
Bard, E., Rostek, F., Turon, J.-L., and Gendreau, S.: Hydrological Impact of Heinrich Events in the Subtropical Northeast Atlantic, Science, 289, 1321–1324, doi:10.1126/science.289.5483.1321, 2000.
Barkan, E. and Luz, B.: Diffusivity fractionations of H162 O/H172 O and H162 O/H182 O in air and their implications for isotope hydrology, Rapid Commun. Mass. Sp., 21, 2999–3005, doi:10.1002/rcm.3180, 2007.
Benson, C. S.: Stratigraphic Studies in the Snow and Firn of the Greenland Ice Sheet, Tech. Rep. 70, SIPRE (Snow Ice and Permafrost Research Establishment) Research Report, US army corps of engineers, Hanover, New Hampshire, 1962.
Bj¨orck, S., Walker, M. J. C., Cwynar, L. C., Johnsen, S., Knud-sen, K.-L., Lowe, J. J., Wohlfarth, B., and INTIMATE Mem-bers: An event stratigraphy for the Last Termination in the North Atlantic region based on the Greenland ice-core record: a pro-posal by the INTIMATE group, J. Quaternary Sci., 13, 283– 292, doi:10.1002/(SICI)1099-1417(199807/08)13:4¡283::AID-JQS386¿3.0.CO;2-A, 1998.
Cappa, C. D., Hendricks, M. B., DePaolo, D. J., and Cohen, R. C.: Isotopic fractionation of water during evapouration, J. Geophys. Res.-Atmos., 108, 4525, doi:10.1029/2003JD003597, 2003. Craig, H.: Standard for Reporting Concentrations of Deuterium
and Oxygen-18 in Natural Waters, Science, 133, 1833–1834, doi:10.1126/science.133.3467.1833, 1961.
Dansgaard, W.: The abundance of 18O in atmospheric water and water vapour, Tellus, 5, 461–469, 1953.
Dansgaard, W.: Stable isotopes in precipitation, Tellus, 16, 436– 468, 1964.
Dansgaard, W., Johnsen, S. J., Moller, J., and Langway, C. C.: One Thousand Centuries of Climatic Record from Camp Cen-tury on the Greenland Ice Sheet, Science, 166, 377–380, doi:10.1126/science.166.3903.377, 1969.
Fisher, D. A., Reeh, N., and Clausen, H. B.: Stratigraphic noise in the time series derived from ice cores, Ann. Glaciol., 7, 76–83,
1985.
Gkinis, V., Popp, T. J., Blunier, T., Bigler, M., Sch¨ıpbach, S., Ket-tner, E., and Johnsen, S. J.: Water isotopic ratios from a contin-uously melted ice core sample, Atmos. Meas. Tech., 4, 2531– 2542, doi:10.5194/amt-4-2531-2011, 2011.
Grinsted, A. and Dahl-Jensen, D.: A Monte Carlo-tuned model of the flow in the NorthGRIP area, Ann. Glaciol., 35, 527–530, doi:10.3189/172756402781817130, 2002.
Herron, M. M. and Langway, C. C.: Firn Densification: An Empir-ical Model, J. Glaciol., 25, 373–385, 1980.
Jean-Baptiste, P., Jouzel, J., Stievenard, M., and Ciais, P.: Exper-imental determination of the diffusion rate of deuterated water vapour in ice and application to the stable isotopes smoothing ofice cores, Earth Plantet Sc. Lett., 158, 81–90, 1998.
Johnsen, S. J., Dansgaard, W., and White, J.: The Origin of Arctic Precipitation under Present and Glacial Conditions, Tellus B, 41, 452-468, doi:10.1111/j.1600-0889.1989.tb00321.x, 1989. Johnsen, S. J.: Stable isotope homogenization of polar firn and
ice, Proc. Symp. on Isotopes and Impurities in Snow and Ice, I.U.G.G.XVI, General Assembly, Grenoble Aug. Sept. 1975, Washington 1977, 210–219, 1977.
Johnsen, S. J., Dahl-Jensen, D., Dansgaard, W., and Gundestrup, N.: Greenland palaeotemperatures derived from GRIP bore hole temperature and ice core isotope profiles, Tellus B, 47, 624–629, doi:10.1034/j.1600-0889.47.issue5.9.x, 1995.
Johnsen, S. J., Clausen, H. B., Cuffey, K. M., Hoffmann, G., Schwander, J., and Creyts, T.: Diffusion of stable isotopes in po-lar firn and ice: the isotope effect in firn diffusion, Physics of Ice Core Records, 159, 121–140, edited by: Hondoh, T., Hokkaido University Press, Sapporo, 2000.
Johnsen, S. J., Dahl-Jensen, D., Gundestrup, N., Steffensen, J. P., Clausen, H. B., Miller, H., Masson-Delmotte, V., Sveinbj¨ornsd´ottir, A. E., and White, J.: Oxygen isotope and palaeotemperature records from six Greenland ice-core stations: Camp Century, Dye-3, GRIP, GISP2, Renland and NorthGRIP, J. Quaternary Sci., 16, 299–307, doi:10.1002/jqs.622, 2001. Johnsen, S. J., Sveinbj¨ornsd´ottir, A. E., Popp, T., White, J., Vinther,
B. M., and Dahl-Jensen, D.: Palaeotemperatures based on dif-ferential smoothing in isotopic firn diffusion, in: Geophysical Research Abstracts, vol. 8, p. 10498, 2006.
Jouzel, J.: Calibrating the Isotopic Paleonthermometer., Science, 286, 910–911, available at: http://www.jstor.org/stable/pdfplus/ 2899484.pdf, 1999.
Jouzel, J., Alley, R. B., Cuffey, K. M., Dansgaard, W., Grootes, P., Hoffmann, G., Johnsen, S. J., Koster, R. D., Peel, D., Shuman, C. A., Stievenard, M., Stuiver, M., and White, J.: Validity of the temperature reconstruction from water isotopes in ice cores, J. Geophys. Res., 102, 26471–26488, doi:10.1029/97JC01283, 1997.
Landais, A., Barkan, E., and Luz, B.: Record of δ18O and 17O-excess in ice from Vostok Antarctica during the last 150,000 years, Geophys. Res. Lett., 35, 2709, doi:10.1029/2007GL032096, 2008.
Lea, D. W., Pak, D. K., Peterson, L. C., and Hughen, K. A.: Syn-chroneity of Tropical and High-Latitude Atlantic Temperatures over the Last Glacial Termination, Science, 301, 1361–1364, doi:10.1126/science.1088470, 2003.
evapourat-ing water, Geochim. Cosmochim. Ac., 73, 6697–6703, doi:10.1016/j.gca.2009.08.008, 2009.
Masson-Delmotte, V., Jouzel, J., Landais, A., Stievenard, M., Johnsen, S. J., White, J. W. C., Werner, M., Sveinbj¨ornsd´ottir, A., and Fuhrer, K.: GRIP Deuterium Excess Reveals Rapid and Orbital-Scale Changes in Greenland Moisture Origin, Science, 309, 118–121, doi:10.1126/science.1108575, 2005.
Merlivat, L.: Molecular diffusivities ofH216O, HD16O, and H182 O in gases, J. Chem. Phys., 69, 2864–2871, doi:10.1063/1.436884, 1978.
NGRIP Members: High-resolution record of Northern Hemisphere climate extending into the last interglacial period, Nature, 431, 147–151, doi:10.1038/nature02805, 2004.
Paterson, W. S. B.: Physics of Glaciers; Third edition, Butterworth-Heinemann, 3rd Edn. 1994, reprinted with corrections 1998, 2001, 2002, 2002.
Press, W. H., Teukolsky, S. A., Vetterling, W., and Flannery, B. P., eds.: Numerical Recipes – The Art of Scientific Computing, Cambridge University Press, Cambridge, 3rd Edn., 2007. Ramseier, R. O.: Self-Diffusion of Tritium in Natural and
Synthetic Ice Monocrystals, J. Appl. Phys., 38, 2553–2556, doi:10.1063/1.1709948, 1967.
Rasmussen, S. O., Andersen, K. K., Svensson, A. M., Steffensen, J. P., Vinther, B. M., Clausen, H. B., Siggaard-Andersen, M.-L., Johnsen, S. J., Larsen, L. B., Dahl-Jensen, D., Bigler, M., R¨othlisberger, R., Fischer, H., Goto-Azuma, K., Hansson, M. E., and Ruth, U.: A new Greenland ice core chronology for the last glacial termination, J. Geophys. Res., 111, 6102, doi:10.1029/2005JD006079, 2006.
Rempel, A. W. and Wettlaufer, J.: Isotopic diffu-sion in polycrystalline ice, J. Glaciol., 49, 397–406, doi:10.3189/172756503781830638, 2003.
Schwander, J., Stauffer, B., and Sigg, A.: Air mixing in firn and the age of the air at pore close-off, Ann. Glaciol., 10, 141–145, 1988.
Severinghaus, J. P. and Brook, E. J.: Abrupt Climate Change at the End of the Last Glacial Period Inferred from Trapped Air in Polar Ice, Science, 286, 930–934, doi:10.1126/science.286.5441.930, 1999.
Severinghaus, J. P., Sowers, T., Brook, E. J., Alley, R. B., and Ben-der, M. L.: Timing of abrupt climate change at the end of the Younger Dryas interval from thermally fractionated gases in po-lar ice, Nature, 391, 141–146, doi:10.1038/34346, 1998. Simonsen, S. B.: A New Ice Core Paleothermometer for Holocene
and Transition, Diffusion Processes Quantified by Spectral Meth-ods, Master’s thesis, University of Copenhagen, Copenhagen, available at: www.icecores.dk, 2008.
Steffensen, J. P., Andersen, K. K., Bigler, M., Clausen, H. B., Dahl-Jensen, D., Goto-Azuma, H. F. K., Hansson, M., Johnsen, S. J., Jouzel, J., Masson-Delmotte, V., Popp, T., Rasmussen, S. O., R¨othlisberger, R., Ruth, U., Staufferand, B., Siggaard-Andersen, M.-L., Sveinbj¨ornsd´ottir, A. E., Svensson, A., and White, J. W. C.: High-resolution Greenland ice core data show abrupt climate change happens in few years, Science, 321, 680–684, doi:10.1126/science.1157707, 2008.
Svensson, A., Andersen, K. K., Bigler, M., Clausen, H. B., Dahl-Jensen, D., Davies, S. M., Johnsen, S. J., Muscheler, R., Ras-mussen, S. O., R¨othlisberger, R., Peder Steffensen, J., and Vinther, B. M.: The Greenland Ice Core Chronology 2005, 15– 42 ka, Part 2: comparison to other records, Quaternary Sci. Rev., 25, 3258–3267, doi:10.1016/j.quascirev.2006.08.003, 2006. Svensson, A., Andersen, K. K., Bigler, M., Clausen, H. B.,
Dahl-Jensen, D., Davies, S. M., Johnsen, S. J., Muscheler, R., Parrenin, F., Rasmussen, S. O., R¨othlisberger, R., Seierstad, I., Steffensen, J. P., and Vinther, B. M.: A 60 000 year Greenland stratigraphic ice core chronology, Clim. Past, 4, 47–57, doi:10.5194/cp-4-47-2008, 2008.