• No results found

Recurrence intervals for the closure of the Dutch Maeslant surge barrier

N/A
N/A
Protected

Academic year: 2020

Share "Recurrence intervals for the closure of the Dutch Maeslant surge barrier"

Copied!
11
0
0

Loading.... (view fulltext now)

Full text

Figure

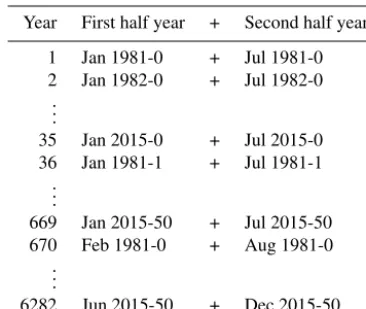
Table 1. Combination of individual forecast members to constructthe 6282-year time series
Figure 2. Annual maxima of the observed water levels in Hoek vanHolland, 1887–2015 (blue)
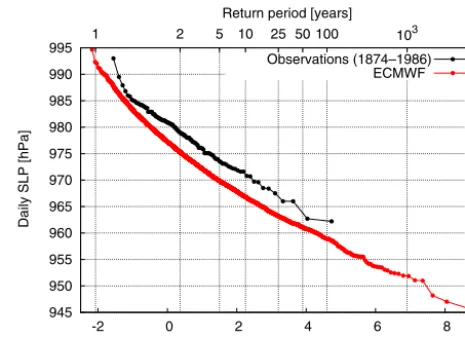
Figure 3. Gumbel plot of observed annual minimum sea levelpressure (SLP) in Nordby (black) and as simulated at the nearestECMWF grid point (red)
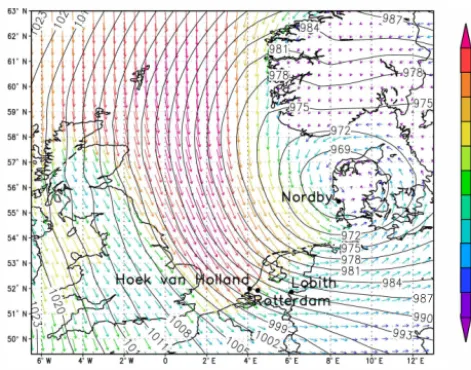
Figure 4. Wind and pressure fields for the situation leading to thehighest surge in Hoek van Holland that occurred in the ECMWF-WAQUA/DCSMv5 ensemble
+4

References

Related documents