www.atmos-meas-tech.net/7/3909/2014/ doi:10.5194/amt-7-3909-2014
© Author(s) 2014. CC Attribution 3.0 License.
Humidity sensor failure: a problem that should not be neglected
Y. Liu1,2and N. Tang3
1Numerical Weather Prediction Center, China Meteorological Administration, no. 46 South Zhongguancun Street, Haidian District, Beijing 100081, China
2National Meteorological Center, China Meteorological Administration, no. 46 South Zhongguancun Street, Haidian District, Beijing 100081, China
3College of Atmospheric Science, Nanjing University of Information Science and Technology, no. 219 Ningliu Road, Nanjing, 210044, China
Correspondence to: Y. Liu ([email protected])
Received: 23 March 2014 – Published in Atmos. Meas. Tech. Discuss.: 4 July 2014 Revised: 1 October 2014 – Accepted: 10 October 2014 – Published: 25 November 2014
Abstract. The problem of abnormally dry bias induced by radiosonde humidity sensor failure in the low and mid-troposphere is studied based on the global operational radiosonde relative humidity observations from Decem-ber 2008 to NovemDecem-ber 2009. The concurrent humidity re-trievals from the FORMOSAT-3/COSMIC radio occultation mission are also used to assess the quality of the radiosonde humidity observations. It is found that extremely dry relative humidity are common in the low and mid-troposphere, with an annual globally averaged occurrence of 4.2 %. These low-humidity observations usually exist between 20 and 40◦
lati-tude in both the Northern Hemisphere and Southern Hemi-sphere, and from heights of 700 to 450 hPa. Winter and spring are the favored seasons for their occurrence, with a maximum fraction of 9.53 % in the Northern Hemisphere and 16.82 % in the Southern Hemisphere. The phenomenon does not result from natural atmospheric variability, but rather hu-midity sensor failure. If the performance of huhu-midity sen-sors is not good, low-humidity observations occur easily, particularly when the radiosonde ascends through stratiform clouds with high moisture content. The humidity sensor can-not adapt to the huge change of the atmospheric environment inside and outside stratiform clouds, resulting in sensor fail-ure and no response to atmospheric change. These extremely dry relative humidity observations are erroneous. However, they have been archived as formal data and applied in many research studies. This may seriously undermine the relia-bility of numerical weather prediction and the analysis of weather and climate if quality control is not applied before using these data.
1 Introduction
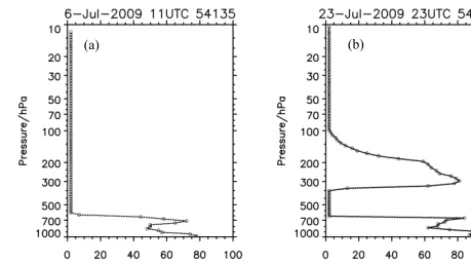
Recently, a new issue has come to light from the Chi-nese L-band radiosonde relative humidity observations (Tang et al., 2014). Relative humidity profiles from this type ra-diosonde often indicate a very thick dry layer in the lower troposphere, with low relative humidity values (<2 %) at a given height (or above the given height) and with no re-sponse to humidity changes, sometimes until the end of the sounding (Fig. 1a). Occasionally, some profiles can recover partly or entirely with height (Fig. 1b). Although low rel-ative humidity observations of less than 10 % are common in the troposphere (Spencer and Braswell, 1997; Zhang et al., 2003; Wang et al., 2010), Zhang and Chen (2010) sug-gested that such dramatic changes of the relative humidity from the Chinese L-band radiosonde system do not comply with the atmospheric stratification law. Tang et al. (2014) an-alyzed dry biases of Chinese L-band radiosonde humidity profiles observed in the lower troposphere, and hypothesized that the dry biases were likely the result of humidity sensor failure. They further showed that the dry bias phenomenon depended on both the performance of the humidity sensor and the cloud types encountered. The humidity sensor often fails if the sounding instrument goes through deep and thick clouds, most of which are stratiform clouds with high water vapor and an obvious dry layer accompanied by atmospheric temperature stratification.
The occurrence of dry bias in the Chinese L-band ra-diosonde system due to humidity sensor failure reached 12.63 % in the survey period (Tang et al., 2014). This is a serious problem that should not be neglected by the numer-ical weather prediction community. Do other countries’ op-erational radiosonde systems exist in the abnormal dry phe-nomenon in the low and mid-troposphere like the Chinese L-band radiosonde system? If so, what are their causes and distribution characteristics? This is the aim of this paper. The remainder of the paper is organized as follows: Sect. 2 de-scribes the data and methods employed in the study; Sect. 3 surveys global operational radiosonde humidity observations for extremely thick dry biases; Sect. 4 presents a compari-son between radiocompari-sonde relative humidity observations, radio occultation humidity retrieval production and analysis data; Sect. 5 describes the possible causes of the relative humidity observation dry biases; Sect. 6 presents the discussion and conclusion.
2 Data and method
The radiosonde data used in this paper span from Decem-ber 2008 to NovemDecem-ber 2009, and are obtained from the Global Telecommunication System. After excluding stations with fewer than five observations, a total of 844 radiosonde stations carrying out 451 283 soundings comprise the sam-ple. The method proposed by Tang et al. (2014) is adopted to survey the new issue of humidity observation. Namely, if the thickness of a relative humidity profile with a value of
15
Figure 1. Two examples of abnormally dry profiles of relative humidity from the Chinese 1
L-band radiosonde system. Source: Tang et al. (2014). 2
3
(a) (b)
Figure 1. Two examples of abnormally dry profiles of relative
hu-midity from the Chinese L-band radiosonde system. Source: Tang et al. (2014).
less than 5 % continuously appears greater than 200 hPa be-low the 300 hPa height, we assume that the dry bias of the humidity profile is affected by the sensor failure. The height under 300 hPa is chosen to emphasize the fact that we are in-vestigating a new issue of humidity observation biases in the low and middle troposphere, instead of the well-known issue of dry bias in the high troposphere.
The radio occultation (RO) data of the Constellation Ob-servation System of Meteorology, Ionosphere and Climate (COSMIC) program (Anthes et al., 2008) and the ERA-Interim reanalysis results (Dee et al., 2011) of the European Centre for Medium-Range Weather Forecasts (ECMWF) model are intercompared for the study period. The match-ing method between RO and radiosonde data also follows the method implemented by Tang et al. (2014). The time window for the match is 3 h before and after the radiosonde obser-vation time, and the space window is in a 250 km×250 km square grid at the center of the radiosonde release point. If the RO falls within the grid, radiosonde matching is confirmed. If multiple RO profiles are matched at the same time, we se-lect the nearest RO profile.
The Magnus saturation vapor pressure equation is used to calculate the saturation vapor pressure of the RO observation (WMO-NO, 2012):
es= (
6.112×exp(24317.62.12×+TT)×F (p)if(T ≥ −45) 6.112×exp(27222.46.62×+TT)×F (p)if(T <−45), (1) whereT is temperature in◦C, andF (p)is the enhancement factor related to atmospheric pressurepin mb, defined as
F (p)=1.0016+3.15×10⁻⁶×p−0.074
p . (2)
Vapor pressure is then converted to relative humidity: RH= e
es
×100 %. (3)
To compare these data, radiosonde data are converted from a geopotential height to a geometric height coordinate using the following equation:
z= a× ¯g×zg
g0(ϕ,0)×a− ¯g×zg
, (4)
where zrepresents the geometric height in meters,zg rep-resents the geopotential height with the unit of geopotential meters,ais the radius of the earth at 6 371 137 m, the gravi-tational constantg¯=9.80665 m s−2, which is the average at a 45◦latitude at sea level, andg
0(ϕ,0)is the acceleration of gravity at latitudeϕat sea level, defined as
g0(ϕ,0)=9.80620
×(1−0.0026442×cos 2ϕ+0.0000058×cos22ϕ). (5) Finally, we use cubic spline interpolation to interpolate the radiosonde data to vertical layers with a resolution of 100 m; i.e., the same resolution as the RO data.
3 Results
3.1 Global distribution of humidity sensor failures Table 1 shows the number and percentage contribution of failed relative humidity observations for all four seasons. A total of 18 609 failed relative humidity observations among 447 021 profiles are recorded between December 2008 and November 2009, and the percentage of failure is approxi-mately 4.17 % worldwide. Table 1 indicates that humidity sensor failure may occur at any time, but it is more probable during winter and spring for both hemispheres, with the high-est percentages during winter (9.53 %) in the mid-latitude gion of the Northern Hemisphere, and in the mid-latitude re-gion of the Southern Hemisphere (16.82 %). In the survey, 211 out of 844 radiosonde stations have no failed observa-tions; these stations are mainly located in the high-latitude regions of the Northern Hemisphere and in tropical regions.
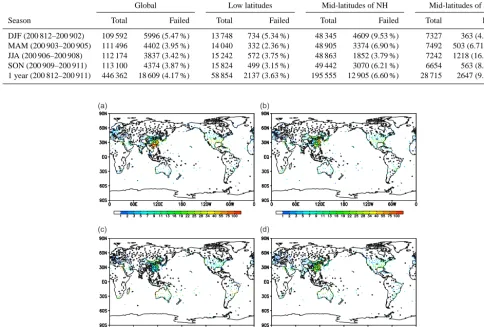
Figure 2 shows the number of failed relative humidity sen-sor observations for each radiosonde station during the pe-riod of the survey. Different color dots correspond to the number presented in the color bar, and the black hollow cir-cles indicate that no humidity sensor failure is observed. The failed observations mainly occur in the latitudes between 20 and 40◦for both hemispheres. The number of failed
observa-tions is high in China, the United States, Australia, western Europe and on the eastern coast of South America. The prob-lem in China is particularly serious with failures of 218 out of the 720 sensors released on radiosondes from the Dalian sta-tion. However, humidity sensor failure is rare in the tropical and high-latitude regions.
Figure 2. The total number of failed relative humidity
observa-tions for each operational radiosonde station from December 2008 to November 2009. The colored dots correspond to values indicated by the color bar, and the black open circles denotes no humidity sensor failure observation.
3.2 Characteristics of seasonal variation and vertical distribution
Figure 3 presents the statistics of relative humidity sensor observation failure for all four seasons. As shown in the im-ages, failed relative humidity observations occur mainly ing spring and winter. Failed observations are less likely dur-ing the summer, but gradually increase durdur-ing autumn. This trend is observed at a latitude close to 30◦in both the North-ern Hemisphere and SouthNorth-ern Hemisphere.
Figure 4 shows the height and total station number that satisfy the failure criterion. The height of most failed ob-servations is between 700 and 450 hPa, peaking at 700 to 650 hPa, followed by 500 to 450 hPa. Failed observations may be seen under 900 hPa; this indicates that humidity sen-sor failure may occur at very low heights.
4 Comparison with COSMIC/GPS RO data
Table 1. Statistics of total and failed relative humidity observations from December 2008 to November 2009 for global observations
(90◦S–90◦N), low latitudes (20◦S–20◦N), mid-latitudes of the Northern Hemisphere (NH) (20◦N–60◦N), and mid-latitudes of the
South-ern Hemisphere (SH) (20◦S–60◦S). DJF: December, January, February; MAM: March, April, May; JJA: June, July, August; SON:
Septem-ber, OctoSeptem-ber, November.
Global Low latitudes Mid-latitudes of NH Mid-latitudes of SH
Season Total Failed Total Failed Total Failed Total Failed
DJF (200 812–200 902) 109 592 5996 (5.47 %) 13 748 734 (5.34 %) 48 345 4609 (9.53 %) 7327 363 (4.95 %) MAM (200 903–200 905) 111 496 4402 (3.95 %) 14 040 332 (2.36 %) 48 905 3374 (6.90 %) 7492 503 (6.71 % %) JJA (200 906–200 908) 112 174 3837 (3.42 %) 15 242 572 (3.75 %) 48 863 1852 (3.79 %) 7242 1218 (16.82 %) SON (200 909–200 911) 113 100 4374 (3.87 %) 15 824 499 (3.15 %) 49 442 3070 (6.21 %) 6654 563 (8.46 %) 1 year (200 812–200 911) 446 362 18 609 (4.17 %) 58 854 2137 (3.63 %) 195 555 12 905 (6.60 %) 28 715 2647 (9.22 %)
(a)
(c)
(b)
(d)
Figure 3. As in Fig. 2, but separated into four seasons: (a) DJF (December, January, February); (b) MAM (March, April, May); (c) JJA
(June, July, August); (d) SON (September, October, November).
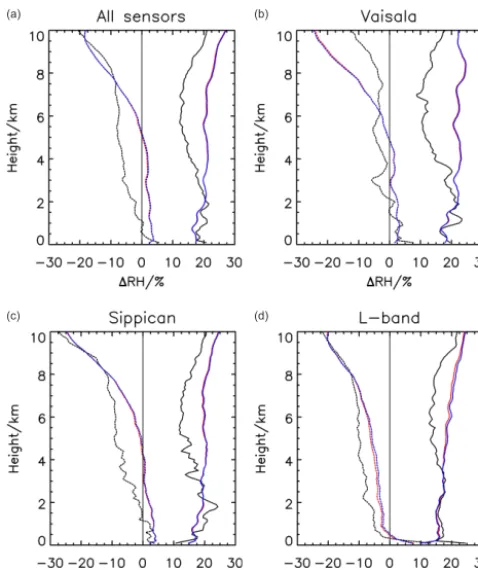
for cross-comparison. Compared with RO data, dry bias from failed observations is larger than that in normal cases and the maximum bias is beyond−10 %. Figures 5b–d show the similarity between the RS92, Sippican and L-band humidity sensors and the COSMIC retrieval humidity data. The dry bias of RS92 is smallest, whereas the dry bias of the Chinese L-band is larger in the entire troposphere; this result is con-sistent with other research findings (Li et al., 2009; Sun et al., 2011; Bian et al., 2011). There is no obvious difference between nighttime and daytime soundings when it comes to the occurrence of the humidity sensor malfunction (figure not shown).
Figure 6 illustrates two radiosonde relative humidity pro-files in comparison with the ECMWF analysis and RO data from the surface to a height of 100 hPa. The radiosonde ob-servations, RO data and analysis generally have good con-sistency. However, upon humidity sensor failure, the relative humidity drops quickly from high moisture to low moisture,
Figure 4. Vertical distribution characteristics of failed relative
(c) (d)
(a) (b)
Figure 5. Bias (dashed line) and standard deviation (solid line) of
the relative humidity data between the radiosonde observations and COSMIC RO retrievals. The red lines represent all observations, the blue lines represent the normal observations and the black lines represent the failed observations. Panel (a) shows the statistics for all sensors, (b) just Vaisala RS92, (c) Sippican and (d) the China L-band sensor.
and the sensor stops working entirely above a certain altitude. Although the RO and analysis profiles also experience a rapid decrease, the reduction is not less than 10 %, and the value does not remain constant. This indicates that temperature, pressure and humidity data based on 1DVAR are not sub-ject to the sensitivity of the sensors. Sometimes, the humid-ity sensor partly or fully recovers as the radiosonde re-enters the clouds (Fig. 6b), including cirrus clouds, because the high moisture inside the clouds is helpful for sensor recovery. Fig-ure 6 also illustrates that the abnormal dry phenomenon in the lower troposphere is unreasonable; it does not reflect the true state of the atmosphere. However, these data have been archived as formal records and are widely used in scientific research and services. If these data are used without correc-tion and quality control, weather prediccorrec-tion and climate anal-ysis will be significantly affected negatively. RO observa-tions and the analysis of numerical weather prediction might provide an effective approach to correct or remedy the failed radiosonde humidity observations.
Table 2. Statistics of the total and failed relative humidity
obser-vations matched with COSMIC data for different sensors from De-cember 2008 to November 2009.
All observations Failed observations
Sensor Total Matched Total Matched
All sensors 447 021 26 405 18 609 (4.17 %) 904
RS92 144 668 8586 5114 (3.53 %) 262
Sippican 59 607 3670 3347 (5.62 %) 191
L-band 61 736 2657 7796 (12.63 %) 321
DFM-90/97. 9272 404 246 (2.65 %) 15
Meteorit MARS 6488 590 8 (0.12 %) 0
VIZ 6804 409 80 (1.18 %) 4
Meisei 7890 229 22 (0.28 %) 0
Modem M2K2 8279 414 512 (6.18 %) 26
(c) (d)
(a) (b)
Figure 6. Comparison of the relative humidity profiles among the
radiosonde (black), COSMIC retrieval (blue) and ECMWF reanal-ysis (red). Panel (a) represents the observations of the Quiliayute station (72 797, USA) at 00:00:00 UTC, 20 September 2009, and
(b) represents the observations of Fuyang station (58 203, China) at
23:16:41 UTC, 6 April 2009.
5 Possible causes of humidity sensor failure 5.1 Performance of the sensor
Figure 7 shows the relative humidity and temperature profiles of six different failure sensors. As seen in the figures, the rel-ative humidity observations decrease quickly in a short time from a high-humidity value to below 5 % in the middle-lower troposphere, and they then maintain low-humidity values. For example, the German Graw G sensor decreases rapidly from 93 to 1 % from a height of 820 to 787 hPa, and then maintains low-humidity values. Some sensors lose their sens-ing ability entirely (Fig. 7a and d), whereas other sensors re-cover. The relative humidity in all cases is over 87 %. When the relative humidity starts decreasing, an inversion tempera-ture layer is observed, thus revealing the existence of clouds in these cases.
(c)
(d)
(a) (b)
(e) (f)
Figure 7. Relative humidity (black lines) and temperature (red lines) profiles for different types of radiosonde sensor: (a) DFM-97 (Gosan,
Korea, 47 185; 33.28◦N, 126.15◦E) at 12:00 UTC (14 January 2009); (b) Meteorit MARZ2-type 2 (Kalac, Russian, 34 247; 50.42◦N,
41.05◦E) at 00:00 UTC (26 October 2009); (c) VIZ-B2 (Curacao, 78 988; 12.12◦N, 68.58◦W) at 12:00 UTC (17 December 2008); (d) Meisei
RS-016 (Minamitorishima, Japan, 47 991; 24.28◦N, 153.98◦E) at 12:00 UTC (7 February 2009); (e) Vaisala RS92 (Galeao, Brazial, 83 746;
22.82◦S, 316.76◦E) at 12:00 UTC (21 May 2009); (f) US Sippican MARK II (Puerto Rico, 78 526; 18.42◦N, 294.03◦E) at 12:00 UTC
(10 March 2009).
sensors are potential failures and most of them are carbon hy-grometers. In the figure, the blue point represents the RS92 sensor, which is widely used in western Europe, Australia and South America. Although the RS92 uses capacitive hy-grometers and is recognized as the best sensor, the number of failed observations is low, with an occurrence rate of ap-proximately 3.5 % per year. Therefore, instrument quality is not the only cause of sensor failure. However, the similar-ity between Figs. 8 and 2 indicates that instrument capabil-ity is always an important factor that should not be ignored. The capability of the Chinese L-band system is insufficient; hence, this sensor tends to exhibit serious problems.
5.2 Relationship with atmospheric conditions, especially clouds
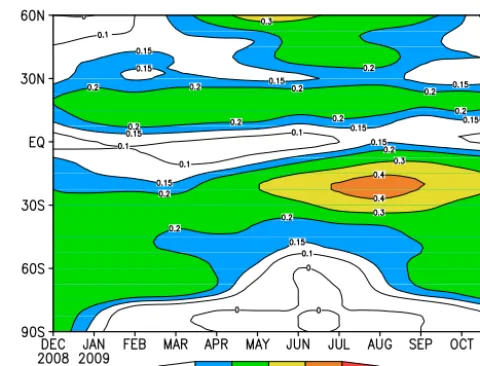
Figure 9 presents the distribution of stratiform clouds and their temporal evolution from the International Satellite Cloud Climatology Plan D2 data sets (Rossow and Schiffer, 1999) in the corresponding period. A low cloud belt exists close to 30◦in the Northern Hemisphere and Southern Hemi-sphere, consistent with Klein and Hartmann’s results (1993). From the above analysis, the failed relative humidity obser-vations mainly occur at almost 30◦ latitudes in both hemi-spheres, and are particularly obvious in winter. This may
imply a connection between the failure of the humidity sen-sors and the distribution of stratiform clouds.
Generally, relative humidity is high inside stratiform clouds and low between two interbedded clouds; it decreases sharply at the top of clouds. The gradient of temperature stratification is close to that of the wet adiabatic process. The upper and top levels of the stratiform clouds usually have an inversion temperature layer that appears below the clouds at a height of 0.1–0.2 km away from the top of the clouds (Shi, 2005). The examples provided in Sect. 5.1 indicate that the relative humidity reported by all radiosondes is over 87 % and that it decreases sharply with the existence of the in-version temperature layer (Fig. 7). This is caused by the ra-diosonde ascending through stratiform clouds.
RS92 Sippican VIZ L-band Meisei M2K2 DFM-90/97 MRZ
JinYang
Unknown types
Figure 8. Geographical distribution of operational radiosonde
sen-sor usage.
is from the dramatically wet–very dry environment, the hu-midity observation value might be reduced even less than the responsive range of sensor due to the inertia effect. The hori-zontal scale of stratiform clouds is tens to thousands of kilo-meters; thus, although the horizontal distribution of the at-mosphere is relatively uniform and stable, the vertical distri-bution may exhibit dramatic changes. On the other hand, the horizontal scale of convective clouds is smaller; the lower humidity area is located inside cloud monomers. The ra-diosonde balloon drifts during ascent, it might repeatedly go through convective cloud monomers from the sides instead of the top. Therefore, the temperature and humidity profiles can neither depict the relatively uniform changes in the hor-izontal direction nor drastic changes in the vertical direction if the radiosonde balloon drifts in convective clouds. There are rich stratiform clouds in the subtropics, so the phenom-ena occur easily. But this is only an estimation, and needs proving in a lab experiment.
6 Discussion and conclusion
According to radiosonde data from December 2008 to November 2009, the problem of abnormally dry bias induced by radiosonde humidity sensor failure in the low and mid-troposphere was studied. We calculated the percentage of failures and compared them with other satellite products and analysis data. This allowed us to analyze the possible causes. The main conclusions are as follows:
1. In the middle and lower troposphere, the very thick dry layer is often observed from operational radiosonde humidity observations. The phenomenon is common. However, it is different from the dry layer in the nat-ural atmospheric variability, which also exists in the troposphere, especially in the subtropics and extratrop-ics, based on previous studies. One of the most obvi-ous features is that the relative humidity in our study changes less with time and maintains a very low value in a thick atmospheric layer, indicating that the sensor fails to respond to the variation of the atmosphere. Glob-ally, the annual average occurrence percentage of such
Figure 9. Average longitudinal distribution of stratiform clouds and
their temporal evolution from December 2008 to November 2009, unit: 1.
dry humidity observations is approximately 4.2 %, and these observations mainly occur between the heights of 700 and 450 hPa at 20 to 40◦latitudes in the Northern Hemisphere and Southern Hemisphere. The percentage is high, especially in winter, reaching 9.53 % in the mid-dle latitudes of the Northern Hemisphere and 16.82 % in the middle latitudes of the Southern Hemisphere. 2. The reasons behind the extremely low relative humidity
observations in the low and middle troposphere relate to the performance of the radiosonde humidity sensor and the cloud types in the atmosphere. When the radiosonde ascends through deep stratiform clouds with high mois-ture content, due to the huge changes in the external at-mospheric conditions, the humidity sensor fails to adapt and stops responding. The dramatic change of relative humidity in a short time further reveals the possible variation of the atmospheric state. However, the inter-nal physical mechanism of the humidity sensor failure requires further investigation.
3. The low relative humidity data that satisfy the criteria proposed by Tang et al. (2014) are erroneous. These data do not represent the real atmosphere. However, they have been archived as formal records, and are widely used in atmospheric science research and services. If the data are used prior to correction and quality control, the reliability of weather prediction and climate analysis will be adversely affected. Therefore, there is an urgent need to correct these erroneous data, or flag the faulty data before ending up in the radio sounding archives in the future.
References
Anthes, R. A., Bernhardt, P. A., Chen, Y., Cucurull, L., Dymond, K. F., Ector, D., Healy, S. B., Ho, S. P., Hunt, D. C., Kuo, Y.-H., Liu, H., Manning, K., McCormick, C., Meehan, T. K., Randel, W. J., Rocken, C., Schreiner, W. S., Sokolovskiy, S. V., Syndergaard, S., Thompson, D. C., Trenberth, K. E., Wee, T. K., Yen, N. L., and Zeng, Z.: The COSMIC/FORMOSAT-3 Mission-Early re-sults, B. Am. Meteorol. Soc., 89, 313–333, 2008.
Bian, J., Chen, H., Vömel, H., Duan, Y., Xuan, Y., and Lv, D.: Inter-comparison of humidity and temperature sensors: GTS1, Vaisala RS80, CFH, Adv. Atmos. Sci., 28, 139–146, 2011.
Dee, D. P., Uppala, S. M., Simmons, A. J., Berrisford, P., Poli, P., Kobayashi, S., Andrae, U., Balmaseda, M. A., Balsamo, G., Bauer, P., Bechtold, P., Beljaars, A. C. M., Berg, L. van de, Bid-lot, J., Bormann, N., Delsol, C., Dragani, R., Fuentes, M., Geer, A. J., Haimberger, L., Healy, S. B., Hersbach, H., Hólm, E. V., Isaksen, L., Kållberg, P., Köhler, M., Matricardi, M., McNally, A. P., Monge-Sanz, B. M., Morcrette, J. J., Park, B. K., Peubey, C., Rosnay, P. de, Tavolato, C., Thépaut, J.-N., and Vitart, F.: The ERA-Interim reanalysis: configuration and performance of the data assimilation system, Q. J. Roy. Meteorol. Soc., 137, 553–597, 2011.
Klein, S. A. and Hartmann, D. L.: The seasonal cycle of low strati-form clouds, J. Climate, 6, 1587–1606, 1993.
Li, F., Li, B., and Wu, L.: An introduction of WMO 8th radiosondes inter-comparison and integrated remote instruments experiment, Adv. Earth Sci., 27, 916–924, 2012 (in Chinese).
Li, W., Xing, Y., and Ma, S. Q.: The analysis and comparison be-tween GTS1 radiosonde made in China and RS92 Radiosonde of Vaisala company, Meteorological monthly, 35, 97–102, 2009 (in Chinese).
Miloshevich, L. H., Vömel, H., Whiteman, D., Lesht, B., Schmidlin, F. J., and Russo, F: Absolute accuracy of water vapor mea-surements from six operational radiosonde types launched dur-ing AWEX-G and implications for AIRS validation, J. Geophys. Res., 111, D09S10, doi:10.1029/2005JD006083, 2006. Nash, J., Oakley, T., Vömel, H., and Li, W.: WMO
intercompari-son of high quality radiointercompari-sonde systems, World Meteorol. Org., Yangjiang, China, Tech. Rep., 2010.
Rossow, W. B. and Schiffer, R. A.: Advances in Understanding Clouds from ISCCP, B. Am. Meteorol. Soc., 80, 2261–2288, 1999.
Shi, A.: Progress in researches on microphysical characteristics and precipitation mechanisms of stratiform cloud precipitation, Me-teorological Science and Technology, 2, 104–108, 2005 (in Chi-nese).
Spencer, R. W. and Braswell, W. D.: How dry is the tropi-cal free troposphere? Implications for global warming the-ory, B. Am. Meteorol. Soc., 78, 1097–1106, doi:10.1175/1520-0477(1997)078<1097:HDITTF>2.0.CO;2, 1997.
Sun, B., Reale, A., Seidel, D. J., and Hunt, D. C.: Comparing radiosonde and COSMIC atmospheric profile data to quantify differences among radiosonde types and the effects of imper-fect collocation on comparison statistics, J. Geophys. Res., 115, D23104, doi:10.1029/2010JD014457, 2011.
Tang, N., Liu, Y., Li, G., and Li, F.: Preliminary analysis on ab-normally dry phenomena of relative humidity observations of the Chinese L-band radiosonde system, J. Trop. Meteorol., 30, 643–653, 2014 (in Chinese).
Vömel, H., Selkirk, H., Miloshevich, L., Valverde-Canossa, J., Valdés, J., Kyrö, E., Kivi, R., Stolz, W., Peng, G., and Diaz, J. A.: Radiation dry bias of the Vaisala RS92 humidity sensor, J. Atmos. Ocean. Tech., 24, 953–963, 2007.
Wang, J. H., Cole, H. L., Carlson, D. J., Miller, E. R., Beierle, K., Paukkunen, A., and Laine, T. K.: Corrections of humidity mea-surement errors from the Vaisala RS80 radiosonde – application to TOGA COARE data, J. Atmos. Ocean. Tech., 19, 981–1002, 2002.
Wang, J. H., David, J. C., David, B. P., Terrence, F. H., Dean, L., Harold, L. C., Kathryn, B., and Edward, C.: Performance of oper-ational radiosonde humidity sensors in direct comparison with a chilled mirror dew-point hygrometer and its climate implication, Geophys. Res. Lett., 30, 1860, doi:10.1029/2003GL016985, 2003.
Wang, J. H., Zhang, L. Y., Lin, P. N., Mark, B., Harold, C., Jack, F., Terry, H., Dean, L., Scot, L., Charlie, M., Joseph, V., Weng, C.-H., and Kathryn, Y.: Water vapor variability and comparisons in the subtropical Pacific from The Observing System Research and Predictability Experiment-Pacific Asian Regional Campaign (T-PARC) Driftsonde, Constellation Observing System for Mete-orology, Ionosphere, and Climate (COSMIC), and reanalyses, J. Geophys. Res., 115, D21108, doi:10.1029/2010jd014494, 2010. WMO-NO: Guide to Meteorological Instruments and Methods of Observation, 2008 Edn. (7TH), updated in 2010, Geneva, 2012. Wolfgang, S., Claude, H., Schönenborn, F., Leiterer, U., Dier, H.,
and Lanzinger, E.: Pressure and temperature differences between Vaisala RS80 and RS92 radiosonde systems, J. Atmos. Ocean. Tech., 25, 909–927, 2008.
Zhang, C. and Chen, J.: Contrast analysis of data observed by 59-type and L-band sonde, Journal of Shanxi Meteorology, 1, 29–31, 2010 (in Chinese).