doi:10.5194/amt-7-3801-2014
© Author(s) 2014. CC Attribution 3.0 License.
Potential radio frequency interference with the GPS L5 band for
radio occultation measurements
A. M. Wolff1, D. M. Akos2, and S. Lo3
1Department of Aeronautics and Astronautics, Stanford University, Stanford, California, USA 2Department of Aerospace Engineering, University of Colorado, Boulder, Colorado, USA 3Department of Aeronautics and Astronautics, Stanford University, Stanford, California, USA
Correspondence to: A. M. Wolff (wolffam@stanford.edu)
Received: 19 February 2014 – Published in Atmos. Meas. Tech. Discuss.: 7 May 2014 Revised: 1 October 2014 – Accepted: 6 October 2014 – Published: 18 November 2014
Abstract. Future radio occultation (RO) receivers are planned to utilize the newly implemented Global Position-ing System (GPS) L5 band centered at 1176.45 MHz. Since there are currently no operational GPS L5 receivers used for space-based RO applications, the interference environment is unclear. Distance measuring equipment (DME) and tactical air navigation (TACAN) stations share the same frequency band as GPS L5. The signals from these stations have been identified as possible sources of interference for any GPS L5 receiver, including those used in RO applications. This study utilizes Systems Tools Kit (STK) simulations to gain insight into the power received by a RO satellite in low Earth or-bit (LEO) from a DME–TACAN transmission as well as the amount of interfering stations. In order to confirm the valid-ity of utilizing STK for communication purposes, a theoret-ical scenario was recreated as a simulation and the results were confirmed. Once the method was validated, STK was used to output a received power level aboard a RO satellite from a DME–TACAN station as well as a tool to detail the number of interfering DME–TACAN stations witnessed by a space-based RO receiver over time. The results indicated a large number of DME–TACAN stations transmitting at sim-ilar orientations as a receiving RO satellite, thereby leading to the possibility of signal degradation in an unclear interfer-ence environment.
1 Introduction
The Global Positioning System (GPS) L5 band centered at 1176.45 MHz is now being transmitted with the latest IIF satellite design (Van Dierendonck et al., 2000). This signal is part of the GPS modernization effort and offers civil users additional power, a higher chipping rate, and an updated sig-nal modulation structure. As such, it is a promising sigsig-nal transmission for scientific applications of GPS.
However, certain aeronautical navigation systems already occupy this frequency range. Distance measuring equipment (DME) and tactical air navigation (TACAN) systems offer potential sources of interference due to coexistence within the L5 band (Kim and Grabowski, 2003). These systems are comprised of an airborne interrogator and a ground-based transponder. A TACAN system is essentially a higher pow-ered DME station used for military purposes. Due to the limited placements available within the Aeronautical Radio Navigation Services (ARNA) radio band for aviation use, the GPS L5 signal was placed within the already existing DME–TACAN band. The premise was that an aircraft using the system would only encounter a limited number of pulsed interfering signals, thereby allowing the interoperability be-tween a GPS L5 receiver and a DME–TACAN signal. How-ever, due to the higher number of interfering stations seen by a GPS radio occultation (RO) satellite in low Earth Orbit (LEO), the possibility for signal degradation for RO applica-tions exists (Kim and Grabowski, 2003).
L5 signal for terrestrial users on Earth from the GPS satellites has little if any impact for DME–TACAN operators. Further-more, the pulsed localized nature of the DME–TACAN sig-nals has minimal impact on terrestrial GPS L5 users as there are limited DME–TACAN sources in close proximity to any terrestrial user and code division multiple access (CDMA) modulation of GPS is robust against pulsed interference.
While most users of GPS L5 will experience minimal degradation from DME–TACAN interference, GPS RO is one such application in which even a slight degraded C/No would have a significant impact on results. This system is im-plemented today for use in weather forecasting and has been proven to be a very powerful and reliable tool. The architec-ture of a GPS RO system consists of a satellite in LEO receiv-ing a signal from a GPS satellite. The LEO satellite houses a set of antennas pointed towards the limb of the Earth in or-der to detect and measure refraction as the signal propagates through the Earth’s atmosphere. As a result of this directive orientation of the receiving antenna, these satellites may in-cur DME–TACAN interference that could obstruct RO data collection. The architecture of GPS RO will be discussed in further detail in the following section.
2 Background 2.1 Radio occultation
The utilization of GPS RO in weather forecasting has spurred a further advancement in forecasting accuracy. Utilizing the GPS satellite network, RO techniques leverage the stabil-ity and global coverage of the GPS network in order to provide higher-accuracy temperature, pressure, and humid-ity data (Healy et al., 2005). The process involves a sound-ing technique where a satellite emits a radio wave whose path is then perturbed by an intervening planetary atmo-sphere before reaching the receiver (Kursinski et al., 1997). Earth-based RO specifically involves a GPS satellite trans-mitting a signal to a receiving satellite orbiting in LEO. After the transmitted radio wave is refracted, phase and amplitude variation at the receiver is observed over time in order to de-fine the refractive properties of the surrounding atmosphere (Melbourne, 2004). The refraction of the signal causes an ex-cess phase in the dual-frequency carrier phase results as seen by the GPS receiver in LEO (Ware et al., 1996). By observ-ing the degree of refraction, one can gain insight into the ver-tical distribution of atmospheric pressure, temperature, and humidity. The atmospheric depth of RO retrievals is currently limited by the available signal-to-noise Ratio (SNR). Addi-tional SNR and increased signal-to-interference-plus-noise ratio (SINR) would allow for lower atmospheric data to be obtained.
Previous Earth-based occultation missions, such as GPS–Met and CHAMP (CHAllenging Minisatellite Pay-load), improved upon numerical weather prediction (NWP)
models when compared against the industry standard (Healy et al., 2005). All previous missions have utilized the L1 and L2 GPS frequencies and have exceeded expectations with respect to weather forecasting (Melbourne, 2004). However, the planned implementation of the L5 frequency in a dual-frequency configuration offers an opportunity to improve upon these results. The Formosat-7 / COSMIC-2 (Constellation-Observing System for Meteorology, Iono-sphere, and Climate) mission is a future joint mission be-tween Taiwan and the United States that aims to utilize L5 receivers for reasons of increased power, overall im-provement of signal structure, and the civil designation of the transmission (Mannucci et al., 2012). The TriG (Tri-GPS–GNSS–RO) receiver is one such receiver developed to utilize these characteristics of the L5 band (Esterhuizen et al., 2009).
2.2 Distance measuring equipment
The architecture of the DME system offers a method to determine distance from an aircraft to a ground station (Fisher, 2004). The DME architecture is comprised of an air-borne interrogator and a ground-based transponder that op-erates in four codes (X,Y, W,Z). However, the X code is the only possible interferer with respect to the L5 fre-quency. The aircraft interrogates within a frequency range of 1025–1150 MHz, whereas the ground station transmits over frequencies between 1151 and 1213 MHz within X mode (Bastide et al., 2004). Therefore, any airborne interroga-tion within this architecture does not directly impinge upon any signal transmitted over the L5 frequency. A number of DME–TACAN ground stations, however, transmit within this frequency range and could become a source of interference for L5 transmissions. For this reason, DME–TACAN ground stations will be the focus for determining interoperability within the L5 frequency for GPS RO applications.
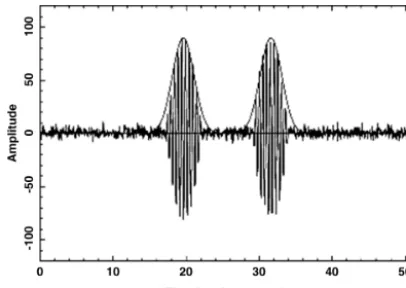
A DME ground station transmits in pulse pairs with a pulse period of 12 µs and a half-amplitude pulse width of 3.5 µs (Ostermeier, 2010). This signal structure can be seen in Fig. 1. In addition, DME stations either operate at a high power of 1000 W or at a low power of 100 W. During peak activity, a DME station transmits up to 2700 pulse pairs per second. The effective width of each pulse is defined to be 8 µs taking into account a 1 µs desaturation time for the receiver. Using this effective pulse width and the pulse pair rate pre-viously defined, a single DME pulse duty cycle is calculated to be 0.0432 s−1(Roturier, 2001). Therefore, a single DME transmitter at its peak is seen 4.32 % of the time by an L5 receiver.
Figure 1. DME pulse pair measured at the Green Bank Telescope in West Virginia (Fisher, 2004).
A standard ground-based DME antenna gain pattern is maximum at 4◦ in elevation above the horizon and is om-nidirectional in the azimuth. This orientation slightly above the horizon directly aligns with the directional gain pattern of a GPS RO satellite. The peak gain is +9.5 dBi and the 3 dB beamwidth is 6◦ in elevation with vertical linear po-larization (dB Systems Inc., 2013). As the orbiting satellite scans the limb of the Earth, gathering atmospheric data, it is in the main lobe of the directional beam of the DME station for a short period of time.
The United States and western Europe have high concen-trations of DME stations, possibly inhibiting a GPS L5 RO receiver in LEO from properly functioning as the difference here is that the satellite will be illuminated by multiple DME stations. In the United States alone there are approximately 203 DME or TACAN ground stations that transmit within
±10 MHz of the L5 center frequency of 1176.45 MHz. In as-sessing the impact to GPS RO, this is likely a conservative approach due to the fact that some RO receivers have wider bandwidths than±10 MHz (Esterhuizen et al., 2009). A re-ceiver with a wider bandwidth will encounter a higher num-ber of interfering DME stations. This is troubling for GPS RO scenarios because it offers up the possibility of receiver saturation, a situation in which no valid atmospheric data can be retrieved (ITU, 1998). Furthermore, the directive orienta-tion of the receiver antenna pattern aboard a RO satellite with respect to a DME station increases the received power level from a DME station, increasing the cause for concern.
3 Pikes Peak L5 data collection
In order to assess the degree to which a directive antenna am-plifies DME interference, it is useful to extract and analyze a real-world interference environment in which two separate antennas were compared. On 21 October 2011, data were collected on top of Pikes Peak mountain in Colorado at an elevation of approximately 4320 m by a team from the
Uni-Figure 2. Fourier transform of the time domain into the frequency domain as seen by a helical antenna atop Pikes Peak after post-processing. This measurement was taken on 21 October 2012 at 17:30 UTC.
versity of Colorado Boulder with the intention of conducting a ground-based RO measurement (Griggs, 2012). This test scenario was constructed in order to gain an understanding of the potential of the new GPS L5 signal for space-based RO. Collections of data from L1, L2, and L5 frequencies were gathered with two separate antennas. The first was a hemi-spherical survey grade antenna oriented vertically with ap-proximately −3 dBi gain toward the azimuth. The second was a helical antenna oriented horizontally and pointed 38◦ in the azimuth measured clockwise from north. The latter has a peak gain of+10 dBi and a 3 dB beamwidth of 45◦. The antenna used was the Q-par QHACP 1.2–1.6 GHz (Steatite Ltd., 2014). Since the data sheet is no longer available, a comparable helical antenna is the HE-0238-6. (R. A. Mayes Company Inc., 2014). Although this test cannot directly rep-resent the results that a space-based receiver would yield, the data collected from this study have provided an insight into the amplification of DME signals when a high-gain antenna is employed. Further analysis seeking out the relative power values is currently ongoing.
Figure 3. DME and TACAN stations encountered within Pikes Peak measurement as noted in Fig. 2. The helical antenna atop Pikes Peak was pointed 38◦in the azimuth relative to north.
this stark contrast of interference between the data gathered by both antennas.
The interference experienced by the helical antenna reg-istered considerably higher, greater than the thermal noise floor. The helical antenna is focused on the area of interest and therefore gathers visible DME interference. Similarly, a GPS L5 receiver used for RO applications utilizes a high-gain directive antenna whose high-gain is focused on the limb of the Earth (Wu et al., 2005). Further analysis was conducted in order to detail the interference that a GPS RO satellite may encounter due to DME pulses.
4 Systems Tool Kit validation
Systems Tool Kit (STK) was utilized to attain a link bud-get for the received power of a DME station by a satellite in LEO. In order to establish the credibility of a space-based STK simulation, a scenario of a theoretical calculation was reconstructed within STK, and the results were compared to the theoretical solution. Roturier (2001) calculates the mini-mum pulse peak power at an aircraft’s GPS receiving antenna under certain conditions. He defines the scenario as a receiv-ing aircraft flyreceiv-ing at an altitude of 12 192 m and a transmit-ting DME station located on the radio horizon from the air-craft’s perspective. Both antennas were modeled as isotropic, and the DME radiated peak power, Pe, was set at 40 dBW.
Inputting these specifications in Eq. (1) below yields an ap-proximate minimum peak power received,P1, of−107 dBW, whereGis the gain of the airborne GPS antenna set at 0 dB,
λrepresents the signal’s wavelength equal to 25.5 cm, andd
is the distance between transmitter and receiver equivalent to 246 NM.
Figure 4. Time domain as seen by helical antenna atop Pikes Peak after signal processing. Measurement taken on 21 October 2012 at 17:30 UTC.
Figure 5. Time domain as seen by a standard survey grade antenna (hemispherical) atop Pikes Peak after signal processing. Measure-ment taken on 21 October 2012 at 17:30 UTC.
P1=PeG
λ
4π d
2
(1)
Although Roturier (2001) simplifies this scenario by using isotropic antennas for both the DME stations and the GPS re-ceiver, these identical parameters were recreated within STK and the results were compiled. The STK simulation outputted a value of−106.91 dBW for the minimum pulse peak power received. The accuracy of this result when compared to the theoretical value supplies a level of integrity for using STK to compute a communication link budget.
5 STK simulation and link budget results
Figure 6. Systems Tool Kit model of dB Systems 5100A DME an-tenna pattern (Systems Tool Kit, 2014). Figure 10 provides a plot of the gain pattern with respect to elevation.
STK. A satellite database within STK was used to insert the Formosat-3 FM4 satellite into the simulation. This satellite is one of six in a constellation currently commissioned un-der the COSMIC-1 mission. The selection of this satellite therefore lends an accurate portrayal of a satellite that would house an L5 receiver for future RO missions. The gain pat-tern for the satellite’s antenna was modeled in STK and the fore and aft elevation angles were set at 27.38◦and 27.16◦, scanning the limb of the Earth (Griggs, 2012). A single DME station was placed in Boulder, Colorado, for testing purposes, and a custom antenna pattern was modeled after the dB Sys-tems Inc. 5100A high-performance DME antenna available on their website (dB Systems Inc., 2013). It should be noted that this model was chosen only as a representative pattern. Figure 6 is an image of the modeled gain pattern within STK. The transmission power of the DME station was set at 1000 W. This value was chosen based upon the fact that DME stations most commonly transmit at this high-power setting. It should be recalled that this model does not account for the low DME power setting of 100 W and the dynamic power ranges of a TACAN that can reach 3500 W. With the standard DME model in place, the simulation was progressed over a period of 6 months within STK, and a plot of the re-sults is illustrated in Fig. 7.
The plot demonstrates a color-coded map of the received power with respect to the COSMIC satellite’s position over the United States. This simulation indicates that, under ideal conditions, a DME transmission is received by the satellite at a maximum power level of−123 dBW. This power level reaches a maximum when the satellite is within the main beam of the DME antenna. The received power then lessens until it abruptly ends as the satellite loses line of sight with the DME station.
In order to evaluate whether receiver saturation will be a potential problem for GPS RO satellites, an estimation of the time a single DME station interferes with a GPS L5 re-ceiver and the total number of DME stations interfering at a given point in time are required. Due to the pulsed
na-Figure 7. Formosat-3 FM4 satellite received power from a single DME station located at 39.8125◦latitude and−104.661◦longitude. Results gathered from STK simulation.
Figure 8. Number of interfering DME stations with received power levels above−125 dBW with respect to time as seen by the Formosat-3 FM4 satellite on 8 January 2013 from 16:02:21 to 16:22:50 UTC. The figure details the satellites orbit across the United States from New Mexico to North Dakota and reaches a maximum when the satellite is orbiting over Manitoba, Canada. Re-sults gathered from STK simulation.
ture of a DME signal, a GPS L5 receiver technically will not experience the DME transmission at all times. Recall-ing the calculated duty cycle of 4.3 % for a sRecall-ingle DME sta-tion offers an estimate for the maximum time a DME stasta-tion may transmit every second. In order to estimate how many DME stations would be interfering with a receiver in LEO at any given time, STK was utilized to provide the number of stations whose received power was greater than−125 dBW, which was provided as an arbitrary constraint.
Figure 9. Percentage of time interfered as a function of the number of stations. This percentage is calculated through the use of Eq. (2).
relevant DME stations. The resulting plot is shown in Fig. 8. This figure indicates a maximum number of 82 stations trans-mitting with received powers of above−125 dBW. This ex-treme case occurred when the satellite was over Manitoba, Canada. Due to the orientation of the DME gain pattern, it is consistent with the results that the highest concentration of signal is found on the edge of the network, not directly over-head. Due to the large amount of DME stations encountered by a space-based receiver, an overlap of the pulsed DME transmissions will occur. A separate calculation was imple-mented to provide insight into this overlap of the pulsed sig-nals. The curves depicted in Fig. 9 illustrate the percentage of the time a receiver is being interfered with by DME and TACAN stations. The following equation defines this sce-nario as the number of interfering stations approaches 90, whereI is the percent of time interfered,Dis the duty cycle of a DME signal equivalent to 4.32 %, andN is the number of DME stations.
I =1−(1−D)N (2)
6 Conclusions
A real-world validation of any simulation within STK is cur-rently impossible due to the lack of space-based L5 GPS receivers with a representative RO pattern. With the future implementation of L5 receivers in space, the opportunity for experimental testing will be realized. However, without full knowledge of the parameters and conditions that a spe-cific DME–TACAN station was operating under at the exact time of the data collection, any experiment will inherently be flawed. Uncertainties in specific antenna patterns, antenna ef-ficiencies, receiver noise figure and other unknown variables
Figure 10. Plot of the gain pattern of 5100A DME antenna with respect to elevation angle (dB Systems Inc., 2013).
obscure any reasonable result. Although a space-based test cannot currently be conducted, other tests were undertaken in order to add to the credibility of the space-based STK sim-ulation.
The single transmitting DME station and orbiting RO satellite simulation yielded a maximum received power level of −123 dBW. A separate STK simulation including all of the relevant DME stations in the United States indicated that a GPS RO receiver in LEO may witness more than 80 stations at a time with received power levels above−125 dBW. This number of relatively high-powered transmissions may cause substantial interference and possible saturation for a space-based GPS L5 receiver.
The resultant maximum received power should be noted as a conservative estimate due to restricting the study of the RO receiver bandwidth to within±10 MHz of the center fre-quency of 1176.45 MHz. Many RO receivers utilize a wide bandwidth with limited filtering in order to optimize data col-lection. However, this study implies that this approach may prove to have an adverse effect on the receivers’ ability to gather data due to a greater number of interfering DME sta-tions within the collected frequencies.
The resultant values may still not portray an entirely accu-rate estimate due to possible inaccuracies embedded in cus-tom antenna patterns as well as the specific orientations for the antennas. A detailed analysis specifying correct trans-mission powers for each station could yield different results; however, using a 1000 W transmission power appears to be a suitable approach.
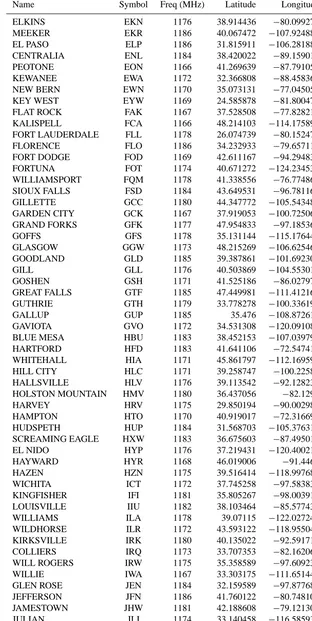
Table 1. Name, location, and corresponding transmission frequency of DME–TACAN stations within±10 MHz of 1176.45 MHz in the United States.
Name Symbol Freq (MHz) Latitude Longitude
Table 1. Continued.
Name Symbol Freq (MHz) Latitude Longitude
Table 1. Continued.
Name Symbol Freq (MHz) Latitude Longitude
Table 1. Continued.
Name Symbol Freq (MHz) Latitude Longitude
PAWLING PWL 1177 41.769772 −73.600553 POCKET CITY PXV 1167 37.928319 −87.762381 POINT REYES PYE 1171 38.079756 −122.867828 RAVINE RAV 1180 40.553378 −76.599378 ROBBINSVILLE RBV 1172 40.202389 −74.495014 RICHMOND RIC 1175 37.50235 −77.320278 KREMMLING RLG 1172 40.002642 −106.442489 WORLAND RLY 1182 43.964139 −107.950833 REDWOOD FALLS RWF 1167 44.467275 −95.128231 SAN MARCUS RZS 1183 34.509528 −119.770992 SACRAMENTO SAC 1186 38.443658 −121.551622 SOD HOUSE SDO 1177 41.407056 −118.034722 SEA ISLE SIE 1182 39.095503 −74.800333 SAN JOSE SJC 1175 37.374711 −121.944667 SAN ANGELO SJT 1185 31.374953 −100.454875 SLATE RUN SLT 1173 41.512758 −77.970111 SIDON SQS 1181 33.463861 −90.277333 STONEWALL STV 1172 30.206758 −98.705756 SALEM SVM 1177 42.408869 −83.594189 SQUAW VALLEY SWR 1166 39.180322 −120.269614 SAYRE SYO 1186 35.345161 −99.635347 TUBA CITY TBC 1169 36.121325 −111.269586 TUCUMCARI TCC 1170 35.182139 −103.598519 STANFIELD TFD 1182 32.885856 −111.908733 ST THOMAS THS 1184 39.933228 −77.950944 TWENTYNINE PALMS TNP 1176 34.112236 −115.769908 TYRONE TON 1183 40.735117 −78.331294 TULSA TUL 1178 36.196261 −95.788108 TRAVERSE CITY TVC 1180 44.667919 −85.549958 QUITMAN UIM 1174 32.880403 −95.366753 QUINCY UIN 1170 39.847875 −91.278925 TEXOMA URH 1177 33.944186 −96.391836 CEDAR LAKE VCN 1186 39.537672 −74.967144 VANDALIA VLA 1177 39.093683 −89.162464 MOUNT VERNON VNN 1172 38.361953 −88.807336 VULCAN VUZ 1178 33.670186 −86.8998 FREEPORT ZFP 1166 26.555256 −78.69785 ZUNI ZUN 1168 34.965753 −109.154508
Edited by: M. Nicolls
References
Bastide, F., Chatre, E., Macabiau, C., and Roturier, B.: GPS L5 and Galileo E5a/E5b signal-to-noise density ratio degradations due to DME/TACAN signals: simulations and theoretical derivation, J. Inst. Navig., 26, 1049–1062, 2004.
dB Systems Inc.: available at: http://www.dbsant.com/5100A.php (last access: 20 June 2013), 2013.
Esterhuizen, S., Franklin, G., Hurst, K., Mannucci, A., Meehan, T., Webb, F., Young, L.: TriG – A GNSS Precise Orbit and Radio
Occultation Space Receiver, Proceedings of the 22nd Interna-tional Technical Meeting of The Satellite Division of the Insti-tute of Navigation, Savannah, GA, September 2009, 1442–1446, 2009.
Fisher, J. R.: Signal analysis and blanking experiments on DME in-terference, National Radio Astronomy Observatory, Electronics Division, Report 313, 2004.
Griggs, E.: Ground-based GPS occultation utilizing modernized signals, in: Proceedings of IROWG-2, Estes Park, Colorado, 28 March 2012, 2012.
Healy, S. B., Jupp, A. M., and Marquardt, C.: Forecast impact ex-periment with GPS radio occultation measurements, Geophys. Res. Lett., 32, L03804, doi:10.1029/2004GL020806, 2005. International Telecommunication Union (ITU): Feasibility of
explo-ration satellite (active) and space research (active) services in the 1 215-1 260 MHz BAND, Recommendation RS.1347-0, 1998. Kim, T. and Grabowski, J.: Validation of GPS L5 coexistence
with DME/TACAN and link-16 systems, J. Inst. Navig., 9, 1455–11469, 2003.
Kursinski, E. R., Hajj, G. A., Schofield, J. T., Linfield, R. P., and Hardy, K. R.: Observing Earth’s atmosphere with radio occulta-tion measurements using the global posiocculta-tioning system, J. Geo-phys. Res., 102, 23429–23465, 1997.
Mannucci, A. J., Lowe, S. T., Franklin, G., Meehan, T. K., and Xie, F.: New science opportunities on COSMIC-2/FORMOSAT-7, Sixth FORMOSAT-3/COSMIC Data Users’ Workshop, 30 Oc-tober 2012, Boulder, Colorado, 2012.
Melbourne, W. G.: Radio occultations using earth satellites: A wave theory treatment, Deep Space Communications and Navigation Series, Jet Propulsion Lab, California Institute of Technology, Monograph 6, 2004.
Ostermeier, J.: Test of DME/TACAN transponders application note – 1GP74, Rohde and Schwarz Co., Munich, Germany, 5–9, 2010.
R. A. Mayes Company Inc.: available at: http://www.ramayes.com/ helical_antennas.htm (last access: 9 September 2014), 2014.
Roturier, B.: Report on DME interference on GPS/L5, Direc-tion Generale de l’AviaDirec-tion Civile, Report (Third Version), 9 March 2001.
Steatite Ltd.: available at: http://www.steatiteqpar-antennas.co.uk/ (last access: 9 September 2014), 2014.
Systems Tool Kit: available at: https://www.agi.com/products/ (last access: 2 April 2014), 2014.
Van Dierendonck, A. J., Hegarty, C., Scales, W., and Ericson, S.: Signal specification for the future GPS civil signal at L5, J. Inst. Navig., 232–241, 2000.
Ware, R., Rocken, C., Solheim, F., Exner, M., Schreiner, W., An-thes, R., Feng, D., Herman, B., Gorbunov, M., Sokolovskiy, S., Hardy, K., Kuo, Y., Zou, X., Trenberth, K., Mee-han, T., Melbourne, W., and Businger, S.: Gps sounding of the atmosphere from low earth orbit: preliminary re-sults, B. Am. Meteorol. Soc., 77, 19–40, doi:10.1175/1520-0477(1996)077<0019:GSOTAF>2.0.CO;2, 1996.