Using Signed-Rank Statistic
V. Y. Pawar
Department of Statistics, PDVP College, Tasgaon, (MS) India [email protected]
D.T. Shirke
Department of Statistics, Shivaji University, Kolhapur, (MS) India 416004 [email protected]
S.K. Khilare
Department of Statistics, R. B. N. B. College, Shrirampur, (MS) India 413709 [email protected]
Abstract
The article studied the steady-state behaviour of the synthetic control chart using signed-rank statistic for shifts in the process median. The steady-state ATS (Average Time to Signal) values are computed using Markov chain approach. To compute steady-state ATS, the performance of the synthetic control chart and two-of-L+1 control chart can be made identical over all samples with head start features. When subgroup sample size n=10, the steady-state performance of the synthetic control chart is worth for small to moderate shifts under all considered symmetric distributions. When subgroup sample size n=5, steady-state ATS values are larger under normal and double exponential distributions only for small shifts. However, under the Cauchy distribution zero-state ATS values are larger but not significantly larger as compared to steady-state ATS values. Usefulness of proposed control chart explored using numerical example. Proposed control chart is simple and easy to use for practitioners.
Keyword: Nonparametric, signed-rank, synthetic, runs rule, steady-state and average time to signal.
1. Introduction
A control chart is one of the most useful tools for monitoring quality of the characteristic of an interest in a manufacturing process. Most of the control charts are based on the assumption that the process characteristic follows a normal distribution. Many researchers have pointed out that all the processes are not normally distributed; see for example (Chou et al. 2001) and the references cited therein. The standard control charts do not perform well, if the assumption of normality is not satisfied. The effects of non-normality on the X charthave been studied in the literature and includes among others (Schilling and Nelson 1976, Bradley 1973). This demands the construction of nonparametric control charts. A chart is said to be nonparametric if the run length distribution of the chart does not depend on the underlying process distribution, when there is no shift in the process parameter under study. Hence, the in-control Average Time to Signal (ATS) of nonparametric control chart does not depend on the underlying process distribution.
Ledolter 1991) suggested a control chart based on ranks. (Amin et al. 1995) proposed nonparametric quality control charts for location and scale parameters based on the sign statistic. (Bakir 2004) reported a control chart based on signed-rank statistic, which was further improved in terms of Average Run Length (ARL) by (Chakraborti and Eryilmaz 2007). (Bakir 2006) proposed distribution free quality control charts based on signed-rank-like statistics. (Chakraborti and Van de Wiel 2008) proposed Mann-Whiteny statistic based control chart. (Human et al. 2010) studied nonparametric Shewhart-type sign control charts based on runs. (Khilare and Shirke 2010, 2012) developed nonparametric synthetic control charts using sign statistics for shifts in location and variability respectively. (Ho and Costa 2011) proposed monitoring a wandering mean with an np chart and this chart also works with sign statistic. (Yang et al. 2011) provided a new EWMA Control Chart based on a simple statistic to monitor the small mean shifts in the process with non-normal or unknown distributions. (Majid and Neda 2013) developed nonparametric signed-rank control charts with variable sampling interval. (Abbasi et al. 2013) proposed nonparametric progressive mean control chart for monitoring the process target. (Liu et al. 2014) developed dual nonparametric cusum control chart based on ranks. (Riaz and Abbasi 2016) suggested double EWMA control chart for process monitoring. (Abid et al. 2016) reported the use of ranked set sampling in nonparametric EWMA control charts based on sign test statistic. (Abid et al. 2016) proposed nonparametric EWMA control chart based on Wilcoxon signed-rank statistic for monitoring location. (Coelho et al. 2017) reported nonparametric signed-rank control charts with variable sampling intervals.
If process is running in an in-control state for a long period, it will reach in steady-state mode. In order to characterize long-term properties of a control chart, it is an appropriate to investigate the steady-state ARL. (Crosier 1986) suggested a technique for obtaining steady-state ARL of CUSUM chart using the Markov chain approach. (Saccucci and Lucas 1990) have given a FORTRAN computer program for the computation of ARL of EWMA and combined Shewhart-EWMA control schemes. The program calculates zero-state and steady-zero-state ARL using the Markov chain approach. (Champ 1992) computed steady-state ARL of Shewhart control chart with supplementary runs rules. (Davis and Woodall 2002) studied the steady-state properties of synthetic control chart to monitor shifts in process mean. (Lim and Cho 2009) developed a control charts with m-of-m runs rules to study the economical-statistical properties of control chart using steady-state ARL. (Khilare and Shirke 2015) studied the steady-state behavior of nonparametric control charts using sign statistic.
In present article, we proposed the synthetic control chart using runs rules for monitoring the median of a continuous characteristic of the underlying process. The main purpose of the paper is to study the steady-state behavior of the synthetic control chart based on signed-rank statistic when process runs in an in-control state for long time. Rest of paper is organized as follows.
chart. The steady-state performance of the synthetic control chart is given in section 6. Section 7 gives numerical example. Concluding remarks are given in section 8.
2. A Control Chart Based On the Signed-Rank Statistic:
Let (Xt1,Xt2 , ….. , Xtn) be a random sample (subgroup) of size n>1 observed from a
continuous process with median θ at sampling instances t =1, 2, …... It is assumed that the underlying process distribution is continuous symmetric and that the in-control process median is known or specified to be equal to θ0. We further assume that θ0 is
known and when θ ≠ θ0 the process is out-of-control. (Bakir 2004) provided a
nonparametric control chart based on the signed-rank statistic. For the tth subgroup
sample (xt1, xt2, ... ,xtn), the signed- rank statistic is defined as
0 1
( )
n
t tj tj
j
sign x R
, t =1, 2, ... (1)Where, sign (u) = -1, 0, 1 if u< 0, = 0, > 0 and
0 0
1
1 (| | | |)
n
tj ti tj
i
R I x x
with I(a < b) = 1 if a < b and 0 otherwise.
We can rewrite (1) as
( 1)
2
2
t t
n n w
. (2)
Wherewt is the well-known Wilcoxon Signed-rank Statistic (the sum of the ranks of the absolute values of the deviations corresponding to the positive deviations). One can therefore use
ψ
t given in (2) as a charting statistic instead using (1). Let UCL be the upper control limit corresponding to a positive-sided control chart. The chart gives an out-of-control signal at the first sampling instance t for whichψ
t
UCL. In the following section we briefly describe conforming run length control chart.3. The Conforming Run Length Control Chart
The conforming run length (CRL) chart was originally developed for attribute quality control by (Bourke 1991). In 100% inspection, the CRL is the number of inspected units between two consecutive nonconforming units (including the ending nonconforming unit). The CRL chart uses the CRL as the charting statistic. The idea behind the CRL chart is that the conforming run length will change when the fraction nonconforming ‘p’ in the
process changes. The CRL is shortened as p increases and lengthened as p decreases. The charting statistic (CRL) follows a geometric distribution with parameter p. The mean value of CRL (i.e. the average number of inspected units in a CRL sample) is
p
CRL 1
, (3)
and its cumulative distribution function (c. d. f.) is given by,
CRL
1
1 p
; CRL1,2,...If our only concern is the detection of an increase in p, the lower control limit (denoted L) is sufficient for the CRL chart. If CRL is the specified/desired type I error of the CRL
chart and p0 is the in-control fraction nonconforming, L can be derived from the following equation.
Lp
CRL F 0 L 1 1 p0
,
which gives
0
ln 1
ln 1
CRL
L
p
. (5)
Note that L must be rounded to the largest integer smaller than or equal to the calculated value in (5). If the sample CRL (i.e. the charting statistic) is smaller than or equal to L
then it is very likely that the fraction nonconforming p has increased and therefore, an out-of-control signal will be given. ARLCRLis the average number of CRL samples
required to detect change in p. The ARLCRL is given by
Unitisnonconfor g CRLbetwwentwononconfor gunits L
P
ARLCRL
min min
1
, (6)
.
.1 .
1
L F p L CRL P p
ARLCRL
Where,
Unitisnonconfor g
Pp min and F
L 1
1 p
L.Therefore,
1
. 1 1
CRL L
ARL
p p
(7)
In section 4 we briefly discuss synthetic control chart using signed-rank statistic.
4. A Nonparametric Synthetic Control Chart
4.1. Operations
The operations of the nonparametric synthetic control chart are as follows:
1. Decide on the upper control limit of the
ψ
tchart and the lower limit L of the CRLchart. The design of these control parameters will be described shortly.
2. At each inspection point ‘t’ take a random sample of n observations and calculate
t
ψ
.3. If
ψ
t<UCL, (the sample is called a conforming sample) then control flow goes back to step (2) (That is continue to draw random samples from the process and calculate the statisticψ
t).Otherwise, the sample is called a nonconforming sample and control flow goes to the next step.4. Check the number of samples between the current and the last nonconforming sample (including the current sample). This number is taken as the value of the plotting statistic (i.e. CRL) of the CRL chart in the synthetic chart.
5. If this CRL is larger than the lower control limit of the CRL chart, then the process is thought to be under control and the charting procedure is continued. Otherwise, the process is declared to be out of control and control flow goes to the next step. 6. Take the necessary action to find and remove the assignable cause(s).
4.2. ARL of the synthetic control chart:
The probability that a synthetic control chart produces an out-of-control signal is given by
Q
p .P , where,p
P
samplesampleisnonconforming
, p
P
t UCL/ 0
, andP
PCRLbetween two nonconformingsamplesL
, P
P
CRL L
,P
1
1p
L
.Hence, ARL of synthetic control chart is given by
L
Sp p
Q ARL
1 1
1 1
.
4.3. Design
The synthetic chart has two parameters namely, L and UCL. For given in-control ARL
and subgroup sample size n, the parameters L and UCL are obtained as follows.
Let ARLS
be the out-of-control ARL of the synthetic control chart and can be obtained using formula given below.
L
Sp p
ARL
1 1
1
Here p(δ) is the probability that the sample is nonconforming, when the permanent upward step shift of δ units occurs in the process. When there is no shift, δ is equal to zero. We note that in equation (7), ‘p’ is the probability that a unit is nonconforming,
while p(δ) defined above is the probability that the sample is nonconforming. Thus p(δ) plays the role of p in equation (7).
We note that the in-control ARL of the synthetic chart is given by ARLs(0), where
1 (0)
(0) (1 (1 (0)) )L
ARLs
p p
. (8)
Suppose the desired in-control ARL is ARL(0) and the subgroup sample size is n. We compute the ARLs(0) values using equation (8) for UCL=1,2,…,(n(n+1)/2) and
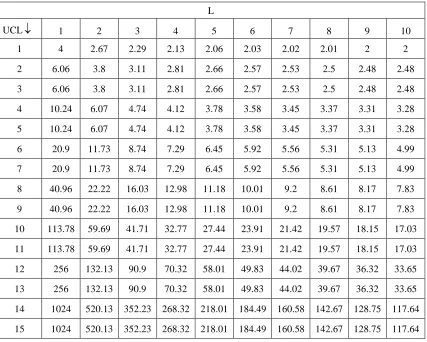
L=1,2,…… and choose that pair of (L, UCL) for which the ARLs(0) is close to ARL(0). We may note that for a fixed value of UCL, ARLs(0) is a decreasing function of L, while for a fixed value of L, ARLs(0) is a non-decreasing function of UCL. Table 1 gives values of ARLs(0) for n =5. As an example, suppose we wish to set ARL(0)at 32. Then, from Table 1, we see that L=4 and UCL=10 is the required pair as the ARLs(0) corresponding to these values is 32.77.
Table 1: In control ARL values for positive sided chart for various values of UCL and L then n=5
L
UCL 1 2 3 4 5 6 7 8 9 10
1 4 2.67 2.29 2.13 2.06 2.03 2.02 2.01 2 2
2 6.06 3.8 3.11 2.81 2.66 2.57 2.53 2.5 2.48 2.48
3 6.06 3.8 3.11 2.81 2.66 2.57 2.53 2.5 2.48 2.48
4 10.24 6.07 4.74 4.12 3.78 3.58 3.45 3.37 3.31 3.28
5 10.24 6.07 4.74 4.12 3.78 3.58 3.45 3.37 3.31 3.28
6 20.9 11.73 8.74 7.29 6.45 5.92 5.56 5.31 5.13 4.99
7 20.9 11.73 8.74 7.29 6.45 5.92 5.56 5.31 5.13 4.99
8 40.96 22.22 16.03 12.98 11.18 10.01 9.2 8.61 8.17 7.83
9 40.96 22.22 16.03 12.98 11.18 10.01 9.2 8.61 8.17 7.83
10 113.78 59.69 41.71 32.77 27.44 23.91 21.42 19.57 18.15 17.03
11 113.78 59.69 41.71 32.77 27.44 23.91 21.42 19.57 18.15 17.03
12 256 132.13 90.9 70.32 58.01 49.83 44.02 39.67 36.32 33.65
13 256 132.13 90.9 70.32 58.01 49.83 44.02 39.67 36.32 33.65
14 1024 520.13 352.23 268.32 218.01 184.49 160.58 142.67 128.75 117.64
5. Runs Rule Representation of the Synthetic Control Chart
The runs rule representation of synthetic control chart to detect shifts in the location parameter for X control chart has been studied by (Davis and Woodall 2002). This section presents the runs rule representation of a nonparametric synthetic control chart using signed-rank statistic. For the runs rule representation of the proposed nonparametric synthetic control chart using sign-rank statistic, the procedure of (Davis and Woodall 2002) is followed. Let ‘0’ denotes conforming sample and ‘1’ denotes nonconforming sample. If value of signed-rank statistic falls within control limit, the sample is conforming and if it falls out-side the control limit then sample is nonconforming. Thus a sequence of
ψ
t can be represented by a string of ‘0’ and ‘1’. For example 100100 would indicate that in a sequence of six samples, the first and third samples are nonconforming samples, while the rest are conforming. For simplicity, suppose that L of CRL chart is equal to 4. This means that any sequence ofψ
t with pattern 10001, 1001, 101 or 11 will generate an out-of-control signal for the synthetic chart. In general, such sequence also generates signal under the following runs rule:If two out-of-L1 consecutive signed-rank statistics fall out-side of the control limit, the control chart signals an out-of-control status.
On initial pattern of 0001, the synthetic control chart will signal usingL4, while two-of-L1control chart would not. The performance of both the control charts can be made identical over all the samples using head start feature in the runs rule representation; that is , it is assumed that the there is signed-rank statistic at time zero and that falls out-side of the control limit. With this head start, both control charts will signal on initial patterns 1, 01, and 001 but not on the initial pattern 0001.Thus, performance of the synthetic and two-of-L+1 charts is now identical for all possible sequences of
ψ
t.
If CRL value is less than or equal toL, then declare that the process is out-of-control. Thus, the syntheticcontrol chart using ψt identical to the above runs rule with the head start a
ψ
t at time zero is observed and is nonconforming. In the following, we present the Markov chain model and ATS results of synthetic control chart.5.1. Steady-State Average Time to Signal of the Synthetic Control Chart:
The steady-state ARL of the proposed synthetic control chart can be obtained using the Markov chain approach. The states of transition probability matrix (t.p.m.) are based on the lower control limit of the CRL chart.
Consider the case whereL3. This chart is an identical to a chart which signals if two-of-four rank statistics fall out-side of the control limit, assuming that a signed-rank statistic at time zero is out-side of control limit.
Let
The probability of next observed signed-rank statistic will be lies below the upper control limit is
, )
Pr( UCL
A t and B1A.
Davis and Woodall (2002) suggested that the following t.p.m. would govern the Markov chain for the synthetic control chart.
• The row contains ‘A’ in first column and ‘B’ in second column.
• The last row contains ‘A’ in first column.
• In all other rows, the entry above the diagonal is ‘A’.
• In all other locations, the entry is zero.
Table 2: The transition probability matrix for the synthetic control chart using signed-rank statistic when L= 3
States 000 001 010 100 Signal
000 A B 0 0 0
001 0 0 A 0 B
010 0 0 0 A B
100 A 0 0 0 B
Signal 0 0 0 0 1
With this Markov chain model, the zero-state ARL (0SARL) is
, 1 ) (
0SARL s' IQ 1 (9)
hence, zero-state average time to signal (0SATS) is given by
, * ) 5 . 0 0
(
0SATS SARL h (10)
where, Q is an L1 by L1 matrix of probabilities obtained by deleting last row and last column from the above matrix, 1 is column vector of appropriate order having all elements unity and I is an L1 by L1 identity matrix, s is an initial probabilities of an orderL1, 1 for initial state and 0 for the rest of the cases, s'= [0, 1, 0,…, 0, 0]. A state ‘001’ is an initial state.
Let Q0be the stochastic matrix obtained from matrixQ. Let be a row vector
corresponding to the stationary probability distribution ofQ0. The SSARL of the synthetic chart using sign-rank statistic is given by
. 1 )
( 0 1
'
I Q
SSARL (11)
The can be obtained as
,
' 0 Q
subject to constraint
. 1
1
n
i i
Finally SSATS is given by,
. 2 1
h SSARL
SSATS (12)
Where, sampling interval (h) is adjusted according to the desired false alarms rate.
We provide steady-state performance of the synthetic control chart in the following section.
6. Steady-State Performance of the Synthetic Control Chart
When there is a shift in the process median, the distribution of the charting statistic is difficult to obtain. Therefore, we use simulation to obtain the ATS values for various shifts in the process median. A simulation study based on 10000 runs is performed for sample of sizes n=5, n=10 and the corresponding in-control ATS values are 32 and 380 respectively for computing probabilities of next observed signed-rank statistic will falls below upper control limit for different shifts. The simulation study is carried out for three continuous symmetric distributions namely the normal, double exponential and Cauchy. As in (Bakir 2004), the scale parameter is set to be
= 1/√2 for the double exponential distribution to achieve a standard deviation of 1.0. For the Cauchy distribution,
=0.2605 is chosen to achieve a tail probability of 0.05 above
+ 1.645, the same as that ofa normal distribution with a mean
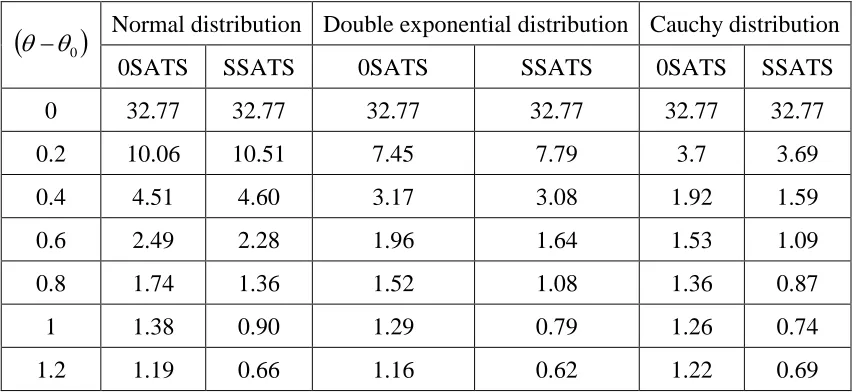
and a standard deviation of 1.0. These three distributions are continuous symmetric about their median but have different tail behavior. Moreover, the tail probabilities, say above 3 are 0.0013499, 0.007185 and 0.0275707, while the tail probabilities above 4 are 0.00003167, 0.0017467 and 0.0207007 respectively for the normal, the double exponential and the Cauchy distributions. In most of times practitioners are interested only in upward shifts in the process median; therefore, in this paper we computed zero-state and steady-state ATS values only for up-ward shifts. Similarly we can compute zero-state and steady-state ATS values for down ward shifts and two-sided shifts in process median. Table 3 and Table 4 give the zero-state and steady-state ATS profile of the synthetic control chart to detect upward shifts in the process median.
0
Normal distribution Double exponential distribution Cauchy distribution
0SATS SSATS 0SATS SSATS 0SATS SSATS
0 32.77 32.77 32.77 32.77 32.77 32.77
0.2 10.06 10.51 7.45 7.79 3.7 3.69
0.4 4.51 4.60 3.17 3.08 1.92 1.59
0.6 2.49 2.28 1.96 1.64 1.53 1.09
0.8 1.74 1.36 1.52 1.08 1.36 0.87
1 1.38 0.90 1.29 0.79 1.26 0.74
1.2 1.19 0.66 1.16 0.62 1.22 0.69
From Table 3 we observed that:
• For normal and double exponential distributions the steady-state ATS values are large as compared to zero-state ATS values only for small shifts in median.
• For Cauchy distribution zero-state ATS values are large as compared to the steady-state ATS values but not significantly different.
Table 4: Zero-state and steady-state ATS values of the synthetic control chart with n=10, L=8, ARL(0)= 380 and UCL=40
0
Normal distribution Double exponential distribution Cauchy distribution
0SATS SSATS 0SATS SSATS 0SATS SSATS
0 380.00 380.00 380.00 380.00 380.00 380.00
0.2 37.98 43.86 21.12 25.48 6.44 8.28
0.4 7.56 9.67 4.43 5.69 2.10 2.54
0.6 2.64 3.29 1.87 2.21 1.36 1.51
0.8 1.32 1.46 1.13 1.21 1.12 1.19
1 0.85 0.85 0.82 0.81 0.95 0.98
1.2 1.15 1.18 1.17 1.21 1.38 1.50
Following are the findings from Table 4:
• When subgroup sample size n=10, the steady-state ATS performance is worth as compared to the zero-state ATS for all considered distributions.
• Steady-state ATS performance of the synthetic control chart is better under Cauchy distribution than double exponential and normal distributions.
7. Numerical Example
The operations of the proposed control chart can be illustrated using data related to the diameter of casting taken from Montgomery-2009 (Exercise example 6.69, page no.-286). The data set contains 20 samples each of size five. The median of the data set is to be 11.7531. To have an in-control ARL equal to 32, the parameters of the upper-sided synthetic control chart are UCL=10 and L = 4. A sample is conforming one when
UCL
t
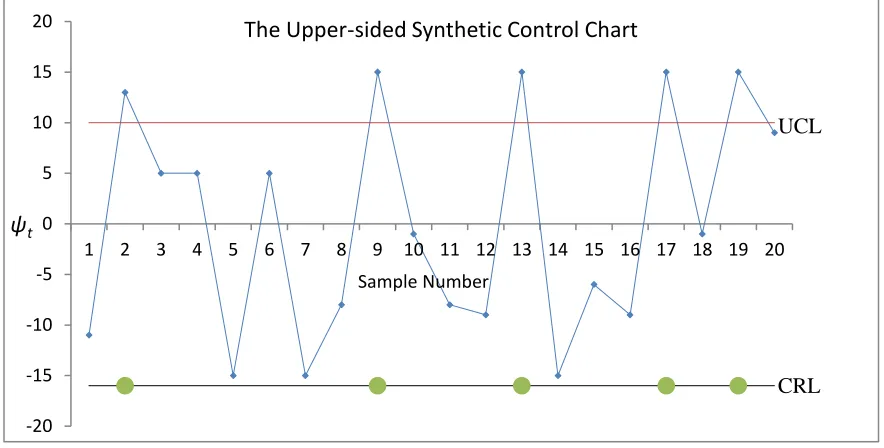
. Table 5 depicts the values of the signed-rank statistic defined in equation (1) for 20 samples. Figure 1 gives the upper-sided synthetic control chart using signed-rank statistic. The synthetic control chart signals an out-of-control status, if CRL L. Figure 1 show that the signed-rank statistic of sample two is plotted above UCL. That is sample two is nonconforming and CRL at this time epoch is 2 which is less than L; hence, synthetic control chart signals an out-of-control status at time epoch 2. The synthetic control chart also signals at time epochs 13, 17 and 19.
Table 5: Sample number and Signed-rank statistic
Sr. No. Sign-rank statistic
1 -11
2 13
3 5
4 5
5 -15
6 5
7 -15
8 -8
9 15
10 -1
11 -8
12 -9
13 15
14 -15
15 -6
16 -9
17 15
18 -1
19 15
Figure 1: The upper-sided synthetic control chart
8. Conclusions
In this article we studied the steady-state behaviour of the synthetic control chart using signed-rank statistic for shifts in the process median. The steady-state ATS values are computed using Markov chain approach. To compute steady-state ATS, the performance of the synthetic control chart and two-of-L+1 control chart can be made identical over all samples with head start features. When subgroup sample size n=10, the steady-state performance of the synthetic control chart is worth for small to moderate shifts under all considered symmetric distributions. When subgroup sample size n=5, steady-state ATS values are larger under normal and double exponential distributions only for small shifts. However, under the Cauchy distribution zero-state ATS values are larger but not significantly larger as compared to steady-state ATS values. Usefulness of proposed control chart explored using numerical example. Proposed control chart is simple and easy to use for practitioners.
References
1. Abbasi S. A., Miller A. and Riaz M. (2013). Nonparametric progressive mean control chart for monitoring process target. Quality and Reliability Engineering International 29: 1069-1080.
2. Abid M., Nazir H. Z., Riaz M. and Lin Z. (2016). Use of ranked set sampling in nonparametric control charts. Journal of the Chinese Institute of Engineers 39: 627-636.
3. Abid M., Nazir M. and Lin Z. (2016). An efficient non-parametric EWMA Wilcoxon signed-rank chart for monitoring location. Quality and Reliability Engineering International 33: 669-685.
-20 -15 -10 -5 0 5 10 15 20
1 2 3 4 5 6 7 8 9 10 11 12 13 14 15 16 17 18 19 20
ψt
Sample Number
The Upper-sided Synthetic Control Chart
UCL
4. Amin R.W., Reynolds M. R. Jr. and Bakir S. T. (1995). Nonparametric quality control charts based on the sign statistic. Communications in Statistic-Theory and Methods 24(6): 1597-1623.
5. Bakir S. T. (2004). A distribution-free Shewhart quality control chart based on signed-ranks. Quality Engineering 16(4): 613-623.
6. Bakir S. T. (2006). Distribution-free quality control charts based on signed-rank-like statistic. Communications in Statistics-Theory and Methods 35: 743-757.
7. Bakir S. T. and Reynolds M .R. Jr. (1979). A nonparametric procedure for process control based on within-group ranking. Technometrics 2: 175-183.
8. Bourke P. D. (1991). Detecting a shift in fraction nonconforming using run-length control charts with 100% inspection. Journal of Quality Technology 23: 225- 238.
9. Bradley J. V. (1973). The central limit effect for a variety of populations and the influence of population moments. Journal of Quality Technology 5: 171-177.
10. Chakraborti S. and Eryilmaz S. (2007). A nonparametric Shewhart-type signed-rank control chart based on runs. Communications in Statistics-Simulation and Computations 36: 335-356.
11. Chakraborti S. and Van de Wiel M. A. (2008). A nonparametric control charts based on mann-whitney statistic. IMS Collection 1: 156-172.
12. Chakraborti S., Van der Laan P. and Bakir S. (2001). Nonparametric control charts: An overview and some results. Journal of Quality Technology 33: 304– 315.
13. Champ W. C. (1992). Steady-state run length analysis of a shewhart control chart with supplementary runs rules. Communications in Statistics- Theory and Methods 21: 765-777.
14. Charts. Industrial Quality Control 23(11): 563-568.
15. Coelho M. L. I., Graham M. A. and Chaktraborti S. (2017). Monitoring location: A nonparametric control charts with variable sampling intervals. Quality and Reliability Engineering International 33:2181-2192.
16. Crosier R. B. (1986). A new two-sided cumulative sum quality control scheme. Technometrics 28(3): 187-194.
17. Davis R. B. and Woodall W. H. (2002). Evaluating and improving the synthetic control chart. Journal of Quality Technology 34(2): 200-208.
18. Hackl L. and Ledolter J. (1991). A control chart based on ranks. Journal of Quality Technology 23: 117-124.
19. Ho L. L. and Costa A. F. B. (2011). Monitoring a wandering mean with an np chart. Producao 21(2): 254-258.
21. Khilare S. K. and Shirke D. T. (2010). A nonparametric synthetic control chart using sign statistic. Communications in Statistics-Theory and Methods 39: 3282-3293.
22. Khilare S. K. and Shirke D. T. (2012). Nonparametric synthetic control charts for process variation. Quality and Reliability Engineering International 28(2): 193-202.
23. Khilare S. K. and Shirke D. T. (2015). Steady-state behavior of nonparametric control charts using sign statistic. Production 25:739-749.
24. Lim T. and Cho M. (2009). Design of control charts with m-of-m runs rules. Quality and Reliability Engineering International 25: 1085-1101.
25. Liu L., Zhang J. and Zi X. (2014). Dual nonparametric CUSUM control chart based on ranks. Communications in Statistics-Simulation and Computation 44:756-772.
26. Montgomery D. C. (2009). Introduction to statistical quality control. Arizona State University. Johan Willey and Sons.
27. Majid N. and Neda N. (2013). Nonparametric Shewhart-type signed-rank control chart with variable sampling intervals. Quality and Reliability Engineering International 24(2): 184-189.
28. Pawar V. Y. and Shirke D. T. (2010). A nonparametric Shewhart-type synthetic control chart. Communications in Statistics-Simulation and Computation 39(8): 1493-1505.
29. Riaz M. and Abbasi S. (2016). Nonparametric double EWMA control chart for process monitoring. Revista Colombian de Estadistica 39: 167-184.
30. Saccucci M. S. and Lucas J. M. (1990). Average run length for exponentially weighted moving average control schemes using the markov chain approach. Journal of Quality Technology 22(2): 154-162.
31. Schilling E. G. and Nelson P. R. (1976). The effect of non-normality on the control limits of x-bar charts. Journal of Quality Technology 8: 183–188.
32. Wu Z. and Spedding T. A. (2000). A synthetic control chart for detecting small shifts in the process mean. Journal of Quality Technology 32: 32-38.