Baghdad Science Journal
Vol.13(3)2016
DOI:http://dx.doi.org/10.21123/bsj.2016.13.3.0524
Degradation of Brilliant Green by Using a bentonite Clay-
Based Fe Nano Composite Film as a Heterogeneous Photo-
Fenton Catalyst.
Khulood Abid Saleh AL-Saade * Shatha Fadel Al- Saidi**
Hamdia Hateem Juad***
*Department of Chemistry, College of Science, University of Baghdad. **Department of Chemistry, College of Science, University of Nahrain.
*** Department of Chemistry, College of Science for Women, University of Baghdad
E-mail:[email protected]
Received 26/ 11/2014 Accepted 28/ 6/2015
This work is licensed under a Creative Commons Attribution-NonCommercial-NoDerivatives 4.0 International Licens
Abstract:
This paper aims to study the chemical degradation of Brilliant Green in water via photo-Fenton (H2O2/Fe2+/UV) and Fenton (H2O2/Fe2+) reaction. Fe- B nano particles
are applied as incrustation in the inner wall surface of reactor. The data form X- Ray diffraction (XRD) analysis that Fe- B nanocomposite catalyst consist mainly of SiO2
(quartz) and Fe2O3 (hematite) crystallites. B.G dye degradation is estimated to
discover the catalytic action of Fe- B synthesized surface in the presence of UVC light and hydrogen peroxide. B.G dye solution with 10 ppm primary concentration is reduced by 99.9% under the later parameter 2ml H2O2, pH= 7, temperature =25°C
within 10 min. It is clear that pH of the solution affects the photo- catalytic degradation of B.G dye. All the conditions above have been studied to reach the optimum operation condition for the two processes Fenton and photo- Fenton. The B.G degradation process follows first- order reaction rules. Photo- Fenton process causes a more efficient oxidation rate than the Fenton process. So, the photo- Fenton degradation is an effective and economic process by producing higher percentage of degradation and mineralization in short radiation time.
Key words: Advanced Oxidation Processes, Fenton, Photo-Fenton, B.G dye.
Introduction:
All dyes molecules are stable and difficult to degrade biologically [1], so they lead to pollution problems like a form of colored waste water discharged; into environmental water bodies [2]. The adsorption procedure is the most efficient method for removing the pollutant dyes form waste water [3-5].
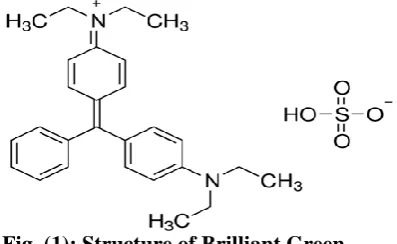
exact structure of the brilliant green dye is given in Figure (1). Brilliant green is chemically described as ammonium,
4(diethylamino)-alpha-phenylbenzylidene) (C27H34N2O4S) with
λmax=625 nm and molecular weight 482
g. mol-1. The use of brilliant green (B.G) dye has been banned in many countries due to its carcinogenic nature [1].It is used as a dye to color synthetic fibers and silk biological stain, dermatological agent, veterinary medicine, and as an additive to poultry feed to inhibit propagation of mold, intestinal parasites and fungus.It is also extensively used in textile dying and paper printing. It is considered highly toxic for humans and animals because it can cause permanent injury to eyes. It also causes irritation to the respiratory tract that leads to cough and shortness of breath. It can cause irritation to the gastrointestinal tract, which also results in nausea, vomiting and diarrhea in human beings [9].
Fig. (1): Structure of Brilliant Green
(AOP’s) have been developed during the past ten years and various kinds of advanced oxidation processes (AOP’s) are used to remove organic pollutants from waste water. Principled (AOP’s) are based on the generation of OH radicals in the solution. These OH radicals then will be responsible for the oxidation of organic compounds and act with non-selectivity. The photo reaction will cause the formation of OH radicals and regeneration of Fe2+ which can be expressed as follows [10]:
Fe2++ H2O2 UV Fe3++ OH + OH Fe(OH)2+ UV Fe2++OH
Materials and Methods:
1. Materials:
Birilliant green (B.G) as used in this study is obtained from Merck com. On the other hand, H2O2 (30%), Fe
(NO3)2.9H2O, H2SO4, NaOH, Na2CO3
and HCl (37%) are obtained from Sigma com. All predation is achieved using double distilled water. The bentonite clay used in present study is supplied from Geological Survey in Ministry of Industrial mineral, Baghdad, Iraq.
2. Preparation of Catalyst:
The preparation of Fe- bentonite nanocomposite flows in the following steps: an aqueous dispersion of bentonite clay is prepared by adding 10g bentonite clay to 500 mL H2O under
vigorous stirring for 3 hs at 25°C. Sodium carbonate is added slowly as a
Fe- B Fe- B
Reaction solution Quartz tube
Stirring bar
Electromagnetic Stirrer
8W UVC lamp
Fig. (2): Experimental Set- up of the
Photo- Reactor Coated with A Fe- B[12].
3. Preparation of Dye Sample:
Standard stock solutions of 500 mg/L of brilliant green are prepared by diluting the corresponding mass of brilliant green in de- ionized water and protected from light. A different initial concentration of brilliant green is prepared by further diluting the standard stock solutions.
Results and Discussion:
1. Characterization of the Catalyst:
1.1 XRD:
(SHIMADZU 6000 X-Ray) X- ray diffraction is used to analyze Fe- B nanocomposite, and the result is shown in Figure (3). The strong diffraction
peaks at 2ϴ of (25.5°, 26.2°) indicate that the Fe-B nanocomposite mainly consists of SiO2 (quartz) and (33.15°,
39.28°) Fe2O3 (hematite).The increasing
in particle size lead, to higher intensity of diffraction pattern[13].
Fig. (3): XRD for: Fe-B nanocomposite
1.2 AFM Analysis:
Atomic force microscope (AFM, AA3000 of Angstrom Advanced Inc. USA), is used to investigate Fe- B nanoparticles.
AFM analysis represents data in three dimensions, so that it is possible to measure the height of the nanoparticles quantitatively. Figure (4) explain the particle size is less than 100nm and show the morphology of nanoparticle and the average particle size of Fe-B nanocomposite is around 80 nm.
Fig. (4): AFM of Fe- Bentonit Nano composite
SiO2
Fe2O3
2ϴ
In
ten
sit
2- Degradation of Brilliant Green:
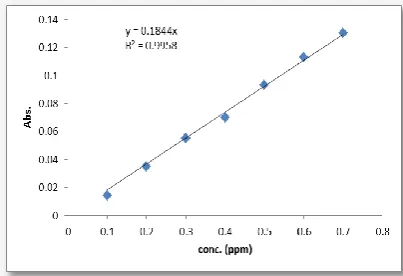
Figure (5) shows the calibration curve for B.G which is determined in λ max=
624 nm that obeys the (Lambert beer's law) at specific concentrations prepared for each compound. After that, the absorption has been recorded and a calibration curve is plotted between adsorption and concentration, the best line between the points has been drawn.
Fig. (5): Calibration Curve of B.G at λ
max= 624 nm
To study the discoloration of B.G dye, the UV-visible absorption spectra of (10 ppm) B.G dye solution at a pH=7.0 before and after treatment with photo- Fenton catalyst in the presence of 8W UVC are measured and presented in Figure 6.
Fig. (6): UV-Visible Spectra of The 10 ppm of B.G Solution Before and After Treatment with Photo- Fenton Catalyst At pH=7.0 and 298.15K For 20 min.
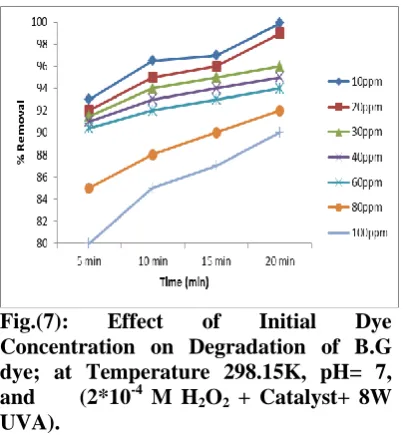
To study the effect of initial dye concentration on the degradation efficiency, the experiments are carried out by using different initial
concentration (10- 100) ppm at temperature 298.15K, pH= 7, and in presence (2*10-4 M H2O2 + catalyst+
8W UVA), Figure7 shows that the higher the initial dye concentration after 20 min leads to 90% percentage, while for 10ppm B.G concentration after 20 min reaches to 99.9%. This phenomenon might be due to the fact that the number of dye molecules is increased but the number of OH. is still constant. On the other hand, with the increase in initial concentration of the dye, more dye molecules are adsorbed onto the surface of the catalyst, leading to a decrease in oxidation process. Figure (8) shows dark- Fenton without any UV light, in presence of (2*10-4 M H2O2) ,and the
catalyst at temperature 298.15K , pH= 7, the degradation of 10 ppm B.G dye after 20 min is 99% and for 100ppm dye is 90%. Similar results are obtained with photo- Fenton reaction. Figure (9) shows that in the absence of H2O2, with
the catalyst at temperature of 298.15K , pH= 7, the degradation of 10 ppm B.G dye after 20 min is 95% and for 100ppm dye is 91%. This is indicates that H2O2
is important in diluting concentration of dye but isn't important in high B.G concentration. Figure (10) shows the effect of H2O2 concentration on the B.G
dye degradation at temperature 298.15K, pH= 7, and (catalyst+ 8W UVA), 10 ppm of B.G dye degradation is 99% in case the concentration of H2O2 is 0.4*10-3M while the degradation
percentage is 99.9% in case of using 3*10-3M H2O2 for high B.G dye
concentration (100ppm). Low H2O2
concentration (0.4*10-4M) leads to making the degradation percentage reach 89%.It is clear that 0.8*10-3M H2O2 is suitable to reach degradation
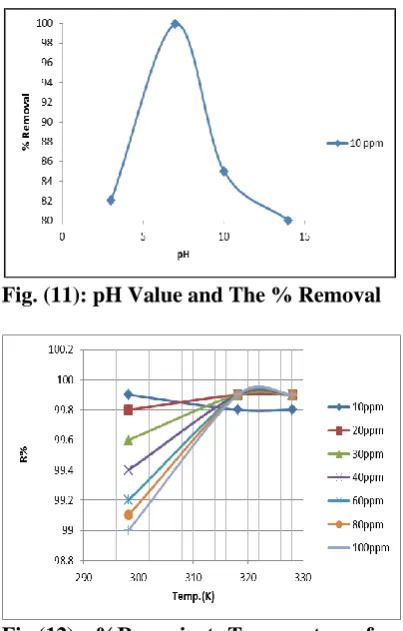
percentage ranging (99- 100)% for B.G concentration 10,60,100ppm. Figure (11) shows the effect of pH on percentage degradation of B.G dye at temperature 298.15K, and in presence of (2*10-4 M H O + catalyst+ 8W Befor
e
UVA).It is clear that the photo- Fenton degradation depends strongly on pH of the reaction medium, whereas the degradation percentage of B.G increases with increasing pH up to 7.0 and then percentage degradation of B.G decreases with increasing pH to pH= 14. The effect of temperature on the degradation of B.G dye is investigated in three different temperatures (298.15, 308.15, 318.15) K at the following condition pH=7, with different initial concentration (10, 20, 30, 40, 60, 80, 100) ppm of B.G. The results in Figure (12) show that, the degradation 10ppm of B.G decreases as temperature increases indicating an anti- Arrhenius relation. Then after increasing the temperature more than 318.15K, the R% stays with in the same level. Removal percentage for (20, 30, 40, 60, 80, 100) ppm increases when temperature increases until 320K the R% does not change for 320 to 330K. The degradation of B.G dye by Fenton is a first order reaction. This is determined from the slope of the linear plot of logarithmic remaining B.G concentration versus treatment time t as shown in the following Figure (13).
Fig.(7): Effect of Initial Dye
Concentration on Degradation of B.G dye; at Temperature 298.15K, pH= 7, and (2*10-4 M H2O2 + Catalyst+ 8W UVA).
Fig. (8): %R Against Time for Different B.G dye Concentration with 2*10-4 H2O2 and without UV- light at 298.15
Fig. (9): %R Against Time for Different B.G Dye Concentration with UV- Light and without H2O2 at 298.15
Fig. (10): Variation of R% with H2O2
Concentration for Different B.G
Fig. (11): pH Value and The % Removal
Fig.(12): %R against Temperature for Different B.G Dye Concentration after 20 Minutes
Fig. (13): The Relation between –logC and Time (min) at Temperature 298.15K
Conclusion:
Degradation of B.G dye is conducted by using bentonite clay- based Fe nanocomposite (Fe-B) film as a heterogeneous photo-Fenton catalyst in the presence of UVC light and H2O2.
Under optimal conditions (pH= 7, 2*10
-3
M H2O2, and 1* 8W UVC), 99.9%
degradation of B.G dye can be achieved in 20 minute. The Fe-B coated catalyst
wastewater for an integrated system consisting of a photochemical reactor and biological reactor.
Reference:
[1] Wang, S. and Li, H. T. 2007. Kinetic Modeling and Mechanism of Dye Adsorption on Unburned Carbon. Dyes Pigm, 72(2):308–314.
[2] Royer, B. ;Cardoso, N. F.; Lima, E. C.; Vaghetti, J. C. P.; Simon, N. M.; Calvete, T. and Veses, R. C. 2009. Applications of Brazilian-Pine Fruit Shell in Natural and Carbonized Forms as Adsorbents to Removal of
Methylene Blue from Aqueous
Solutions – Kinetic and Equilibrium Study. J. Hazard. Mater, 164(1): 1213–1222.
[3] Pavan, F. A. S.; Dias, L. P. and Lima, E. C. 2008. Benvenutti, Removal of Congo red from Aqueous Solution by Aniline propyl silica Xerogel. Dyes Pigm, 76(1): 64–69.
[4] Royer, B.; Lima, E. C.; Cardoso, N. F.; Calvete, T. and Bruns, R. E. 2010. Statistical Design of Experiments for Optimization of Batch Adsorption Conditions for Removal of Reactive Red 194 Textile Dye from Aqueous Effluents. Chem. Eng. Commun, 197(2): 775–790.
[5] Gupta, V. K. and Suhas, I. A. 2009. Application of Low-cost Adsorbents for Dye Removal – A Review. J. Environ. Manage, 90(1): 2313–2342.
[6] Pavan, F. A.; Gushikem, Y.;
Mazzocato, A. S.; Dias, S. L. P. and Lima, E. C. 2007. Statistical Design of Experiments as a Tool for Optimizing the Batch Conditions to Methylene Blue Bio sorption on Yellow Passion Fruit and Mandarin Peels. Dyes Pigm, 72(2): 256–266. [7] Wang, S. and Zhu, Z. H. 2007.
Effects of Acidic Treatment of
Activated Carbons on Dye
Adsorption. Dyes Pigm, 75(2): 306– 314.
Aqueous Solution, J. Colloid Interface Sci., 336 (1): 398–405. [9] Tatiana, C.; Eder, C.; Lima, N. F.;
Cardoso, S. L. P. and Emerson S. 2010. Removal of Brilliant Green Dye from Aqueous Solutions Using Home Made Activated Carbons. CLEAN – Soil, Air and Water, 38 (5): 521–532.
[10] Bossmann, S. H.; Oliveros, E.; Gob, S.; Kantor, M.; Goppert, A.; Lei, Y. P. L. and Braun, A.M. 2001. Degradation of polyvinyl alcohol
(PVA) by homogeneous and
heterogeneous photo catalysis applied
to the photochemical enhanced
Fenton reaction. Water Sci. Technol., 44 (5): 257-262.
[11] Mihir, K. S. 2011. Degradation
and mineralization, of organic
contaminants by Fenton and
photo-Fenton processes: review of
mechanisms and effects of organic and inorganic additives. Research J. of Chem. and Environment, 15 (2): 96–112.
[12] Devi, L. G. and Raju, K. S. A. 2009. Degradation mechanism of diazo dyes by photo-Fenton-like process: Influence of various reaction
parameters on the degradation
kinetics. Bulgarian Chemical
Communications, 15 (1): 385–390. [13] Mohamed, E. M.; Ali, T. A. and
Mohamed, I. 2013. Heterogeneous Fenton process using steel industry
wastes for methyl orange
degradation. Apply Water Sci., 3 (1): 263–270.
ةغبصل زفحولا )ىوحٌف( عوً يئوضلا ككفحلل ةيكزح ةسارد
Brilliant Green
ا ثياًوحٌبلا ييط ماذخحساب
لعافحلل سًاجحه زيغ حطسب يوًاٌلا ذيذحلاب دوزول
زفحولا يئوضلا
**يذيعسلا لضاف ىذش *يذعسلا بحاص ذبع دولخ
*داوج نج اح ةيذوح
**
* داذغب تؼيبج ,وٕهؼنا تٍهك ,ءبًٍٍكنا ىسل . ** تؼيبج ,وٕهؼنا تٍهك ,ءبًٍٍكنا ىسل .ٌٍشُٓنا *** ىسل وٕهؼنا تٍهك ,ءبًٍٍكنا ثبُبهن داذغب تؼيبج ,:ةصلاخلا
تساسد ىنا ثحبنا ازْ فذٌٓ تغبصن ًئٕضنا ككفخنا Brilliant Green ( B.G. ) مػبفح واذخخسبب ءبًنبب ٌٕخٍُف ًئٕضنا ( UV / H2O2/ (Fe+2 ( ٌٕخٍُف مػبفحٔ H2O2/Fe+2
) تٌَٕبَ كئبلد ىح ثٍح ذٌذحنا( ٍي -جٌبَٕخُب ) دٕجٔ تٍٍُسنا تؼشلاا مٍهحح جخبثا ذلٔ .تٌشبخخي تٍهخن ًهخاذنا حطسنا ًهط ذلٔ لبؼف حطسك SiO2 )ضحسإكنا( ذٌذحنا دٕجٔٔ تٍسٍئس ةسٕصب تئٍٓب يَٕبُنا
Fe2O3
![Fig. (2): Experimental Set- up of the Photo- Reactor Coated with A Fe- B [12].](https://thumb-us.123doks.com/thumbv2/123dok_us/197771.1513300/3.595.145.457.519.731/fig-experimental-set-photo-reactor-coated-fe-b.webp)